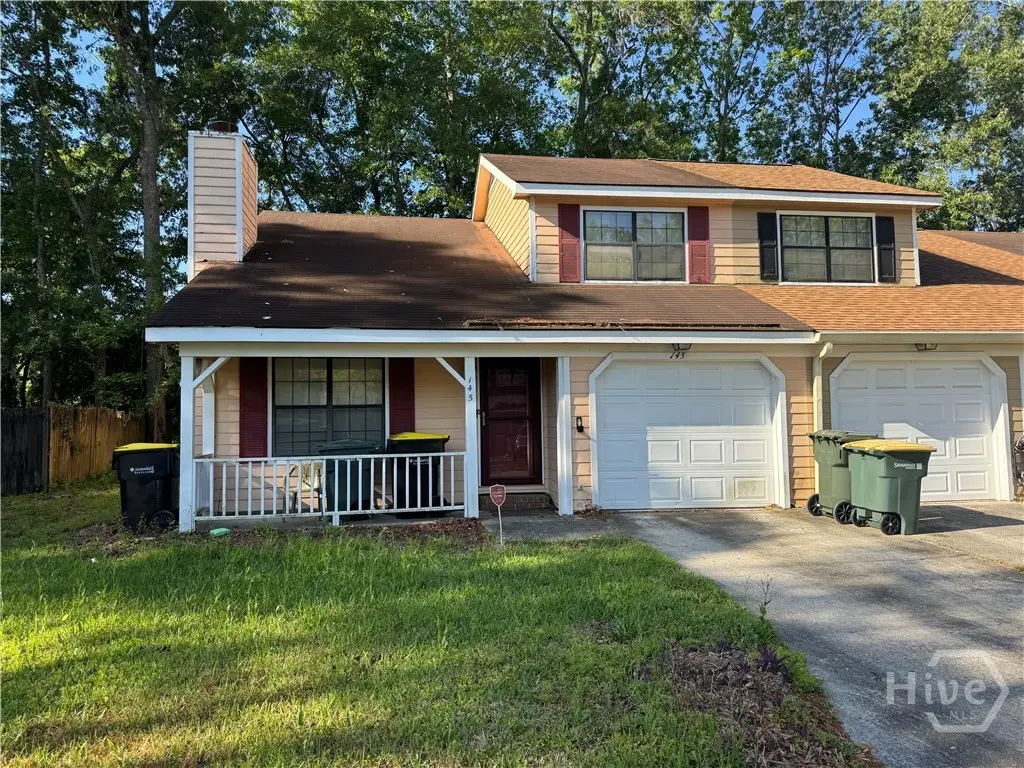
145 Holland Park Cir · Savannah, GA
Flood risk 5/10 · Moderate
- FEMA flood zone
- X (unshaded)
- Chance of flooding over 30 yrs
- 0.48%
- Est. flood insurance / yr
- $507 – $1,088
Fire risk 3/10 · Minor
- Est. fire insurance / yr
- $963 – $1,789
Heat risk 10/10 · Severe
- Hot days now (above 106°F)
- 7 days/yr
- Hot days in 30 yrs
- 18 days/yr
Wind risk 9/10 · Severe
- Chance of severe wind over 30 yrs
- 99.0%
Air-quality risk 2/10 · Minimal
- Unhealthy air days now
- 2 days/yr
- Unhealthy air days in 30 yrs
- 2 days/yr
Risk factors via First Street. Map © Google.
Why this score? — see what drove the D grade
The composite is a weighted blend of 9 inputs, each scored 0–100. Each bar is that input's sub-score; the figure is the points it added to the 100-point composite (weight × sub-score).
- Cash flow +13.8/30.0
- ARV discount +10.2/15.0
- Livability +4.3/5.0
- DSCR +4.2/10.0
- 1% rule +3.2/10.0
- Condition / age +2.5/5.0
- Rent growth +2.1/5.0
- Schools +2.0/10.0
- Appreciation +0.0/10.0
$199,900
🖨 Deal sheet 📄 Offer letter ✓ Due diligence
Listing remarks MLS
145 Holland Park in Savannah, GA is a 2-bedroom, 1.5-bath townhome with a functional layout and solid potential. This end-unit offers added privacy and extra natural light. The main level features a comfortable living area, dining space, and kitchen, along with a convenient half bath. Upstairs, you’ll find two well-sized bedrooms and a full bathroom. This townhome it a great option for investors or buyers looking to add their own personal touch. Conveniently located near shopping, dining, and major roadways.
Key facts
- Well-sized bedrooms
- Full bathroom
- Convenient half bath
Tags
Neighborhood map
What this means for you Summary
Snapshot
- This is a 2-bed/1.5-bath townhouse listed at $200k.
Deal economics
- At list price, monthly cash flow is $19 ($227/yr) — positive.
- The deal already cash-flows at list — no discount required.
- To meet the 1% rule (rent ≥ 1% of price), the offer needs to be $164k (18.0% below list).
- Recommended offer: $164k (18.0% below list) — sets the bar for 1% rule.
- Cap rate 6.4% vs local median 4.0% in Savannah — top-decile yield for the area; either an underpriced asset or a hidden risk that comps aren't pricing in. Stress-test before assuming the spread holds.
Location & tenants
- Location reads 86/100 on livability (#1 in GA, #397 nationally) — a professional / high-income tenant draw. Strengths: crime A+, amenities A+, commute A+; Watch: employment D, schools F.
- Savannah-Chatham County (urban): math 20% / reading 26% proficiency, ranked #134 of 174 in GA (top 77%) — low school quality limits family demand, transient renter base, plan for 1-2y turnover.
- Market conditions: Rents soft (-1.4%/yr); 405 active listings in the ZIP; 37 comparable units currently listed for rent nearby; rentals at typical pace (median 23d on market — plan ~3-4 weeks tenant-placement turnaround); 46% of comp listings sitting > 30 days — soft ceiling on asking rent; 2,694 units permitted in Chatham County in 2024 (973 in 5+ unit buildings).
Forward outlook
- Local home prices are declining (-3.0%/yr); year-one equity from $1k of loan paydown is wiped out by about $6k of value loss. Plan a longer hold.
- Chatham County population projected at +33% by 2050 — long-run rental-demand tailwind backs the buy-and-hold thesis.
Negotiation context
- It's been on market 53 days — a 3% lower offer ($194k) is reasonable based on typical stale-listing flexibility.
- Current owner paid $110k; list at $200k implies a 82% gain — meaningful room to come down on a strong offer.
Risks & watch-outs
- Climate carrying-cost: moderate flood risk; severe wind risk, 99% chance of damaging wind over 30y; extreme-heat days projected 7→18/yr by 2055 (HVAC capex compounding) — expect insurance premiums to compound above CPI over the hold.
Questions for the listing agent
- It's been on market 53 days. Have you received any prior offers? Is the seller open to a 18% concession, seller financing, or rate buy-down credit?
- Is there a deadline driving the sale (1031 exchange, divorce, estate, relocation)? That informs how much negotiation room exists.
- Schools are F-rated, which usually means shorter tenancies and higher turnover. Who's the typical renter profile here, and what's been the actual vacancy rate?
- The area grade is low — what's the realistic commute time and amenity access for the typical tenant pool here? Any planned neighborhood developments (good or bad) we should know about?
- What's the average days-on-market for RENTAL listings here right now (not sales)? A rising rental-DOM trend means longer vacancies and softer asking-rent achievability than the comps imply.
- What's the recent tenant-quality profile in this submarket — average credit score on applications, eviction rate, late-payment / NSF rate, and stable-employment percentage? A property-management company in the area should have these aggregated.
- How much new for-sale + rental construction is in the pipeline within 1–3 miles? Heavy new supply typically softens prices + rents 12–24 months out; constrained supply supports both.
Investment metrics
- 1% rule
- 0.82% ✗
- Cap rate
- 6.41%
- Cash-on-cash
- 0.40%
- DSCR
- 1.02
- GRM
- 10.2
CMA / ARV
- ARV (median comp)
- $212,795
- List price
- $199,900
- Delta
- -6.06%
- Verdict
- FAIR
- Comps
- 20 within 1.0 mi
Show comp detail 6 sales within ~0.75 mi
| Address | Dist | Beds/Ba | Sqft | Sold | Price | $/sf | Match |
|---|---|---|---|---|---|---|---|
| 105 Windmill Ln | 0.10mi | 2/1.5 | 1,348 (+4%) | 2mo | $219,900 | $163 | 87 |
| 107 Windmill Ln | 0.09mi | 2/1.5 | 1,348 (+4%) | 12mo | $220,000 | $163 | 78 |
| 129 Windmill Ln | 0.05mi | 2/1.5 | 1,424 (+10%) | 9mo | $135,000 | $95 | 73 |
| 127 Holland Park Cir | 0.06mi | 3/2.5 (+1) | 1,444 (+12%) | 5mo | $231,000 | $160 | 64 |
| 6 Holland Park Ct | 0.05mi | 2/2.5 | 1,136 (-12%) | 13mo | $220,000 | $194 | 62 |
| 11330 White Bluff Rd #55 | 0.56mi | 2/2.5 | 1,158 (-10%) | 3mo | $225,000 | $194 | 50 |
Match score weights: distance 35% · size 25% · config 20% · recency 20%. Top-matched comps best support the ARV.
Projected returns pro-forma
-3.0% appreciation · 0.0% rent growth · sell at horizon
- IRR
- -18.8%
- Equity multiple
- 0.36×
- Total profit
- $-36,036
- Equity at exit
- $29,806
- IRR
- -18.3%
- Equity multiple
- 0.13×
- Total profit
- $-48,567
- Equity at exit
- $17,284
Cash invested: $55,972 (down + closing). Projections, not guarantees.
Landlord ↔ Tenant lean methodology
- Overall (STATE)
- 90 Strongly Landlord-Friendly
- State Georgia
- 90 Strongly Landlord-Friendly · R+3
- County
- — inherits STATE
- City
- — inherits STATE
ZIP-level market 31419
- Home prices YoY
- -25.9%
- Rents YoY
- -1.4%
- Active inventory
- 405
- Price-to-rent
- 10.2×
Monthly cashflow live
- Estimated rent
- $1,640 high interval (Pro) →
- Mortgage (P&I)
- −$1,048
- Tax from tax record
- −$145 /mo · $1,742/yr
- Insurance
- −$83
- HOA
- −$0
- Vacancy / Maint / Mgmt
- −$344
- Net cashflow
- $19
Break-even live
UW: 25.0% down · 7.5% · 30yr · 1.5% tax · 5.0% vac · 8.0% maint · 8.0% mgmt
Financing live
Cash to close
- Down payment
- $49,975
- Closing costs
- $5,997
- Reserves months
- —
- Total cash needed
- —
Loan-product check · same deal, 3 products live
Conventional
25% down · 7.5% · 30yr
- Down + closing
- —
- Monthly P&I
- —
- Monthly cashflow
- —
- DSCR
- —
- Eligible?
- —
Personal DTI + credit; lowest rate.
DSCR
20% down · 8.5% · 30yr
- Down + closing
- —
- Monthly P&I
- —
- Monthly cashflow
- —
- DSCR
- —
- Eligible?
- —
No personal income docs; deal must DSCR.
Hard money
10% down · 12.0% · 12mo
- Down + closing
- —
- Monthly P&I
- —
- Monthly cashflow
- —
- DSCR
- —
- Eligible?
- —
Short-term bridge; refi at stabilization.
Rent comps 37 comps
| Address | Beds | Baths | Sqft | Rent | $/sqft | DOM | Units | Dist |
|---|---|---|---|---|---|---|---|---|
| 140 Windmill Ln Savannah, GA | 3.0 | 2.5 | 1388 | $1,775 | $1.28 | 43d | 1 | 0.05mi |
| 245 Holland Dr Savannah, GA | 2.0 | 2.0 | 1000 | $1,462 | $1.46 | 23d | 6 | 0.08mi |
| 10725 Abercorn St Savannah, GA | 1.0–2.0 | 1.0–2.0 | 837 | $1,713 | $2.05 | 13d | 10 | 0.28mi |
| 10875 Abercorn St Savannah, GA | 2.0 | 2.0 | 1033 | $1,475 | $1.43 | 13d | 13 | 0.32mi |
| 12509 Woodley Rd Savannah, GA | 3.0 | 2.0 | 1200 | $2,000 | $1.67 | 43d | 1 | 0.33mi |
| 10615 Abercorn St Savannah, GA | 1.0–3.0 | 1.0–1.5 | 837 | $1,454 | $1.74 | 21d | 25 | 0.36mi |
| 12510 White Bluff Rd #703 Savannah, GA | 2.0 | 2.0 | 917 | $1,299 | $1.42 | 13d | 1 | 0.39mi |
| 10612 Abercorn St Savannah, GA | 1.0–3.0 | 1.0–2.0 | 797 | $1,549 | $1.94 | 13d | 35 | 0.41mi |
| 10611 Abercorn St Savannah, GA | 1.0–2.0 | 1.0–1.5 | 917 | $1,696 | $1.85 | 13d | 13 | 0.42mi |
| 11910 White Bluff Rd Savannah, GA | 1.0–2.0 | 1.0 | 750 | $1,365 | $1.82 | 13d | 3 | 0.43mi |
| 12510 White Bluff Rd Savannah, GA | 2.0 | 2.0 | 917 | $1,325 | $1.44 | 13d | 1 | 0.46mi |
| 12510 White Bluff Rd Savannah, GA | 2.0 | 2.0 | 934 | $1,238 | $1.32 | 43d | 2 | 0.46mi |
| 11400 White Bluff Rd Savannah, GA | 1.0–3.0 | 1.0–2.0 | 1000 | $1,494 | $1.49 | 13d | 21 | 0.50mi |
| 17 Vineyard Dr Savannah, GA | 3.0 | 2.0 | 1120 | $2,195 | $1.96 | 23d | 1 | 0.60mi |
| 29 Ventura Blvd Savannah, GA | 3.0 | 2.0 | 1620 | $2,150 | $1.33 | 23d | 1 | 0.71mi |
| 12473 Northwood Rd Savannah, GA | 3.0 | 2.0 | 1422 | $2,000 | $1.41 | 43d | 1 | 0.75mi |
| 511 Dyches Dr Savannah, GA | 3.0 | 2.0 | 1758 | $2,100 | $1.19 | 23d | 1 | 0.85mi |
| 44 Knollwood Cir Savannah, GA | 2.0 | 2.5 | 1018 | $1,500 | $1.47 | 43d | 1 | 0.93mi |
| 226 Bordeaux Ln Savannah, GA | 3.0 | 2.0 | 1403 | $2,025 | $1.44 | 43d | 1 | 0.96mi |
| 12350 Mercy Blvd Savannah, GA | 1.0–2.0 | 1.0–2.0 | 865 | $1,420 | $1.64 | 13d | 14 | 0.96mi |
| 2 La Brea Blvd Savannah, GA | 3.0 | 2.0 | 1361 | $1,900 | $1.40 | 43d | 1 | 0.98mi |
| 210 Tibet Ave Savannah, GA | 2.0–3.0 | 1.5–2.5 | 1150 | $1,289 | $1.12 | 13d | 11 | 0.98mi |
| 59 Knollwood Cir Savannah, GA | 1.0 | 1.5 | 1018 | $1,400 | $1.38 | 43d | 1 | 0.98mi |
| 10014 White Bluff Rd Savannah, GA | 1.0 | 1.0 | 951 | $1,450 | $1.52 | 43d | 1 | 1.00mi |
| 406 Montclair Blvd Savannah, GA | 3.0 | 2.0 | 1422 | $1,995 | $1.40 | 13d | 1 | 1.00mi |
| 10913 Queen Ann Ct Apt D Savannah, GA | 2.0 | 1.0 | 925 | $1,750 | $1.89 | 43d | 1 | 1.00mi |
| 10910 Queen Ann Ct Apt A Savannah, GA | 2.0 | 1.0 | 925 | $1,650 | $1.78 | 43d | 1 | 1.04mi |
| 11 Knollwood Cir Savannah, GA | 2.0 | 2.5 | 1188 | $1,400 | $1.18 | 43d | 1 | 1.04mi |
| 13 N Nicholson Cir Savannah, GA | 3.0 | 2.0 | 1445 | $2,500 | $1.73 | 43d | 1 | 1.09mi |
| 9610 White Bluff Rd Savannah, GA | 2.0 | 2.0 | 1000 | $1,370 | $1.37 | 23d | 5 | 1.20mi |
| 12 Dyches Dr Savannah, GA | 3.0 | 2.0 | 1461 | $2,000 | $1.37 | 43d | 1 | 1.27mi |
| 100 Lewis Dr Unit 3D Savannah, GA | 2.0 | 1.5 | 1000 | $1,450 | $1.45 | 43d | 1 | 1.29mi |
| 6 Canterbury Cir Savannah, GA | 3.0 | 2.0 | 1848 | $2,850 | $1.54 | 43d | 1 | 1.31mi |
| 9111 White Bluff Rd Savannah, GA | 1.0–2.0 | 1.0–2.0 | 901 | $1,510 | $1.67 | 13d | 5 | 1.42mi |
| 64 Brown Pelican Dr Savannah, GA | 2.0 | 2.0 | 1364 | $1,895 | $1.39 | 43d | 1 | 1.43mi |
| 205 W Montgomery Xrds Savannah, GA | 1.0–3.0 | 1.0–2.0 | 1075 | $1,550 | $1.44 | 23d | 1 | 1.43mi |
| 201 W Montgomery Cross Rd Savannah, GA | 1.0–3.0 | 1.0–2.0 | 1013 | $1,472 | $1.45 | 13d | 18 | 1.47mi |
Listing history 12 events
-
2026-06-09days on market $199,900 Active 53 DOM
-
2026-06-08days on market $199,900 Active 52 DOM
-
2026-06-07days on market $199,900 Active 51 DOM
-
2026-06-05days on market $199,900 Active 48 DOM
-
2026-06-03days on market $199,900 Active 47 DOM
-
2026-06-02days on market $199,900 Active 46 DOM
-
2026-06-01days on market $199,900 Active 45 DOM
-
2026-05-31days on market $199,900 Active 44 DOM
-
2026-05-30days on market $199,900 Active 43 DOM
-
2026-04-15$199,900 Active 520-char remark
Show marketing remark (520 chars)
145 Holland Park in Savannah, GA is a 2-bedroom, 1.5-bath townhome with a functional layout and solid potential. This end-unit offers added privacy and extra natural light. The main level features a comfortable living area, dining space, and kitchen, along with a convenient half bath. Upstairs, you’ll find two well-sized bedrooms and a full bathroom. This townhome it a great option for investors or buyers looking to add their own personal touch. Conveniently located near shopping, dining, and major roadways.
-
2005-12-21soldstatus $110,000
-
1999-11-29soldstatus $65,000
ⓘ Source: listings_history table (triggers on properties + properties_extension) + one-shot
backfill from property_details.listing_events for pre-trigger history.
Tax reassessment forecast GA · Resets to sale price
- Current annual tax
- $1,742 · $145/mo
- Projected year-2 tax
- $1,839 · $153/mo
- Expected delta
- +$97/yr (+$8/mo · 5.6%)
ⓘ Screening estimate from a state-policy table — verify with the county assessor before closing.
Climate risk First Street
- Flood 5/10 Major FEMA zone X (unshaded) · 48% chance over 30 yrs
- Wildfire 3/10 Moderate
- Heat 10/10 Extreme 7 d/yr ≥106°F today · 18 d/yr by 30 yrs out
- Wind 9/10 Extreme 99% chance of damaging wind over 30 yrs
- Air quality 2/10 Low 2 unhealthy d/yr today · 2 by 30 yrs out
Nearby sold comps map
Loading sold comps map…
Walkable amenities ~0.75 mi
Loading nearby amenities…
Taxation est. · year 1
- Rental income
- $19,681
- − Mortgage interest
- −$11,198
- − Property taxes
- −$1,742
- − Insurance
- −$1,000
- − Repairs & maintenance
- −$1,574
- − Management
- −$1,574
- − Depreciation
- −$5,815
- Taxable loss
- −$3,223
- Est. tax savings @ 24.0%
- +$773
- After-tax cash flow
- $1,000/yr
For passive investors: Depreciation is non-cash, so a rental often shows a tax loss while cash-flowing — sheltering income. Rental losses are passive: they offset passive income freely, and up to $25,000/yr can offset ordinary (W-2) income if you actively participate and your MAGI is under $100k (phasing out to $0 by $150k); unused losses carry forward. On sale, claimed depreciation is recaptured at up to 25%, and gains may owe capital-gains tax (a 1031 exchange can defer both). Figures are a year-1 estimate at your 24.0% rate — not tax advice; consult a CPA.
Schools (NCES district)
- District
- Savannah-Chatham County
- NCES district ID
- 1301020
- Math proficiency
- 20% ▼ -11.00%
- Reading proficiency
- 26% ▼ -5.00%
- Median HH income
- $47,443
- Composite
- 20.14/100
- National rank
- #8639
- State rank
- #134 of 174 in GA
Livability — Savannah
- Score
- 86/100
- State rank
- #1
- US rank
- #397
Category grades
Schools grade is shown separately in the Schools card above.
Census & demographics
- Census place
- Savannah, GA
- County
- Chatham County · 271,602 people
- City population
- 216,564
- Metro
- Savannah, GA
- Population (ZIP)
- 57,077
- Household income
- $69,635
- Rent vs Own
- Severe rent burden
- 2575.0
Population outlook (Chatham County) Hauer SSP2
- Today (2025)
- 332,584 people
- By 2030
- 355,508 · +6.9%
- By 2040
- 400,030 · +20.3%
- By 2050
- 443,019 · +33.2%
- By 2075
- 534,579 · +60.7%
- By 2100
- 583,863 · +75.6%
Race, ethnicity, and origin ACS 2023
- Neighborhood character
- Diverse neighborhood (Simpson 0.68)
- Race & ethnicity
- White 40% Black 38% Hispanic / Latino 12% Two or more races 7% Asian 5%
- Hispanic origin (detail)
- Mexican 4% Puerto Rican 3%
- Common ancestry
- Slovak 2% Lithuanian 1% Serbian 1%
- Foreign-born
- 12% · Canada, Vietnam, South Korea
- Languages at home
- 83% English-only · Spanish 9% Other Indo-European 2% Vietnamese 1%
Political lean MEDSL · Chatham
- 2024 margin
- D (+18.0) · D 58.6% · R 40.6%
- 2008→2024 swing
- +3.6pp toward D · 2008: 14.4pp · 2024: 18.0pp
- All cycles
- 2024: D+18.0 2020: D+18.8 2016: D+14.5 2012: D+12.0 2008: D+14.4
Not yet ingested
- Civics
- —
Market trends
- HPI YoY
- ▼ -92.38%
- Current HPI
- 264.8625
- Rent YoY
- ▼ -1.44%
- Metro
- Savannah, GA
- State GDP YoY
- ▲ 2.66%
- F500 in state
- 28
Industry mix (Fortune 500 HQ in GA)
| Industry | F500 HQs | Revenue |
|---|---|---|
| Paper / Packaging | 2 | $29B |
|
||
| Retail | 1 | $160B |
|
||
| Transportation / Logistics | 1 | $91B |
|
||
| Airlines | 1 | $62B |
|
||
| Consumer Goods | 1 | $47B |
|
||
| Utilities | 1 | $25B |
|
||
Price history
+207.5% since first listed3 events — show timeline
- 2026-04-15 Listed $199,900 Hive MLS
- 2005-12-21 Sold (Public Records) $110,000 Public Records
- 1999-11-29 Sold (Public Records) $65,000 Public Records
Property tax history
+12.8%/yrLatest (2025): $1,742 · -10.3% YoY. Source: county tax records.
Cash-flow waterfall
monthlySold comps — $/sqft
last 12 mo · ≤1 miLoading sold comps…