9564 W 100 S · Medaryville, IN
Flood risk 1/10 · Minimal
- FEMA flood zone
- X (unshaded)
- Chance of flooding over 30 yrs
- 0.0%
- Est. flood insurance / yr
- $507 – $1,088
Fire risk 1/10 · Minimal
- Est. fire insurance / yr
- $717 – $1,331
Heat risk 2/10 · Minimal
- Hot days now (above 101°F)
- 7 days/yr
- Hot days in 30 yrs
- 16 days/yr
Wind risk 2/10 · Minimal
- Chance of severe wind over 30 yrs
- —
Air-quality risk 2/10 · Minimal
- Unhealthy air days now
- 1 days/yr
- Unhealthy air days in 30 yrs
- 2 days/yr
Risk factors via First Street. Map © Google.
Why this score? — see what drove the D+ grade
The composite is a weighted blend of 9 inputs, each scored 0–100. Each bar is that input's sub-score; the figure is the points it added to the 100-point composite (weight × sub-score).
- ARV discount +15.0/15.0
- Cash flow +9.9/30.0
- Appreciation +8.0/10.0
- 1% rule +3.0/10.0
- DSCR +2.8/10.0
- Schools +2.8/10.0
- Livability +2.8/5.0
- Rent growth +2.5/5.0
- Condition / age +2.5/5.0
$205,000
🖨 Deal sheet 📄 Offer letter ✓ Due diligence
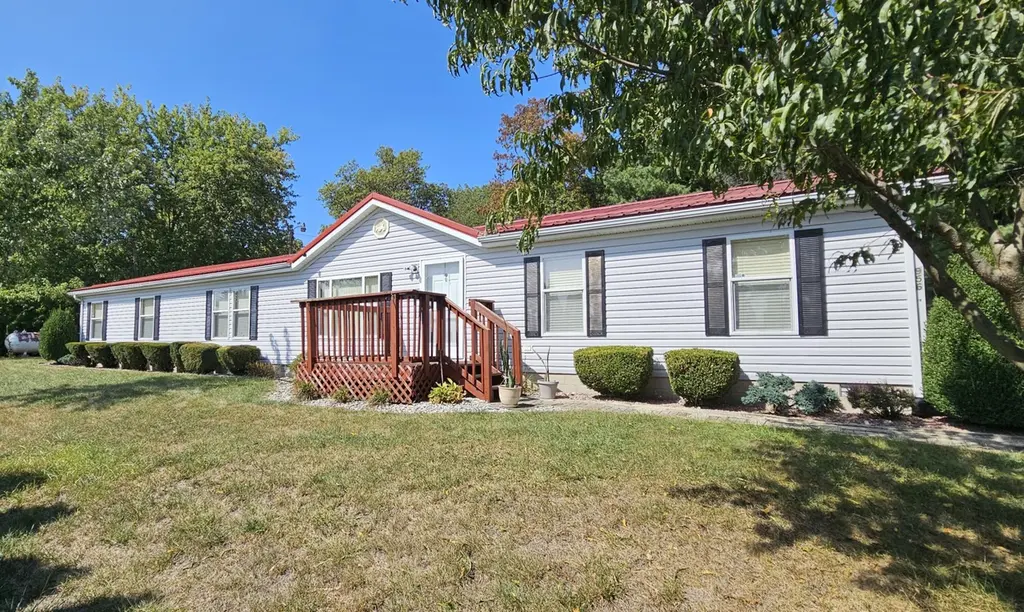
Listing remarks
If quiet country living is what you're after, then don't miss out on this 4 bedroom 2 bath ranch situated on a tree lined half acre of land. Open concept with a living room, dining room and nice sized kitchen with center island. All appliances will stay and the range was replaced in 2023. Main bedroom features a walk in closet and large attached bath with a separate shower and soaking tub. Three additional nice sized bedrooms. Home also features a full ADT security system. The 24' x 24' garage was built in 2010 and has a covered entry to the house. The metal roof on the house was installed in 2018. There is also an electric start 7500 watt generator with wired plug in to cover you during
Key facts
- 0.5 acre lot
- 2 garage spots
- Built 2001
Property features AI
Exterior
- Parking: 2-car garage; Driveway; Gravel surfaces; Garage door opener
- Security: Security system
- Utilities: Well water; Septic tank; Electricity connected (100 amp service); Propane
- Home design: Manufactured double-wide home; One story; Built in 2001
- Construction: Vinyl siding; Metal roof; Block foundation; Crawl space
- Exterior features: Rain gutters; Rural and trees/woods view; Paved county road frontage
Interior
- Kitchen: Range; Range hood; Refrigerator; Dishwasher
- Bedrooms: Primary bedroom; Bedroom 2; Bedroom 3; Bedroom 4
- Flooring: Carpet; Vinyl
- Bathrooms: 2 full bathrooms
- Heating & cooling: Forced air heat (propane); Central air conditioning
- Interior features: Ceiling fans; Soaking tub; Living room fireplace; Laundry room
- Laundry & utility: Washer; Dryer; Utility room
Neighborhood map
What this means for you Summary
Snapshot
- This is a 4-bed/2.0-bath single-family listed at $205k.
Deal economics
- At list price, monthly cash flow is $-127 ($-2k/yr) — negative.
- To cash-flow at today's rent, offer at most $187k (9.0% below list).
- To meet the 1% rule (rent ≥ 1% of price), the offer needs to be $163k (20.4% below list).
- Recommended offer: $163k (20.4% below list) — sets the bar for 1% rule.
Location & tenants
- Location reads 55/100 on livability (#632 in IN) — a working-class tenant base; expect higher turnover. Strengths: cost of living A+; Watch: schools F, crime D-, amenities F.
- West Central School Corporation (rural): math 31% / reading 34% proficiency, ranked #211 of 301 in IN (top 70%) — families likely to look elsewhere, expect single-tenant / working-renter base with shorter leases.
- Market conditions: 8 active listings in the ZIP; 25 units permitted in Pulaski County in 2024 (0 in 5+ unit buildings).
Forward outlook
- In year one you build about $14k of equity ($1k loan paydown + $12k appreciation (6.0% local appreciation)).
- Pulaski County population projected at -23% by 2050 — secular population decline; favor cash flow + early exit over multi-decade hold.
- By year 3, paydown + projected appreciation supports a ~$34k cash-out refi (75% LTV) — recoverable capital for the next deal without selling this one.
Negotiation context
- Only 12 days on market — expect competitive offers; lowballing is unlikely to land.
- 3 sale attempts since 2y ago with the ask held roughly flat each time — persistent listings suggest the price (not the market) is what's stuck; bring a comps-based counter.
Questions for the listing agent
- What do current leases actually rent for vs. the listed asking? Can we see a recent rent roll and the last 12 months of T-12 income?
- Is there a deadline driving the sale (1031 exchange, divorce, estate, relocation)? That informs how much negotiation room exists.
- Schools are F-rated, which usually means shorter tenancies and higher turnover. Who's the typical renter profile here, and what's been the actual vacancy rate?
- Crime grade is D in this area — have there been break-ins, vandalism, or insurance claims at this property in the last 3 years? What carrier currently insures it and at what premium?
- The area grade is low — what's the realistic commute time and amenity access for the typical tenant pool here? Any planned neighborhood developments (good or bad) we should know about?
- What's the average days-on-market for RENTAL listings here right now (not sales)? A rising rental-DOM trend means longer vacancies and softer asking-rent achievability than the comps imply.
- What's the recent tenant-quality profile in this submarket — average credit score on applications, eviction rate, late-payment / NSF rate, and stable-employment percentage? A property-management company in the area should have these aggregated.
- How much new for-sale + rental construction is in the pipeline within 1–3 miles? Heavy new supply typically softens prices + rents 12–24 months out; constrained supply supports both.
Investment metrics
- 1% rule
- 0.80% ✗
- Cap rate
- 5.55%
- Cash-on-cash
- -2.66%
- DSCR
- 0.88
- GRM
- 10.5
CMA / ARV
- ARV (median comp)
- $286,165
- List price
- $205,000
- Delta
- -28.36%
- Verdict
- UNDERPRICED
- Comps
- 3 within 2.0 mi
Projected returns pro-forma
5.99% appreciation · 3.0% rent growth · sell at horizon
- IRR
- 13.2%
- Equity multiple
- 1.89×
- Total profit
- $50,995
- Equity at exit
- $128,764
- IRR
- 13.7%
- Equity multiple
- 3.73×
- Total profit
- $156,425
- Equity at exit
- $233,413
Cash invested: $57,400 (down + closing). Projections, not guarantees.
Landlord ↔ Tenant lean methodology
- Overall (STATE)
- 90 Strongly Landlord-Friendly
- State Indiana
- 90 Strongly Landlord-Friendly · R+11
- County
- — inherits STATE
- City
- — inherits STATE
ZIP-level market 47946
- Home prices YoY
- 2.7%
- Active inventory
- 8
- Price-to-rent
- 10.5×
Monthly cashflow live
- Estimated rent
- $1,632 medium interval (Pro) →
- Mortgage (P&I)
- −$1,075
- Tax est. 1.5%
- −$256 /mo · $3,075/yr
- Insurance
- −$85
- HOA
- −$0
- Vacancy / Maint / Mgmt
- −$343
- Net cashflow
- $-127
Break-even live
UW: 25.0% down · 7.5% · 30yr · 1.5% tax · 5.0% vac · 8.0% maint · 8.0% mgmt
Financing live
Cash to close
- Down payment
- $51,250
- Closing costs
- $6,150
- Reserves months
- —
- Total cash needed
- —
Loan-product check · same deal, 3 products live
Conventional
25% down · 7.5% · 30yr
- Down + closing
- —
- Monthly P&I
- —
- Monthly cashflow
- —
- DSCR
- —
- Eligible?
- —
Personal DTI + credit; lowest rate.
DSCR
20% down · 8.5% · 30yr
- Down + closing
- —
- Monthly P&I
- —
- Monthly cashflow
- —
- DSCR
- —
- Eligible?
- —
No personal income docs; deal must DSCR.
Hard money
10% down · 12.0% · 12mo
- Down + closing
- —
- Monthly P&I
- —
- Monthly cashflow
- —
- DSCR
- —
- Eligible?
- —
Short-term bridge; refi at stabilization.
Listing history 8 events
-
2026-05-18status Pending 795-char remark
-
2026-05-06$205,000 Active 795-char remark
-
2026-04-01historical
-
2025-09-22status Active
-
2025-08-14historical
-
2024-12-25price $210,000
-
2024-10-25price $215,000
-
2024-09-17$220,000 Active
ⓘ Source: listings_history table (triggers on properties + properties_extension) + one-shot
backfill from property_details.listing_events for pre-trigger history.
Climate risk First Street
- Flood 1/10 Low FEMA zone X (unshaded) · 0% chance over 30 yrs
- Wildfire 1/10 Low
- Heat 2/10 Low 7 d/yr ≥101°F today · 16 d/yr by 30 yrs out
- Wind 2/10 Low
- Air quality 2/10 Low 1 unhealthy d/yr today · 2 by 30 yrs out
Nearby sold comps map
Loading sold comps map…
Walkable amenities ~0.75 mi
Loading nearby amenities…
Taxation est. · year 1
- Rental income
- $19,584
- − Mortgage interest
- −$11,483
- − Property taxes
- −$3,075
- − Insurance
- −$1,025
- − Repairs & maintenance
- −$1,567
- − Management
- −$1,567
- − Depreciation
- −$5,964
- Taxable loss
- −$5,096
- Est. tax savings @ 24.0%
- +$1,223
- After-tax cash flow
- $-306/yr
For passive investors: Depreciation is non-cash, so a rental often shows a tax loss while cash-flowing — sheltering income. Rental losses are passive: they offset passive income freely, and up to $25,000/yr can offset ordinary (W-2) income if you actively participate and your MAGI is under $100k (phasing out to $0 by $150k); unused losses carry forward. On sale, claimed depreciation is recaptured at up to 25%, and gains may owe capital-gains tax (a 1031 exchange can defer both). Figures are a year-1 estimate at your 24.0% rate — not tax advice; consult a CPA.
Schools (NCES district)
- District
- West Central School Corporation
- NCES district ID
- 1809360
- Math proficiency
- 31% ▼ -6.00%
- Reading proficiency
- 34% ▼ -10.00%
- Median HH income
- $48,045
- Composite
- 28.08/100
- National rank
- #6834
- State rank
- #211 of 301 in IN
Livability — Medaryville
- Score
- 55/100
- State rank
- #632
- US rank
- #23559
Category grades
Schools grade is shown separately in the Schools card above.
Census & demographics
- Population (ZIP)
- 2,175
Population outlook (Pulaski County) Hauer SSP2
- Today (2025)
- 11,942 people
- By 2030
- 11,394 · -4.6%
- By 2040
- 10,274 · -14.0%
- By 2050
- 9,209 · -22.9%
- By 2075
- 7,182 · -39.9%
- By 2100
- 5,365 · -55.1%
Race, ethnicity, and origin ACS 2023
- Neighborhood character
- Predominantly White (83%)
- Race & ethnicity
- White 83% Hispanic / Latino 12% Two or more races 4% Asian 1%
- Hispanic origin (detail)
- Mexican 5%
- Common ancestry
- Iranian 2% Romanian 2% Portuguese 1%
- Foreign-born
- 8% · Canada, China
- Languages at home
- 88% English-only · Spanish 10% Tagalog/Filipino 1%
Political lean MEDSL · Pulaski
- 2024 margin
- Solid R (+53.7) · D 22.2% · R 75.9% · Other 1.9%
- 2008→2024 swing
- -38.2pp toward R · 2008: -15.5pp · 2024: -53.7pp
- All cycles
- 2024: R+53.7 2020: R+47.9 2016: R+46.5 2012: R+27.2 2008: R+15.5
Not yet ingested
- Civics
- —
Market trends
- HPI YoY
- ▲ 5.99%
- Current HPI
- 224.9978
- Rent YoY
- —
- Metro
- —
- State GDP YoY
- ▲ 2.90%
- F500 in state
- 18
Industry mix (Fortune 500 HQ in IN)
| Industry | F500 HQs | Revenue |
|---|---|---|
| Industrial Machinery | 2 | $37B |
|
||
| Healthcare | 1 | $177B |
|
||
| Pharmaceuticals | 1 | $45B |
|
||
| Metals / Steel | 1 | $18B |
|
||
| Agriculture | 1 | $17B |
|
||
| Packaging | 1 | $12B |
|
||
Price history
-6.8% since first listed8 events — show timeline
- 2026-05-18 Pending — NIRA MLS as Distributed by MLS Grid
- 2026-05-06 Listed $205,000 NIRA MLS as Distributed by MLS Grid
- 2026-04-01 Listing Removed — NIRA MLS as Distributed by MLS Grid
- 2025-09-22 Relisted — NIRA MLS as Distributed by MLS Grid
- 2025-08-14 Listing Removed — NIRA MLS as Distributed by MLS Grid
- 2024-12-25 Price Changed $210,000 NIRA MLS as Distributed by MLS Grid
- 2024-10-25 Price Changed $215,000 NIRA MLS as Distributed by MLS Grid
- 2024-09-17 Listed $220,000 NIRA MLS as Distributed by MLS Grid
Property tax history
+10.0%/yrLatest (2024): $399 · +22.1% YoY. Source: county tax records.
Cash-flow waterfall
monthlySold comps — $/sqft
last 12 mo · ≤1 miLoading sold comps…