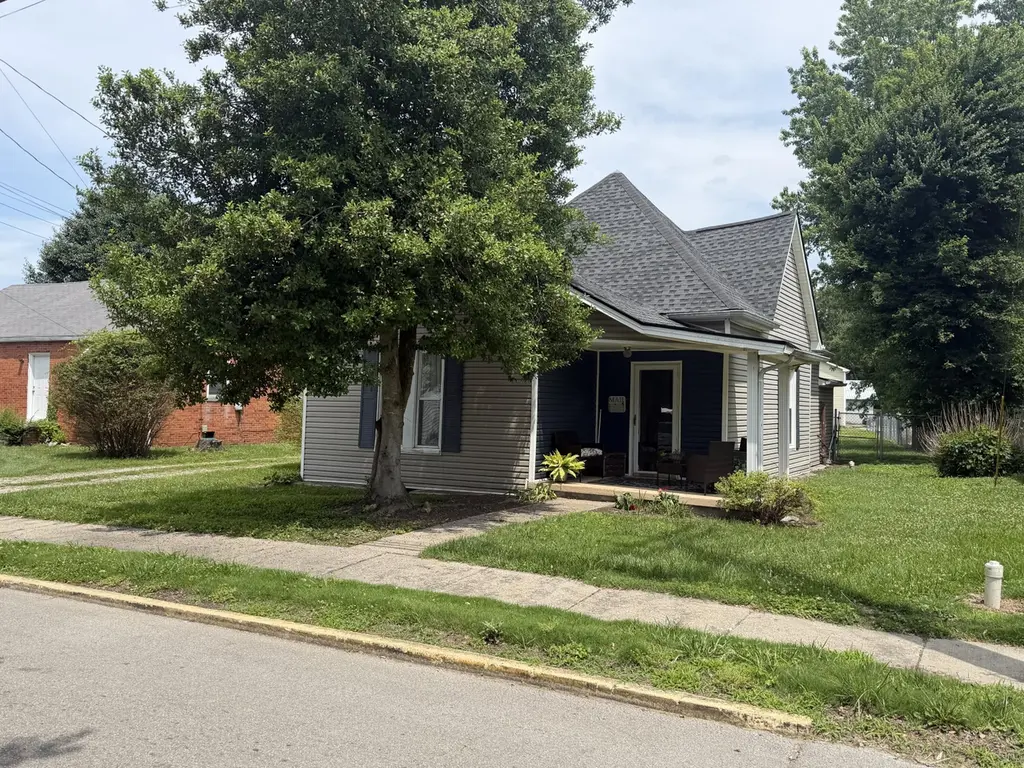
704 Barbourville St · Corbin, KY
Flood risk 8/10 · Major
- FEMA flood zone
- X (unshaded)
- Chance of flooding over 30 yrs
- 0.99%
- Est. flood insurance / yr
- $507 – $1,088
Fire risk 3/10 · Minor
- Est. fire insurance / yr
- $839 – $1,559
Heat risk 4/10 · Minor
- Hot days now (above 100°F)
- 7 days/yr
- Hot days in 30 yrs
- 20 days/yr
Wind risk 2/10 · Minimal
- Chance of severe wind over 30 yrs
- 4.0%
Air-quality risk 2/10 · Minimal
- Unhealthy air days now
- 0 days/yr
- Unhealthy air days in 30 yrs
- 1 days/yr
Risk factors via First Street. Map © Google.
Why this score? — see what drove the B- grade
The composite is a weighted blend of 9 inputs, each scored 0–100. Each bar is that input's sub-score; the figure is the points it added to the 100-point composite (weight × sub-score).
- Cash flow +21.5/30.0
- ARV discount +15.0/15.0
- DSCR +6.9/10.0
- Appreciation +5.9/10.0
- 1% rule +5.7/10.0
- Schools +3.8/10.0
- Livability +3.5/5.0
- Rent growth +2.5/5.0
- Condition / age +2.5/5.0
$129,000
🖨 Deal sheet 📄 Offer letter ✓ Due diligence
Listing remarks
Welcome home to this charming 3-bedroom, 1.5-bath residence nestled in one of Corbin's most desirable neighborhoods. Offering the character and craftsmanship that is hard to find in today's homes, this property combines timeless appeal with everyday convenience. The kitchen comes fully equipped with appliances, and the washer and dryer will remain with the home, making your move even easier. Outside, you'll find a spacious fenced backyard perfect for children, pets, entertaining, or simply relaxing. A nice storage building provides additional space for tools, equipment, or hobbies. Location is everything, and this home delivers! Situated just a block from Rotary Park and only minutes from t
Key facts
- Storage building
- Close to dining
- Fenced backyard
Tags
Property features AI
Finance
- Other:
- Financial info:
- HOA & community:
Exterior
- Parking:
- Security:
- Utilities: Public water; Public sewer; Electricity connected
- Home design: House; One and one-half stories
- Construction: Block foundation; Dimensional-style shingle roof
- Exterior features: Vinyl siding
Interior
- Kitchen: Refrigerator; Range
- Bedrooms: 2 total rooms (includes bedrooms and living areas)
- Flooring: Carpet; Hardwood; Laminate; Vinyl
- Bathrooms: 1 full bathroom; 1 half bathroom
- Heating & cooling: Forced air heating; Central air conditioning; Electric cooling
- Interior features: Refrigerator; Range; Main-level laundry; Crawl space basement; No fireplace
- Laundry & utility: Laundry on the main level
Neighborhood map
What this means for you Summary
Snapshot
- This is a 3-bed/1.0-bath single-family listed at $129k.
Deal economics
- At list price, monthly cash flow is $128 ($2k/yr) — positive.
- The deal already cash-flows at list — no discount required.
- Meets the 1% rule at list price ($1k rent vs $129k).
- Recommended offer: $127k (1.5% below list) — sets the bar for market timing.
- Cap rate 8.1% vs local median 3.3% in Corbin — top-decile yield for the area; either an underpriced asset or a hidden risk that comps aren't pricing in. Stress-test before assuming the spread holds.
Location & tenants
- Location reads 69/100 on livability (#179 in KY) — a middle-class / working-renter tenant base. Strengths: cost of living A+, housing A+, crime A-; Watch: amenities F, commute F, employment F.
- Corbin Independent (town): math 42% / reading 50% proficiency, ranked #20 of 165 in KY (top 12%) — families likely to look elsewhere, expect single-tenant / working-renter base with shorter leases.
- Zoned schools: Corbin Primary (math 42% / reading 32%, grade F, #255 of 676 statewide, top 42%, 769 students, 60% FRL); Corbin Middle School (math 46% / reading 56%, grade C, #20 of 217 statewide, top 10%, 646 students, 58% FRL); Corbin High School (math 22% / reading 42%, grade F, #97 of 254 statewide, top 46%, 829 students, 53% FRL).
- Market conditions: 332 active listings in the ZIP; 1 comparable units currently listed for rent nearby.
Forward outlook
- In year one you build about $3k of equity ($892 loan paydown + $2k appreciation (1.8% local appreciation)).
- Knox County population projected at -16% by 2050 — secular population decline; favor cash flow + early exit over multi-decade hold.
- At projected returns (1.8% appreciation + 3.0% rent growth), your $36k cash investment doubles in ~7 years — after that, you're playing with house money.
- By year 10, paydown + projected appreciation supports a ~$32k cash-out refi (75% LTV) — recoverable capital for the next deal without selling this one.
Negotiation context
- It's been on market 16 days — a 2% lower offer ($127k) is reasonable based on typical stale-listing flexibility.
- 4 sale attempts since 7y ago with the ask held roughly flat each time — persistent listings suggest the price (not the market) is what's stuck; bring a comps-based counter.
Risks & watch-outs
- Watch-outs: flood insurance adds $66/mo; built in 1926 — expect roof / HVAC / electrical / plumbing capex.
- Climate carrying-cost: severe flood risk — expect insurance premiums to compound above CPI over the hold.
Questions for the listing agent
- Built in 1926 — when were the roof, HVAC, electrical panel, plumbing, and water heater last replaced?
- What's the actual annual flood-insurance premium (NFIP or private), and is the property in a SFHA with mandatory coverage?
- Is there a deadline driving the sale (1031 exchange, divorce, estate, relocation)? That informs how much negotiation room exists.
- Schools are B-rated — typically a magnet for longer-tenancy family renters. What's the average tenant stay here, and is there a school-zone premium baked into asking?
- What's the average days-on-market for RENTAL listings here right now (not sales)? A rising rental-DOM trend means longer vacancies and softer asking-rent achievability than the comps imply.
- What's the recent tenant-quality profile in this submarket — average credit score on applications, eviction rate, late-payment / NSF rate, and stable-employment percentage? A property-management company in the area should have these aggregated.
- How much new for-sale + rental construction is in the pipeline within 1–3 miles? Heavy new supply typically softens prices + rents 12–24 months out; constrained supply supports both.
Investment metrics
- 1% rule
- 1.07% ✓
- Cap rate
- 8.10%
- Cash-on-cash
- 6.47%
- DSCR
- 1.29
- GRM
- 7.8
CMA / ARV
- ARV (on-the-fly)
- $177,372
- Comps found
- 12
Show comp detail 12 sales within ~0.75 mi
| Address | Dist | Beds/Ba | Sqft | Sold | Price | $/sf | Match |
|---|---|---|---|---|---|---|---|
| 307 Ford St | 0.10mi | 3/1.5 | 1,375 (-9%) | 11mo | $150,000 | $109 | 68 |
| 611 Caldwell St | 0.33mi | 3/1.0 | 1,579 (+4%) | 12mo | $41,290 | $26 | 68 |
| 222 Hawe St | 0.52mi | 3/2.0 | 1,496 (-1%) | 4mo | $210,000 | $140 | 66 |
| 205 Nelson St | 0.52mi | 3/2.0 | 1,568 (+3%) | 6mo | $25,000 | $16 | 61 |
| 409 Florence Ave | 0.37mi | 3/2.0 | 1,584 (+4%) | 14mo | $126,000 | $80 | 59 |
| 304 South Poplar Ave | 0.57mi | 2/1.0 (-1) | 1,472 (-3%) | 12mo | $143,000 | $97 | 53 |
| 201 Padgett St St | 0.61mi | 3/1.0 | 1,333 (-12%) | 1mo | $145,000 | $109 | 51 |
| 214 W Center St | 0.59mi | 4/2.0 (+1) | 1,410 (-7%) | 3mo | $179,900 | $128 | 49 |
| 501 Walnut Ave | 0.65mi | 3/1.0 | 1,320 (-13%) | 0mo | $155,000 | $117 | 48 |
| 149 Hawe St | 0.56mi | 4/2.0 (+1) | 1,400 (-8%) | 7mo | $204,000 | $146 | 46 |
| 1082 N Beatty Ave | 0.66mi | 3/2.0 | 1,680 (+11%) | 8mo | $207,500 | $124 | 40 |
| 106 W Greendale St | 0.74mi | 3/2.0 | 1,304 (-14%) | 8mo | $240,000 | $184 | 31 |
Match score weights: distance 35% · size 25% · config 20% · recency 20%. Top-matched comps best support the ARV.
Projected returns pro-forma
1.82% appreciation · 3.0% rent growth · sell at horizon
- IRR
- 8.3%
- Equity multiple
- 1.44×
- Total profit
- $15,930
- Equity at exit
- $49,660
- IRR
- 11.6%
- Equity multiple
- 2.54×
- Total profit
- $55,605
- Equity at exit
- $70,585
Cash invested: $36,120 (down + closing). Projections, not guarantees.
Landlord ↔ Tenant lean methodology
- Overall (STATE)
- 83 Strongly Landlord-Friendly
- State Kentucky
- 83 Strongly Landlord-Friendly · R+16
- County
- — inherits STATE
- City
- — inherits STATE
ZIP-level market 40701
- Home prices YoY
- 0.6%
- Active inventory
- 332
- Price-to-rent
- 7.8×
Monthly cashflow live
- Estimated rent
- $1,375 medium interval (Pro) →
- Mortgage (P&I)
- −$676
- Tax est. 1.5%
- −$161 /mo · $1,935/yr
- Insurance
- −$54
- Flood insurance flood zone
- −$66 /mo · $798/yr
- HOA
- −$0
- Vacancy / Maint / Mgmt
- −$289
- Net cashflow
- $128
Break-even live
UW: 25.0% down · 7.5% · 30yr · 1.5% tax · 5.0% vac · 8.0% maint · 8.0% mgmt
Financing live
Cash to close
- Down payment
- $32,250
- Closing costs
- $3,870
- Reserves months
- —
- Total cash needed
- —
Loan-product check · same deal, 3 products live
Conventional
25% down · 7.5% · 30yr
- Down + closing
- —
- Monthly P&I
- —
- Monthly cashflow
- —
- DSCR
- —
- Eligible?
- —
Personal DTI + credit; lowest rate.
DSCR
20% down · 8.5% · 30yr
- Down + closing
- —
- Monthly P&I
- —
- Monthly cashflow
- —
- DSCR
- —
- Eligible?
- —
No personal income docs; deal must DSCR.
Hard money
10% down · 12.0% · 12mo
- Down + closing
- —
- Monthly P&I
- —
- Monthly cashflow
- —
- DSCR
- —
- Eligible?
- —
Short-term bridge; refi at stabilization.
Rent comps 1 comps
| Address | Beds | Baths | Sqft | Rent | $/sqft | DOM | Units | Dist |
|---|---|---|---|---|---|---|---|---|
| 1003 W 5th St Corbin, KY | 3.0 | 1.0 | 1186 | $1,375 | $1.16 | 43d | 1 | 1.10mi |
Listing history 12 events
-
2026-06-18status $129,000 Active 16 DOM
-
2026-06-18days on market $129,000 Contingent 16 DOM
-
2026-06-17days on market $129,000 Contingent 15 DOM
-
2026-06-16days on market $129,000 Contingent 14 DOM
-
2026-06-15days on market $129,000 Contingent 13 DOM
-
2026-06-13days on market $129,000 Contingent 11 DOM
-
2026-06-12days on market $129,000 Contingent 10 DOM
-
2026-06-09days on market $129,000 Contingent 7 DOM
-
2026-06-08days on market $129,000 Contingent 6 DOM
-
2026-06-07statusdays on market $129,000 Contingent 5 DOM
-
2026-06-03remarks 699-char remark
-
2026-06-03$129,000 Active 1 DOM
ⓘ Source: listings_history table (triggers on properties + properties_extension) + one-shot
backfill from property_details.listing_events for pre-trigger history.
Climate risk First Street
- Flood 8/10 Severe FEMA zone X (unshaded) · 99% chance over 30 yrs
- Wildfire 3/10 Moderate
- Heat 4/10 Moderate 7 d/yr ≥100°F today · 20 d/yr by 30 yrs out
- Wind 2/10 Low 4% chance of damaging wind over 30 yrs
- Air quality 2/10 Low 0 unhealthy d/yr today · 1 by 30 yrs out
Nearby sold comps map
Loading sold comps map…
Walkable amenities ~0.75 mi
Loading nearby amenities…
Taxation est. · year 1
- Rental income
- $16,500
- − Mortgage interest
- −$7,226
- − Property taxes
- −$1,935
- − Insurance
- −$1,442
- − Repairs & maintenance
- −$1,320
- − Management
- −$1,320
- − Depreciation
- −$3,753
- Taxable loss
- −$496
- Est. tax savings @ 24.0%
- +$119
- After-tax cash flow
- $1,659/yr
For passive investors: Depreciation is non-cash, so a rental often shows a tax loss while cash-flowing — sheltering income. Rental losses are passive: they offset passive income freely, and up to $25,000/yr can offset ordinary (W-2) income if you actively participate and your MAGI is under $100k (phasing out to $0 by $150k); unused losses carry forward. On sale, claimed depreciation is recaptured at up to 25%, and gains may owe capital-gains tax (a 1031 exchange can defer both). Figures are a year-1 estimate at your 24.0% rate — not tax advice; consult a CPA.
Schools (NCES district)
- District
- Corbin Independent
- NCES district ID
- 2101320
- Math proficiency
- 42% ▼ -19.00%
- Reading proficiency
- 50% ▼ -13.00%
- Median HH income
- $36,928
- Composite
- 38.19/100
- National rank
- #4259
- State rank
- #20 of 165 in KY
Livability — Corbin
- Score
- 69/100
- State rank
- #179
- US rank
- #8891
Category grades
Schools grade is shown separately in the Schools card above.
Census & demographics
- Census place
- Corbin, KY
- Population (ZIP)
- 29,767
Population outlook (Knox County) Hauer SSP2
- Today (2025)
- 30,741 people
- By 2030
- 29,887 · -2.8%
- By 2040
- 27,940 · -9.1%
- By 2050
- 25,826 · -16.0%
- By 2075
- 20,895 · -32.0%
- By 2100
- 16,238 · -47.2%
Race, ethnicity, and origin ACS 2023
- Neighborhood character
- Predominantly White (95%)
- Race & ethnicity
- White 95% Two or more races 3% Hispanic / Latino 1%
- Common ancestry
- Serbian 2% Slovak 2% Italian 1%
- Foreign-born
- 1% · Canada
- Languages at home
- 99% English-only · Spanish 1%
Political lean MEDSL · Knox
- 2024 margin
- Solid R (+71.1) · D 13.8% · R 85.0% · Other 1.2%
- 2008→2024 swing
- -26.6pp toward R · 2008: -44.6pp · 2024: -71.1pp
- All cycles
- 2024: R+71.1 2020: R+67.0 2016: R+67.7 2012: R+53.9 2008: R+44.6
Not yet ingested
- Civics
- —
Market trends
- HPI YoY
- ▲ 1.82%
- Current HPI
- 294.7961
- Rent YoY
- —
- Metro
- —
- State GDP YoY
- ▲ 1.81%
- F500 in state
- 4
Industry mix (Fortune 500 HQ in KY)
| Industry | F500 HQs | Revenue |
|---|---|---|
| Healthcare | 1 | $118B |
|
||
| Food / Beverage | 1 | $7B |
|
||
Price history
+50.2% since first listed8 events — show timeline
- 2026-06-02 Listed $129,000 ImagineMLS
- 2020-09-10 Pending — ImagineMLS
- 2020-09-10 Listing Removed — ImagineMLS
- 2020-09-08 Relisted — ImagineMLS
- 2020-08-14 Pending — ImagineMLS
- 2020-03-23 Relisted — ImagineMLS
- 2020-03-07 Pending — ImagineMLS
- 2019-09-26 Listed $85,900 ImagineMLS
Property tax history
-3.9%/yrLatest (2025): $75 · -15.4% YoY. Source: county tax records.
Cash-flow waterfall
monthlySold comps — $/sqft
last 12 mo · ≤1 miLoading sold comps…