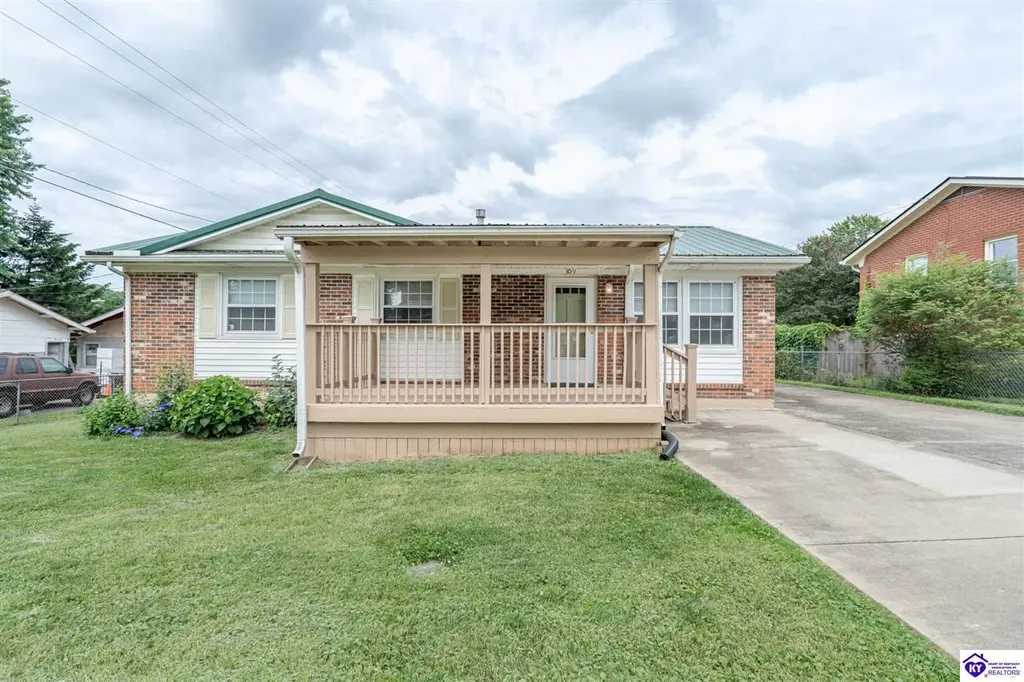
309 Elmhurst Ave · Vine Grove, KY
Flood risk 1/10 · Minimal
- FEMA flood zone
- X (unshaded)
- Chance of flooding over 30 yrs
- 0.0%
- Est. flood insurance / yr
- $507 – $1,088
Fire risk 2/10 · Minimal
- Est. fire insurance / yr
- $839 – $1,559
Heat risk 5/10 · Moderate
- Hot days now (above 105°F)
- 7 days/yr
- Hot days in 30 yrs
- 20 days/yr
Wind risk 2/10 · Minimal
- Chance of severe wind over 30 yrs
- 3.0%
Air-quality risk 2/10 · Minimal
- Unhealthy air days now
- 0 days/yr
- Unhealthy air days in 30 yrs
- 1 days/yr
Risk factors via First Street. Map © Google.
Why this score? — see what drove the D+ grade
The composite is a weighted blend of 9 inputs, each scored 0–100. Each bar is that input's sub-score; the figure is the points it added to the 100-point composite (weight × sub-score).
- Cash flow +20.3/30.0
- DSCR +6.4/10.0
- ARV discount +5.0/15.0
- 1% rule +4.0/10.0
- Livability +3.6/5.0
- Schools +3.2/10.0
- Rent growth +2.5/5.0
- Condition / age +2.5/5.0
- Appreciation +0.0/10.0
$196,500
🖨 Deal sheet 📄 Offer letter ✓ Due diligence
Listing remarks MLS
Well maintained 3 bedroom 1.5 bathroom.
Key facts
- Covered front porch
- Tiled walk-in shower
- Eat-in kitchen
Tags
Property features AI
Finance
- Other: Located in Meadowbrook subdivision; Lot size approximately 0.22 acre; Directions: From Knox Ave turn right onto Edgebrook Dr. Drive 0.2 miles, turn right onto Elmhurst Ave - house on the left.
- HOA & community: No association amenities
Exterior
- Parking: Concrete driveway; No garage
- Security: Smoke detector(s)
- Utilities: Natural gas available; Cable available; Public sewer
- Home design: Single-family residence; Residential property
- Construction: Brick and vinyl siding exterior; Metal roof; Block foundation; Built on crawl space
- Exterior features: Deck; Storm door(s); Chain link fence; Shed(s)
Interior
- Kitchen: Dishwasher; Electric range; Refrigerator; Electric water heater
- Flooring: Hardwood; Laminate; Tile
- Bathrooms: 1 full bathroom; 1 half bathroom; One main-level bathroom
- Heating & cooling: Natural gas heating; Central air conditioning; Ceiling fans
- Interior features: Eat-in kitchen; Ceiling fans
- Laundry & utility: Dedicated laundry room
Neighborhood map
What this means for you Summary
Snapshot
- This is a 3-bed/1.5-bath single-family listed at $196k.
Deal economics
- At list price, monthly cash flow is $250 ($3k/yr) — positive.
- The deal already cash-flows at list — no discount required.
- To meet the 1% rule (rent ≥ 1% of price), the offer needs to be $177k (10.1% below list).
- Recommended offer: $177k (10.1% below list) — sets the bar for 1% rule.
- Cap rate 7.8% vs local median 4.0% in Vine Grove — top-decile yield for the area; either an underpriced asset or a hidden risk that comps aren't pricing in. Stress-test before assuming the spread holds.
Location & tenants
- Location reads 72/100 on livability (#124 in KY) — a middle-class / working-renter tenant base. Strengths: crime A+, cost of living A+, housing A+; Watch: amenities F, commute F, health & safety F.
- Hardin County (suburban): math 30% / reading 43% proficiency, ranked #47 of 165 in KY (top 28%) — families likely to look elsewhere, expect single-tenant / working-renter base with shorter leases.
- Market conditions: 155 active listings in the ZIP; 946 units permitted in Hardin County in 2024 (464 in 5+ unit buildings).
Forward outlook
- Local home prices are declining (-3.0%/yr); year-one equity from $1k of loan paydown is wiped out by about $6k of value loss. Plan a longer hold.
- Hardin County population projected at -16% by 2050 — secular population decline; favor cash flow + early exit over multi-decade hold.
Negotiation context
- Only 5 days on market — expect competitive offers; lowballing is unlikely to land.
- 3 sale attempts since 12y ago with the ask held roughly flat each time — persistent listings suggest the price (not the market) is what's stuck; bring a comps-based counter.
- Current owner paid $76k; list at $196k implies a 159% gain — meaningful room to come down on a strong offer.
Risks & watch-outs
- Climate carrying-cost: extreme-heat days projected 7→20/yr by 2055 (HVAC capex compounding) — expect insurance premiums to compound above CPI over the hold.
Questions for the listing agent
- Built in 1966 — when were the roof, HVAC, electrical panel, plumbing, and water heater last replaced?
- Is there a deadline driving the sale (1031 exchange, divorce, estate, relocation)? That informs how much negotiation room exists.
- The area grade is low — what's the realistic commute time and amenity access for the typical tenant pool here? Any planned neighborhood developments (good or bad) we should know about?
- What's the average days-on-market for RENTAL listings here right now (not sales)? A rising rental-DOM trend means longer vacancies and softer asking-rent achievability than the comps imply.
- What's the recent tenant-quality profile in this submarket — average credit score on applications, eviction rate, late-payment / NSF rate, and stable-employment percentage? A property-management company in the area should have these aggregated.
- How much new for-sale + rental construction is in the pipeline within 1–3 miles? Heavy new supply typically softens prices + rents 12–24 months out; constrained supply supports both.
Investment metrics
- 1% rule
- 0.90% ✗
- Cap rate
- 7.82%
- Cash-on-cash
- 5.46%
- DSCR
- 1.24
- GRM
- 9.3
CMA / ARV
- ARV (on-the-fly)
- $185,976
- Comps found
- 6
Show comp detail 6 sales within ~0.75 mi
| Address | Dist | Beds/Ba | Sqft | Sold | Price | $/sf | Match |
|---|---|---|---|---|---|---|---|
| 108 Cherrywood Dr | 0.19mi | 3/1.5 | 1,100 (-1%) | 18mo | $171,973 | $156 | 75 |
| 508 Edgebrook Dr | 0.17mi | 3/1.0 | 1,024 (-8%) | 5mo | $150,000 | $146 | 73 |
| 106 Debbie Dr | 0.20mi | 3/1.0 | 1,029 (-7%) | 13mo | $172,750 | $168 | 66 |
| 215 Greenhill St | 0.44mi | 3/2.0 | 1,152 (+4%) | 7mo | $190,000 | $165 | 65 |
| 810 Charlene Dr | 0.23mi | 3/1.0 | 1,000 (-10%) | 8mo | $174,000 | $174 | 64 |
| 302 Glenwood Dr | 0.17mi | 3/2.0 | 944 (-15%) | 1mo | $180,000 | $191 | 64 |
Match score weights: distance 35% · size 25% · config 20% · recency 20%. Top-matched comps best support the ARV.
Projected returns pro-forma
-3.0% appreciation · 3.0% rent growth · sell at horizon
- IRR
- -7.9%
- Equity multiple
- 0.71×
- Total profit
- $-15,995
- Equity at exit
- $29,299
- IRR
- 1.6%
- Equity multiple
- 1.11×
- Total profit
- $6,188
- Equity at exit
- $16,990
Cash invested: $55,020 (down + closing). Projections, not guarantees.
Landlord ↔ Tenant lean methodology
- Overall (STATE)
- 83 Strongly Landlord-Friendly
- State Kentucky
- 83 Strongly Landlord-Friendly · R+16
- County
- — inherits STATE
- City
- — inherits STATE
ZIP-level market 40175
- Home prices YoY
- -6.3%
- Active inventory
- 155
- Price-to-rent
- 9.3×
Monthly cashflow live
- Estimated rent
- $1,767 medium interval (Pro) →
- Mortgage (P&I)
- −$1,030
- Tax from tax record
- −$33 /mo · $399/yr
- Insurance
- −$82
- HOA
- −$0
- Vacancy / Maint / Mgmt
- −$371
- Net cashflow
- $250
Break-even live
UW: 25.0% down · 7.5% · 30yr · 1.5% tax · 5.0% vac · 8.0% maint · 8.0% mgmt
Financing live
Cash to close
- Down payment
- $49,125
- Closing costs
- $5,895
- Reserves months
- —
- Total cash needed
- —
Loan-product check · same deal, 3 products live
Conventional
25% down · 7.5% · 30yr
- Down + closing
- —
- Monthly P&I
- —
- Monthly cashflow
- —
- DSCR
- —
- Eligible?
- —
Personal DTI + credit; lowest rate.
DSCR
20% down · 8.5% · 30yr
- Down + closing
- —
- Monthly P&I
- —
- Monthly cashflow
- —
- DSCR
- —
- Eligible?
- —
No personal income docs; deal must DSCR.
Hard money
10% down · 12.0% · 12mo
- Down + closing
- —
- Monthly P&I
- —
- Monthly cashflow
- —
- DSCR
- —
- Eligible?
- —
Short-term bridge; refi at stabilization.
Listing history 5 events
-
2026-06-14statusdays on market $196,500 Pending 5 DOM
-
2026-06-13days on market $196,500 Active 4 DOM
-
2026-06-10days on market $196,500 Active 2 DOM
-
2026-06-09remarks 687-char remark
-
2026-06-09$196,500 Active 1 DOM
ⓘ Source: listings_history table (triggers on properties + properties_extension) + one-shot
backfill from property_details.listing_events for pre-trigger history.
Tax reassessment forecast KY · Resets to sale price
- Current annual tax
- $399 · $33/mo
- Projected year-2 tax
- $1,690 · $141/mo
- Expected delta
- +$1,291/yr (+$108/mo · 323.7%)
ⓘ Screening estimate from a state-policy table — verify with the county assessor before closing.
Climate risk First Street
- Flood 1/10 Low FEMA zone X (unshaded) · 0% chance over 30 yrs
- Wildfire 2/10 Low
- Heat 5/10 Major 7 d/yr ≥105°F today · 20 d/yr by 30 yrs out
- Wind 2/10 Low 3% chance of damaging wind over 30 yrs
- Air quality 2/10 Low 0 unhealthy d/yr today · 1 by 30 yrs out
Nearby sold comps map
Loading sold comps map…
Walkable amenities ~0.75 mi
Loading nearby amenities…
Taxation est. · year 1
- Rental income
- $21,205
- − Mortgage interest
- −$11,007
- − Property taxes
- −$399
- − Insurance
- −$982
- − Repairs & maintenance
- −$1,696
- − Management
- −$1,696
- − Depreciation
- −$5,716
- Taxable loss
- −$292
- Est. tax savings @ 24.0%
- +$70
- After-tax cash flow
- $3,075/yr
For passive investors: Depreciation is non-cash, so a rental often shows a tax loss while cash-flowing — sheltering income. Rental losses are passive: they offset passive income freely, and up to $25,000/yr can offset ordinary (W-2) income if you actively participate and your MAGI is under $100k (phasing out to $0 by $150k); unused losses carry forward. On sale, claimed depreciation is recaptured at up to 25%, and gains may owe capital-gains tax (a 1031 exchange can defer both). Figures are a year-1 estimate at your 24.0% rate — not tax advice; consult a CPA.
Schools (NCES district)
- District
- Hardin County
- NCES district ID
- 2102490
- Math proficiency
- 30% ▼ -13.00%
- Reading proficiency
- 43% ▼ -10.00%
- Median HH income
- $50,728
- Composite
- 31.61/100
- National rank
- #5945
- State rank
- #47 of 165 in KY
Livability — Vine Grove
- Score
- 72/100
- State rank
- #124
- US rank
- #5837
Category grades
Schools grade is shown separately in the Schools card above.
Census & demographics
- Census place
- Vine Grove, KY
- Population (ZIP)
- 16,283
Population outlook (Hardin County) Hauer SSP2
- Today (2025)
- 105,573 people
- By 2030
- 103,563 · -1.9%
- By 2040
- 97,077 · -8.0%
- By 2050
- 88,367 · -16.3%
- By 2075
- 65,405 · -38.0%
- By 2100
- 42,245 · -60.0%
Race, ethnicity, and origin ACS 2023
- Neighborhood character
- Predominantly White (81%)
- Race & ethnicity
- White 81% Black 9% Two or more races 7% Hispanic / Latino 2% Asian 2%
- Common ancestry
- Italian 2% Slovak 2% Serbian 1%
- Foreign-born
- 3% · South Korea, Canada
- Languages at home
- 95% English-only · Spanish 2% Tagalog/Filipino 1% German/W. Germanic 1%
Political lean MEDSL · Hardin
- 2024 margin
- Strong R (+29.3) · D 34.5% · R 63.8% · Other 1.7%
- 2008→2024 swing
- -8.7pp toward R · 2008: -20.6pp · 2024: -29.3pp
- All cycles
- 2024: R+29.3 2020: R+24.0 2016: R+30.2 2012: R+20.8 2008: R+20.6
Not yet ingested
- Civics
- —
Market trends
- HPI YoY
- ▼ -16.55%
- Current HPI
- 246.3715
- Rent YoY
- —
- Metro
- —
- State GDP YoY
- ▲ 1.81%
- F500 in state
- 4
Industry mix (Fortune 500 HQ in KY)
| Industry | F500 HQs | Revenue |
|---|---|---|
| Healthcare | 1 | $118B |
|
||
| Food / Beverage | 1 | $7B |
|
||
Price history
+153.5% since first listed6 events — show timeline
- 2026-06-08 Listed $196,500 HKARMLS
- 2015-05-29 Sold (Public Records) $76,000 Public Records
- 2015-05-27 Sold (MLS) $76,000 HKARMLS
- 2015-05-27 Sold (MLS) $76,000 Metro Search MLS
- 2014-12-10 Listed $77,500 Metro Search MLS
- 2014-12-08 Listed $77,500 HKARMLS
Property tax history
-2.1%/yrLatest (2025): $399 · -3.0% YoY. Source: county tax records.
Cash-flow waterfall
monthlySold comps — $/sqft
last 12 mo · ≤1 miLoading sold comps…