1600 W Gregory St · Pensacola, FL
Flood risk 1/10 · Minimal
- FEMA flood zone
- X (unshaded)
- Chance of flooding over 30 yrs
- 0.0%
- Est. flood insurance / yr
- $507 – $1,088
Fire risk 1/10 · Minimal
- Est. fire insurance / yr
- $947 – $1,759
Heat risk 10/10 · Severe
- Hot days now (above 105°F)
- 7 days/yr
- Hot days in 30 yrs
- 23 days/yr
Wind risk 9/10 · Severe
- Chance of severe wind over 30 yrs
- 99.0%
Air-quality risk 2/10 · Minimal
- Unhealthy air days now
- 0 days/yr
- Unhealthy air days in 30 yrs
- 1 days/yr
Risk factors via First Street. Map © Google.
Why this score? — see what drove the C- grade
The composite is a weighted blend of 9 inputs, each scored 0–100. Each bar is that input's sub-score; the figure is the points it added to the 100-point composite (weight × sub-score).
- ARV discount +15.0/15.0
- Cash flow +14.2/30.0
- DSCR +4.3/10.0
- Livability +4.2/5.0
- 1% rule +4.0/10.0
- Schools +3.6/10.0
- Condition / age +2.5/5.0
- Rent growth +2.4/5.0
- Appreciation +0.0/10.0
$225,000
🖨 Deal sheet 📄 Offer letter ✓ Due diligence
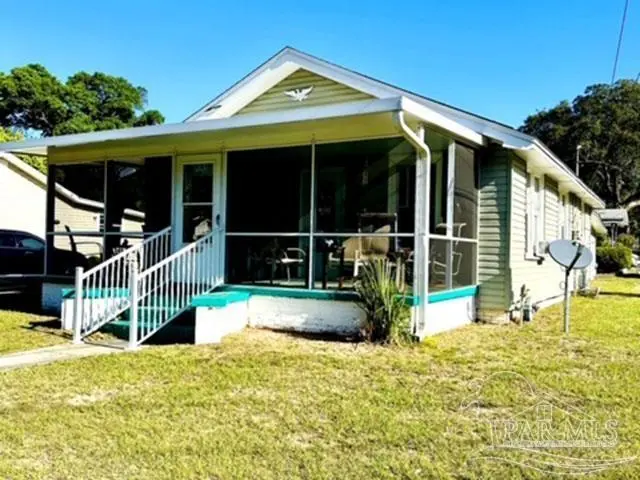
Listing remarks
Welcome to this three bedroom/one bath cottage style home located on a corner lot. The home offers the option for a dining/ living area and a separate great room area. The large screened front porch creates a great place to enjoy the outdoors. There are 2 detached buildings on the property. One serves as a workshop/laundry area. The property also features a 515 sq. ft. guest house/office area/rental. Location is key, within a mile of downtown & close to NAS. Legion Field is a few blocks away, offering fields and courts, a walking trail, a playground/splash pad and a library. Use your creativity to create your own space or create an investment property. Call today to schedule an appoi
Key facts
- Screened front porch
- Detached buildings
- Corner lot
Tags
Property features AI
Finance
- Other: Lot dimensions approx. 60 x 125 (0.17 acres)
- HOA & community: No homeowners association
Exterior
- Parking: Open parking; Driveway
- Utilities: Public water; Public sewer; Electric service with circuit breakers
- Home design: Single-story home; Not attached to another property; Resale property; Paved public road access
- Construction: Frame construction; Composition and gable roof; Off-grade foundation; Built on one level
- Exterior features: Covered patio/porch; Corner lot; Solar energy generation; Guest house
Interior
- Kitchen: Dishwasher; Refrigerator; Gas water heater
- Bedrooms: Primary bedroom on the first floor (approx. 13 x 10); Second bedroom on the first floor (approx. 12 x 12); Third bedroom on the first floor (approx. 13 x 9)
- Flooring: Carpet
- Bathrooms: One full bathroom on the first floor (approx. 8 x 5)
- Heating & cooling: Central heating; Central air; Ceiling fan(s)
- Interior features: Ceiling fan(s); Some blinds; Some drapes
- Laundry & utility: Indoor laundry
Neighborhood map
What this means for you Summary
Snapshot
- This is a 3-bed/1.0-bath other listed at $225k.
Deal economics
- At list price, monthly cash flow is $39 ($469/yr) — positive.
- The deal already cash-flows at list — no discount required.
- To meet the 1% rule (rent ≥ 1% of price), the offer needs to be $203k (9.8% below list).
- Recommended offer: $203k (9.8% below list) — sets the bar for 1% rule.
- Cap rate 6.5% vs local median 3.6% in Pensacola — top-decile yield for the area; either an underpriced asset or a hidden risk that comps aren't pricing in. Stress-test before assuming the spread holds.
Location & tenants
- Location reads 83/100 on livability (#53 in FL, #924 nationally) — a professional / high-income tenant draw. Strengths: commute A+, cost of living A+, housing A+.
- Escambia (suburban): math 40% / reading 45% proficiency, ranked #56 of 73 in FL (top 77%) — families likely to look elsewhere, expect single-tenant / working-renter base with shorter leases.
- Market conditions: Rents soft (-0.4%/yr); 96 active listings in the ZIP; 29 comparable units currently listed for rent nearby; rentals at typical pace (median 23d on market — plan ~3-4 weeks tenant-placement turnaround); 1,479 units permitted in Escambia County in 2024 (0 in 5+ unit buildings).
- This rent runs 36% of the median local income ($67k/yr) — at the standard rent-burdened threshold; future hikes will face affordability resistance.
Forward outlook
- Local home prices are declining (-3.0%/yr); year-one equity from $2k of loan paydown is wiped out by about $7k of value loss. Plan a longer hold.
- Escambia County population projected at +13% by 2050 — modest demand growth; plan on rents tracking national, not racing it.
Negotiation context
- It's been on market 35 days — a 3% lower offer ($218k) is reasonable based on typical stale-listing flexibility.
- Current owner paid $59k; list at $225k implies a 282% gain — meaningful room to come down on a strong offer.
Risks & watch-outs
- Watch-outs: built in 1939 — expect roof / HVAC / electrical / plumbing capex.
- Climate carrying-cost: severe wind risk, 99% chance of damaging wind over 30y; extreme-heat days projected 7→23/yr by 2055 (HVAC capex compounding) — expect insurance premiums to compound above CPI over the hold.
Questions for the listing agent
- It's been on market 35 days. Have you received any prior offers? Is the seller open to a 10% concession, seller financing, or rate buy-down credit?
- Built in 1939 — when were the roof, HVAC, electrical panel, plumbing, and water heater last replaced?
- Is there a deadline driving the sale (1031 exchange, divorce, estate, relocation)? That informs how much negotiation room exists.
- What's the average days-on-market for RENTAL listings here right now (not sales)? A rising rental-DOM trend means longer vacancies and softer asking-rent achievability than the comps imply.
- What's the recent tenant-quality profile in this submarket — average credit score on applications, eviction rate, late-payment / NSF rate, and stable-employment percentage? A property-management company in the area should have these aggregated.
- How much new for-sale + rental construction is in the pipeline within 1–3 miles? Heavy new supply typically softens prices + rents 12–24 months out; constrained supply supports both.
Investment metrics
- 1% rule
- 0.90% ✗
- Cap rate
- 6.50%
- Cash-on-cash
- 0.74%
- DSCR
- 1.03
- GRM
- 9.2
CMA / ARV
- ARV (median comp)
- $361,206
- List price
- $225,000
- Delta
- -37.71%
- Verdict
- UNDERPRICED
- Comps
- 20 within 1.0 mi
Projected returns pro-forma
-3.0% appreciation · 0.0% rent growth · sell at horizon
- IRR
- -18.5%
- Equity multiple
- 0.37×
- Total profit
- $-39,882
- Equity at exit
- $33,548
- IRR
- -18.5%
- Equity multiple
- 0.14×
- Total profit
- $-54,360
- Equity at exit
- $19,454
Cash invested: $63,000 (down + closing). Projections, not guarantees.
Landlord ↔ Tenant lean methodology
- Overall (STATE)
- 87 Strongly Landlord-Friendly
- State Florida
- 87 Strongly Landlord-Friendly · R+3
- County
- — inherits STATE
- City
- — inherits STATE
ZIP-level market 32502
- Home prices YoY
- -20.5%
- Rents YoY
- -0.4%
- Active inventory
- 96
- Price-to-rent
- 9.2×
Monthly cashflow live
- Estimated rent
- $2,029 high interval (Pro) →
- Mortgage (P&I)
- −$1,180
- Tax from tax record
- −$290 /mo · $3,484/yr
- Insurance
- −$94
- HOA
- −$0
- Vacancy / Maint / Mgmt
- −$426
- Net cashflow
- $39
Break-even live
UW: 25.0% down · 7.5% · 30yr · 1.5% tax · 5.0% vac · 8.0% maint · 8.0% mgmt
Financing live
Cash to close
- Down payment
- $56,250
- Closing costs
- $6,750
- Reserves months
- —
- Total cash needed
- —
Loan-product check · same deal, 3 products live
Conventional
25% down · 7.5% · 30yr
- Down + closing
- —
- Monthly P&I
- —
- Monthly cashflow
- —
- DSCR
- —
- Eligible?
- —
Personal DTI + credit; lowest rate.
DSCR
20% down · 8.5% · 30yr
- Down + closing
- —
- Monthly P&I
- —
- Monthly cashflow
- —
- DSCR
- —
- Eligible?
- —
No personal income docs; deal must DSCR.
Hard money
10% down · 12.0% · 12mo
- Down + closing
- —
- Monthly P&I
- —
- Monthly cashflow
- —
- DSCR
- —
- Eligible?
- —
Short-term bridge; refi at stabilization.
Rent comps 29 comps
| Address | Beds | Baths | Sqft | Rent | $/sqft | DOM | Units | Dist |
|---|---|---|---|---|---|---|---|---|
| 239 N K St Pensacola, FL | 3.0 | 2.0 | 1392 | $1,950 | $1.40 | 23d | 1 | 0.11mi |
| 1804 W Belmont St Unit A Pensacola, FL | 3.0 | 1.0 | 925 | $995 | $1.08 | 21d | 1 | 0.24mi |
| 106 S G St Pensacola, FL | 3.0 | 2.0 | 1300 | $2,200 | $1.69 | 23d | 1 | 0.31mi |
| 309 N Pace Blvd Unit B Pensacola, FL | 3.0 | 2.0 | 1342 | $1,650 | $1.23 | 23d | 1 | 0.36mi |
| 315 N Pace Blvd Unit A Pensacola, FL | 3.0 | 2.0 | 1342 | $1,850 | $1.38 | 23d | 1 | 0.38mi |
| 315 N Pace Blvd Unit b Pensacola, FL | 3.0 | 2.0 | 1342 | $1,650 | $1.23 | 23d | 1 | 0.38mi |
| 1717 W Cervantes St Pensacola, FL | 2.0 | 2.0 | 974 | $1,169 | $1.20 | 13d | 3 | 0.42mi |
| 411 N D St Pensacola, FL | 4.0 | 2.0 | 1511 | $2,175 | $1.44 | 23d | 1 | 0.44mi |
| 410 N C St Unit 1367374P Pensacola, FL | 3.0 | 2.0 | 1291 | $3,313 | $2.57 | 13d | 1 | 0.52mi |
| 418 N C St Pensacola, FL | 3.0 | 2.0 | 1017 | $2,775 | $2.73 | 13d | 1 | 0.52mi |
| 814 N E St Pensacola, FL | 3.0 | 2.0 | 1440 | $1,695 | $1.18 | 23d | 1 | 0.60mi |
| 811 N D St Pensacola, FL | 2.0 | 2.0 | 1035 | $1,395 | $1.35 | 23d | 1 | 0.62mi |
| 615 N A St Pensacola, FL | 3.0 | 2.0 | 1122 | $1,900 | $1.69 | 13d | 1 | 0.68mi |
| 1010 N D St Pensacola, FL | 2.0 | 2.0 | 1196 | $1,850 | $1.55 | 23d | 1 | 0.74mi |
| 379 S Clubbs St Unit A Pensacola, FL | 2.0 | 2.0 | 1190 | $2,400 | $2.02 | 23d | 1 | 0.83mi |
| 218 Junction Ave Pensacola, FL | 2.0 | 2.5 | 1295 | $2,400 | $1.85 | 23d | 1 | 0.84mi |
| 2303 W Brainerd St Pensacola, FL | 2.0 | 1.0 | 955 | $1,100 | $1.15 | 23d | 1 | 0.86mi |
| 1215 N C St Pensacola, FL | 3.0 | 1.0 | 1203 | $1,775 | $1.48 | 13d | 1 | 0.88mi |
| 220 W Chase St Pensacola, FL | 2.0 | 1.0 | 648 | $1,241 | $1.92 | 23d | 1 | 0.99mi |
| 214 W La Rua St Pensacola, FL | 2.0 | 2.5 | 1600 | $2,800 | $1.75 | 13d | 1 | 0.99mi |
| 504 N Spring St Unit B Pensacola, FL | 3.0 | 1.5 | 1485 | $1,995 | $1.34 | 23d | 1 | 1.04mi |
| 2802 W Gonzalez St Pensacola, FL | 3.0 | 2.0 | 1824 | $1,600 | $0.88 | 23d | 1 | 1.06mi |
| 419 N Wentworth St Pensacola, FL | 2.0 | 1.0 | 1100 | $1,195 | $1.09 | 23d | 1 | 1.22mi |
| 3141 Barrancas Ave Pensacola, FL | 2.0 | 1.5 | 1200 | $2,150 | $1.79 | 13d | 1 | 1.29mi |
| 101 E Romana St Pensacola, FL | 3.0 | 1.0–2.0 | 987 | $2,588 | $2.62 | 13d | 20 | 1.38mi |
| 13 Elegans Ave Pensacola, FL | 3.0 | 2.0 | 1835 | $1,895 | $1.03 | 23d | 1 | 1.38mi |
| 721 W Jordan St Pensacola, FL | 3.0 | 2.0 | 1030 | $1,895 | $1.84 | 23d | 1 | 1.42mi |
| 407 W Jordan St Unit NA Pensacola, FL | 3.0 | 2.0 | 1300 | $2,200 | $1.69 | 23d | 1 | 1.46mi |
| 3740 Frontera Cir Pensacola, FL | 3.0 | 1.0 | 1024 | $1,295 | $1.26 | 23d | 1 | 1.49mi |
Listing history 17 events
-
2026-06-19status $225,000 Active 35 DOM
-
2026-06-18days on market $225,000 Contingent 35 DOM
-
2026-06-17days on market $225,000 Contingent 34 DOM
-
2026-06-16days on market $225,000 Contingent 33 DOM
-
2026-06-15days on market $225,000 Contingent 32 DOM
-
2026-06-14statusdays on market $225,000 Contingent 30 DOM
-
2026-06-10days on market $225,000 Active 27 DOM
-
2026-06-09days on market $225,000 Active 26 DOM
-
2026-06-08days on market $225,000 Active 25 DOM
-
2026-06-07pricedays on market $225,000 Active 24 DOM
-
2026-06-03days on market $249,000 Active 20 DOM
-
2026-06-02days on market $249,000 Active 19 DOM
-
2026-06-01days on market $249,000 Active 18 DOM
-
2026-05-31days on market $249,000 Active 17 DOM
-
2026-05-31days on market $249,000 Active 16 DOM
-
2026-05-14$249,000 Active 719-char remark
-
2020-09-08soldstatus $58,900
ⓘ Source: listings_history table (triggers on properties + properties_extension) + one-shot
backfill from property_details.listing_events for pre-trigger history.
Tax reassessment forecast FL · Resets to sale price
- Current annual tax
- $3,484 · $290/mo
- Projected year-2 tax
- $3,484 · $290/mo
- Expected delta
- $0/yr ($0/mo · 0.0%)
ⓘ Screening estimate from a state-policy table — verify with the county assessor before closing.
Climate risk First Street
- Flood 1/10 Low FEMA zone X (unshaded) · 0% chance over 30 yrs
- Wildfire 1/10 Low
- Heat 10/10 Extreme 7 d/yr ≥105°F today · 23 d/yr by 30 yrs out
- Wind 9/10 Extreme 99% chance of damaging wind over 30 yrs
- Air quality 2/10 Low 0 unhealthy d/yr today · 1 by 30 yrs out
Nearby sold comps map
Loading sold comps map…
Walkable amenities ~0.75 mi
Loading nearby amenities…
Taxation est. · year 1
- Rental income
- $24,350
- − Mortgage interest
- −$12,603
- − Property taxes
- −$3,484
- − Insurance
- −$1,125
- − Repairs & maintenance
- −$1,948
- − Management
- −$1,948
- − Depreciation
- −$6,545
- Taxable loss
- −$3,304
- Est. tax savings @ 24.0%
- +$793
- After-tax cash flow
- $1,262/yr
For passive investors: Depreciation is non-cash, so a rental often shows a tax loss while cash-flowing — sheltering income. Rental losses are passive: they offset passive income freely, and up to $25,000/yr can offset ordinary (W-2) income if you actively participate and your MAGI is under $100k (phasing out to $0 by $150k); unused losses carry forward. On sale, claimed depreciation is recaptured at up to 25%, and gains may owe capital-gains tax (a 1031 exchange can defer both). Figures are a year-1 estimate at your 24.0% rate — not tax advice; consult a CPA.
Schools (NCES district)
- District
- Escambia
- NCES district ID
- 1200510
- Math proficiency
- 40% ▼ -9.00%
- Reading proficiency
- 45% ▼ -4.00%
- Median HH income
- $44,649
- Composite
- 36.04/100
- National rank
- #4773
- State rank
- #56 of 73 in FL
Livability — Pensacola
- Score
- 83/100
- State rank
- #53
- US rank
- #924
Category grades
Schools grade is shown separately in the Schools card above.
Census & demographics
- Census place
- Pensacola, FL
- County
- Escambia County · 301,722 people
- City population
- 237,636
- Metro
- Pensacola-Ferry Pass-Brent, FL
- Population (ZIP)
- 4,231
- Household income
- $67,207
- Rent vs Own
- Severe rent burden
- 176.0
Population outlook (Escambia County) Hauer SSP2
- Today (2025)
- 334,637 people
- By 2030
- 345,779 · +3.3%
- By 2040
- 364,828 · +9.0%
- By 2050
- 378,514 · +13.1%
- By 2075
- 403,220 · +20.5%
- By 2100
- 386,125 · +15.4%
Race, ethnicity, and origin ACS 2023
- Neighborhood character
- Diverse neighborhood (Simpson 0.58)
- Race & ethnicity
- White 60% Black 24% Two or more races 11% Hispanic / Latino 5% Pacific Islander 1%
- Common ancestry
- Slovak 3% Lithuanian 3% Italian 2%
- Foreign-born
- 6% · Canada, China
- Languages at home
- 90% English-only · Spanish 4% French/Haitian/Cajun 3% Chinese 1%
Political lean MEDSL · Escambia
- 2024 margin
- R (+19.5) · D 39.7% · R 59.2% · Other 1.1%
- 2008→2024 swing
- -0.2pp no change · 2008: -19.3pp · 2024: -19.5pp
- All cycles
- 2024: R+19.5 2020: R+15.1 2016: R+20.6 2012: R+20.6 2008: R+19.3
Not yet ingested
- Civics
- —
Market trends
- HPI YoY
- ▼ -64.19%
- Current HPI
- 248.7402
- Rent YoY
- ▼ -0.44%
- Metro
- Pensacola-Ferry Pass-Brent, FL
- State GDP YoY
- ▲ 3.28%
- F500 in state
- 36
Industry mix (Fortune 500 HQ in FL)
| Industry | F500 HQs | Revenue |
|---|---|---|
| Industrial Technology | 2 | $29B |
|
||
| Insurance | 2 | $17B |
|
||
| Retail | 1 | $60B |
|
||
| Technology Distribution | 1 | $58B |
|
||
| Homebuilding | 1 | $35B |
|
||
| Technology Manufacturing | 1 | $35B |
|
||
Price history
+282.0% since first listed4 events — show timeline
- 2026-06-11 Contingent — PARMLS
- 2026-06-05 Price Changed $225,000 PARMLS
- 2026-05-14 Listed $249,000 PARMLS
- 2020-09-08 Sold (Public Records) $58,900 Public Records
Property tax history
+24.7%/yrLatest (2025): $3,484 · +12.5% YoY. Source: county tax records.
Cash-flow waterfall
monthlySold comps — $/sqft
last 12 mo · ≤1 miLoading sold comps…