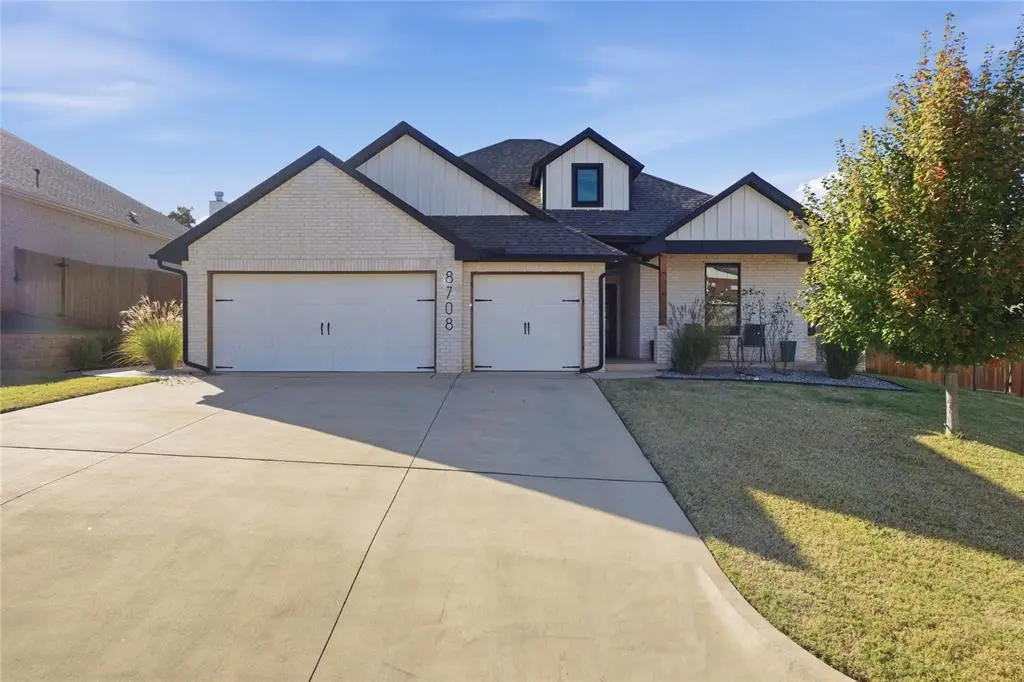
8708 Snow Ct · Edmond, OK
Flood risk 1/10 · Minimal
- FEMA flood zone
- X (unshaded)
- Chance of flooding over 30 yrs
- 0.0%
- Est. flood insurance / yr
- $507 – $1,088
Fire risk 5/10 · Moderate
- Est. fire insurance / yr
- $2,463 – $4,575
Heat risk 5/10 · Moderate
- Hot days now (above 109°F)
- 7 days/yr
- Hot days in 30 yrs
- 18 days/yr
Wind risk 2/10 · Minimal
- Chance of severe wind over 30 yrs
- 3.0%
Air-quality risk 2/10 · Minimal
- Unhealthy air days now
- 2 days/yr
- Unhealthy air days in 30 yrs
- 2 days/yr
Risk factors via First Street. Map © Google.
Why this score? — see what drove the D- grade
The composite is a weighted blend of 9 inputs, each scored 0–100. Each bar is that input's sub-score; the figure is the points it added to the 100-point composite (weight × sub-score).
- Appreciation +10.0/10.0
- Cash flow +6.5/30.0
- ARV discount +6.4/15.0
- Livability +3.9/5.0
- Schools +3.6/10.0
- Rent growth +2.5/5.0
- Condition / age +2.5/5.0
- 1% rule +1.4/10.0
- DSCR +0.8/10.0
$438,500
🖨 Deal sheet 📄 Offer letter ✓ Due diligence
Listing remarks
Recently built and thoughtfully upgraded, this beautifully designed 4-bedroom, 2.5-bath home offers the perfect blend of modern construction, custom features, and a rare wooded setting. Situated on a premium lot with a canopy of mature trees, this home provides privacy and scenic views while still offering the benefits of a newer home. Inside, the open-concept layout features soaring cathedral ceilings, picturesque windows, and a stunning floor-to-ceiling stone fireplace. The kitchen is well-appointed with quartz countertops, double ovens, a 5-burner gas range with griddle, walk-in pantry with glass door, and upper glass-front cabinets with lighting—ideal for everyday living and enter
Key facts
- Quartz countertops
- Covered patio
- Premium lot
Tags
Property features AI
Finance
- Other: Homestead exemption claimed; Occupied by owner; Home warranty included
- HOA & community: Mandatory association dues; Annual association fee of $1,000; Association covers gated entry, grounds maintenance, pool, and recreation facility
Exterior
- Parking: 3-car garage
- Utilities: Standard municipal utilities implied
- Home design: Single-family residence; One-story; North-facing; Existing property
- Construction: Brick and frame construction; Composition roof (replaced 2020); Low-E windows; Slab foundation; Built by Taber
- Exterior features: Interior, wooded lot; Wood fencing; Patio (covered and open); Covered porch; Outbuildings; Garage floor storm shelter
Interior
- Kitchen: Built-in gas range; Double electric ovens; Dishwasher; Microwave; Garbage disposal
- Bedrooms: 4 bedrooms (one-level home)
- Bathrooms: 2 full bathrooms; 1 half bathroom
- Heating & cooling: Programmable thermostat
- Interior features: In-law plan; Two gas-log fireplaces; Covered porch; Patio (covered and open); Outbuildings
- Laundry & utility: Washer/dryer hookups (standard laundry features implied)
Neighborhood map
What this means for you Summary
Snapshot
- This is a 4-bed/3.0-bath single-family listed at $438k.
Deal economics
- At list price, monthly cash flow is $-739 ($-9k/yr) — negative.
- To cash-flow at today's rent, offer at most $308k (29.8% below list).
- To meet the 1% rule (rent ≥ 1% of price), the offer needs to be $280k (36.1% below list).
- Recommended offer: $280k (36.1% below list) — sets the bar for 1% rule.
- Cap rate 4.3% vs local median 3.4% in Edmond — meaningfully above typical; check what's discounted (condition, days-on-market, listing class) to confirm the premium yield is real.
Location & tenants
- Location reads 78/100 on livability (#6 in OK, #2,383 nationally) — a middle-class / working-renter tenant base. Strengths: employment A+, housing A+, crime A-; Watch: health & safety C-, commute F.
- Edmond (suburban): math 38% / reading 40% proficiency, ranked #11 of 270 in OK (top 4%) — families likely to look elsewhere, expect single-tenant / working-renter base with shorter leases.
- Zoned schools: Redbud Es (616 students, 0% FRL); Memorial Hs (math 44% / reading 56%, grade D+, #4 of 447 statewide, top 1%, 2,605 students, 0% FRL) — zoned schools average 0% FRL vs 22% district-wide (22 pts lower); this property's tenant base skews higher-income than the district average.
- Market conditions: 192 active listings in the ZIP; 2 comparable units currently listed for rent nearby; 5,365 units permitted in Oklahoma County in 2024 (569 in 5+ unit buildings).
Forward outlook
- In year one you build about $47k of equity ($3k loan paydown + $44k appreciation (10.0% local appreciation)).
- Oklahoma County population projected at +41% by 2050 — long-run rental-demand tailwind backs the buy-and-hold thesis.
- By year 2, paydown + projected appreciation supports a ~$75k cash-out refi (75% LTV) — recoverable capital for the next deal without selling this one.
Negotiation context
- Only 11 days on market — expect competitive offers; lowballing is unlikely to land.
- 2 sale attempts with the ask held roughly flat each time — persistent listings suggest the price (not the market) is what's stuck; bring a comps-based counter.
Risks & watch-outs
- Climate carrying-cost: moderate wildfire risk; extreme-heat days projected 7→18/yr by 2055 (HVAC capex compounding) — expect insurance premiums to compound above CPI over the hold.
Questions for the listing agent
- What do current leases actually rent for vs. the listed asking? Can we see a recent rent roll and the last 12 months of T-12 income?
- What does the HOA fee cover, when was the last increase, and are there any pending special assessments or reserve-fund shortfalls?
- Is there a deadline driving the sale (1031 exchange, divorce, estate, relocation)? That informs how much negotiation room exists.
- Schools are A-rated — typically a magnet for longer-tenancy family renters. What's the average tenant stay here, and is there a school-zone premium baked into asking?
- The area grade is low — what's the realistic commute time and amenity access for the typical tenant pool here? Any planned neighborhood developments (good or bad) we should know about?
- What's the average days-on-market for RENTAL listings here right now (not sales)? A rising rental-DOM trend means longer vacancies and softer asking-rent achievability than the comps imply.
- What's the recent tenant-quality profile in this submarket — average credit score on applications, eviction rate, late-payment / NSF rate, and stable-employment percentage? A property-management company in the area should have these aggregated.
- How much new for-sale + rental construction is in the pipeline within 1–3 miles? Heavy new supply typically softens prices + rents 12–24 months out; constrained supply supports both.
Investment metrics
- 1% rule
- 0.64% ✗
- Cap rate
- 4.27%
- Cash-on-cash
- -7.22%
- DSCR
- 0.68
- GRM
- 13.0
CMA / ARV
- ARV (on-the-fly)
- $428,330
- Comps found
- 12
Show comp detail 12 sales within ~0.75 mi
| Address | Dist | Beds/Ba | Sqft | Sold | Price | $/sf | Match |
|---|---|---|---|---|---|---|---|
| 8708 Snow Ct | 0.00mi | 4/2.5 | 2,030 (0%) | 1mo | $433,500 | $214 | 97 |
| 4901 Highgarden Ave | 0.10mi | 4/2.5 | 2,015 (-1%) | 1mo | $425,000 | $211 | 91 |
| 8716 Snow Ct | 0.01mi | 4/2.5 | 2,077 (+2%) | 12mo | $419,000 | $202 | 83 |
| 8716 Grey Wind Way | 0.08mi | 4/2.5 | 2,000 (-2%) | 13mo | $445,340 | $223 | 81 |
| 4924 Highgarden Ave | 0.09mi | 4/2.0 | 2,206 (+9%) | 0mo | $445,000 | $202 | 77 |
| 5125 Sunspear Dr | 0.21mi | 4/2.5 | 2,000 (-2%) | 13mo | $467,990 | $234 | 75 |
| 5117 Sunspear Dr | 0.20mi | 4/2.5 | 2,000 (-2%) | 15mo | $442,340 | $221 | 74 |
| 8701 Tyrion Dr | 0.27mi | 4/2.5 | 2,000 (-2%) | 12mo | $449,840 | $225 | 73 |
| 8616 Grey Wind Way | 0.08mi | 4/3.0 | 2,300 (+13%) | 12mo | $480,340 | $209 | 64 |
| 8709 Tyrion Dr | 0.27mi | 4/3.0 | 2,250 (+11%) | 9mo | $475,340 | $211 | 62 |
| 8308 Dax Dr | 0.62mi | 4/2.5 | 2,109 (+4%) | 11mo | $428,000 | $203 | 54 |
| 8117 Dax Dr | 0.65mi | 3/2.5 (-1) | 2,142 (+6%) | 13mo | $409,900 | $191 | 43 |
Match score weights: distance 35% · size 25% · config 20% · recency 20%. Top-matched comps best support the ARV.
Projected returns pro-forma
10.0% appreciation · 3.0% rent growth · sell at horizon
- IRR
- 19.2%
- Equity multiple
- 2.56×
- Total profit
- $191,773
- Equity at exit
- $395,036
- IRR
- 17.7%
- Equity multiple
- 5.90×
- Total profit
- $601,721
- Equity at exit
- $851,909
Cash invested: $122,780 (down + closing). Projections, not guarantees.
Landlord ↔ Tenant lean methodology
- Overall (STATE)
- 83 Strongly Landlord-Friendly
- State Oklahoma
- 83 Strongly Landlord-Friendly · R+20
- County
- — inherits STATE
- City
- — inherits STATE
ZIP-level market 73007
- Home prices YoY
- 4.0%
- Active inventory
- 192
- Price-to-rent
- 13.0×
Monthly cashflow live
- Estimated rent
- $2,802 medium interval (Pro) →
- Mortgage (P&I)
- −$2,300
- Tax from tax record
- −$387 /mo · $4,647/yr
- Insurance
- −$183
- HOA
- −$83
- Vacancy / Maint / Mgmt
- −$589
- Net cashflow
- $-739
Break-even live
UW: 25.0% down · 7.5% · 30yr · 1.5% tax · 5.0% vac · 8.0% maint · 8.0% mgmt
Financing live
Cash to close
- Down payment
- $109,625
- Closing costs
- $13,155
- Reserves months
- —
- Total cash needed
- —
Loan-product check · same deal, 3 products live
Conventional
25% down · 7.5% · 30yr
- Down + closing
- —
- Monthly P&I
- —
- Monthly cashflow
- —
- DSCR
- —
- Eligible?
- —
Personal DTI + credit; lowest rate.
DSCR
20% down · 8.5% · 30yr
- Down + closing
- —
- Monthly P&I
- —
- Monthly cashflow
- —
- DSCR
- —
- Eligible?
- —
No personal income docs; deal must DSCR.
Hard money
10% down · 12.0% · 12mo
- Down + closing
- —
- Monthly P&I
- —
- Monthly cashflow
- —
- DSCR
- —
- Eligible?
- —
Short-term bridge; refi at stabilization.
Rent comps 2 comps
| Address | Beds | Baths | Sqft | Rent | $/sqft | DOM | Units | Dist |
|---|---|---|---|---|---|---|---|---|
| 5216 Bing Cir Edmond, OK | 3.0 | 2.0 | 1631 | $2,300 | $1.41 | 16d | 1 | 0.32mi |
| 7901 Behr Dr Edmond, OK | 5.0 | 4.0 | 2829 | $4,000 | $1.41 | 20d | 1 | 0.68mi |
HOA detail
- Monthly dues
- $83 · $996/yr
- Likely covers
- gas
Listing history 6 events
-
2026-04-20status Pending
-
2026-04-09$438,500 Active
-
2026-04-08historical
-
2026-02-02price $447,900
-
2025-11-07price $448,900
-
2025-10-15$449,900 Active
ⓘ Source: listings_history table (triggers on properties + properties_extension) + one-shot
backfill from property_details.listing_events for pre-trigger history.
Tax reassessment forecast OK · Resets to sale price
- Current annual tax
- $4,647 · $387/mo
- Projected year-2 tax
- $4,647 · $387/mo
- Expected delta
- $0/yr ($0/mo · 0.0%)
ⓘ Screening estimate from a state-policy table — verify with the county assessor before closing.
Climate risk First Street
- Flood 1/10 Low FEMA zone X (unshaded) · 0% chance over 30 yrs
- Wildfire 5/10 Major
- Heat 5/10 Major 7 d/yr ≥109°F today · 18 d/yr by 30 yrs out
- Wind 2/10 Low 3% chance of damaging wind over 30 yrs
- Air quality 2/10 Low 2 unhealthy d/yr today · 2 by 30 yrs out
Nearby sold comps map
Loading sold comps map…
Walkable amenities ~0.75 mi
Loading nearby amenities…
Taxation est. · year 1
- Rental income
- $33,629
- − Mortgage interest
- −$24,563
- − Property taxes
- −$4,647
- − Insurance
- −$2,192
- − Repairs & maintenance
- −$2,690
- − Management
- −$2,690
- − HOA
- −$996
- − Depreciation
- −$12,756
- Taxable loss
- −$16,906
- Est. tax savings @ 24.0%
- +$4,057
- After-tax cash flow
- $-4,805/yr
For passive investors: Depreciation is non-cash, so a rental often shows a tax loss while cash-flowing — sheltering income. Rental losses are passive: they offset passive income freely, and up to $25,000/yr can offset ordinary (W-2) income if you actively participate and your MAGI is under $100k (phasing out to $0 by $150k); unused losses carry forward. On sale, claimed depreciation is recaptured at up to 25%, and gains may owe capital-gains tax (a 1031 exchange can defer both). Figures are a year-1 estimate at your 24.0% rate — not tax advice; consult a CPA.
Schools (NCES district)
- District
- Edmond
- NCES district ID
- 4010590
- Math proficiency
- 38% ▼ -12.00%
- Reading proficiency
- 40% ▼ -12.00%
- Median HH income
- $73,212
- Composite
- 35.88/100
- National rank
- #4814
- State rank
- #11 of 270 in OK
Livability — Edmond
- Score
- 78/100
- State rank
- #6
- US rank
- #2383
Category grades
Schools grade is shown separately in the Schools card above.
Census & demographics
- Census place
- Edmond, OK
- City population
- 177,083
- Population (ZIP)
- 2,945
Population outlook (Oklahoma County) Hauer SSP2
- Today (2025)
- 911,875 people
- By 2030
- 982,413 · +7.7%
- By 2040
- 1,130,468 · +24.0%
- By 2050
- 1,288,422 · +41.3%
- By 2075
- 1,711,482 · +87.7%
- By 2100
- 2,088,448 · +129.0%
Race, ethnicity, and origin ACS 2023
- Neighborhood character
- Predominantly White (80%)
- Race & ethnicity
- White 80% Two or more races 15% Hispanic / Latino 5% Black 2%
- Common ancestry
- Lithuanian 5% Romanian 3% Italian 2%
- Foreign-born
- 2% · Canada
- Languages at home
- 94% English-only · Spanish 2% Other Asian/Pacific 1%
Political lean MEDSL · Oklahoma
- 2024 margin
- Toss-up / Even · D 48.0% · R 49.7% · Other 2.3%
- 2008→2024 swing
- +15.1pp toward D · 2008: -16.8pp · 2024: -1.7pp
- All cycles
- 2024: R+1.7 2020: R+1.1 2016: R+10.5 2012: R+16.7 2008: R+16.8
Not yet ingested
- Civics
- —
Market trends
- HPI YoY
- ▲ 12.99%
- Current HPI
- 336.6015
- Rent YoY
- —
- Metro
- —
- State GDP YoY
- ▲ 1.55%
- F500 in state
- 6
Industry mix (Fortune 500 HQ in OK)
| Industry | F500 HQs | Revenue |
|---|---|---|
| Energy | 3 | $48B |
|
||
Price history
-2.5% since first listed6 events — show timeline
- 2026-04-20 Pending — MLSOK
- 2026-04-09 Listed $438,500 MLSOK
- 2026-04-08 Listing Removed — MLSOK
- 2026-02-02 Price Changed $447,900 MLSOK
- 2025-11-07 Price Changed $448,900 MLSOK
- 2025-10-15 Listed $449,900 MLSOK
Property tax history
+85.3%/yrLatest (2025): $4,647 · +5.1% YoY. Source: county tax records.
Cash-flow waterfall
monthlySold comps — $/sqft
last 12 mo · ≤1 miLoading sold comps…