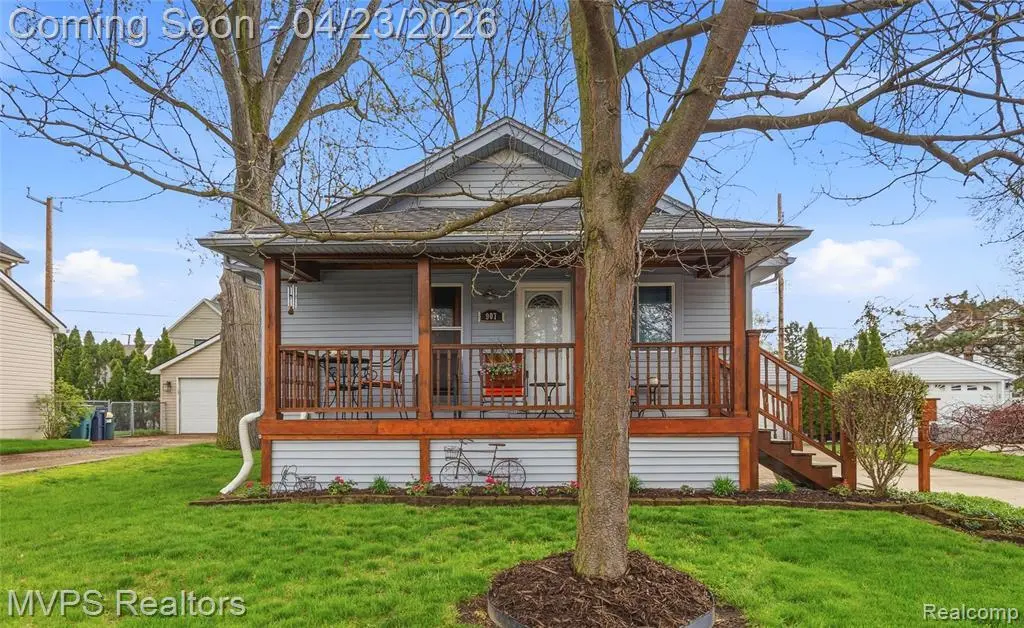
907 Batavia Ave · Royal Oak, MI
Flood risk 3/10 · Minor
- FEMA flood zone
- X (unshaded)
- Chance of flooding over 30 yrs
- 0.2%
- Est. flood insurance / yr
- $473 – $860
Fire risk 1/10 · Minimal
- Est. fire insurance / yr
- $784 – $1,456
Heat risk 3/10 · Minor
- Hot days now (above 97°F)
- 7 days/yr
- Hot days in 30 yrs
- 15 days/yr
Wind risk 2/10 · Minimal
- Chance of severe wind over 30 yrs
- —
Air-quality risk 3/10 · Minor
- Unhealthy air days now
- 3 days/yr
- Unhealthy air days in 30 yrs
- 5 days/yr
Risk factors via First Street. Map © Google.
Why this score? — see what drove the C grade
The composite is a weighted blend of 9 inputs, each scored 0–100. Each bar is that input's sub-score; the figure is the points it added to the 100-point composite (weight × sub-score).
- Cash flow +21.7/30.0
- ARV discount +11.7/15.0
- DSCR +6.9/10.0
- 1% rule +4.8/10.0
- Schools +4.4/10.0
- Livability +4.2/5.0
- Rent growth +3.7/5.0
- Condition / age +2.5/5.0
- Appreciation +0.0/10.0
$259,900
🖨 Deal sheet 📄 Offer letter ✓ Due diligence
Listing remarks MLS
Clean, Comfortable, and Cozy! Awesome location, walk to downtown! Bright, open, and airy space. Enjoy the big, covered front porch, and the nice space in the yard. Maintenence free exterior. 2 car garage. Seller has been here for 50 years, and the property is well maintained!
Key facts
- 6,098 sq ft lot
- 2 garage spots
- Built 1920
Neighborhood map
What this means for you Summary
Snapshot
- This is a 3-bed/2.0-bath single-family listed at $260k.
Deal economics
- At list price, monthly cash flow is $399 ($5k/yr) — positive.
- The deal already cash-flows at list — no discount required.
- To meet the 1% rule (rent ≥ 1% of price), the offer needs to be $256k (1.6% below list).
- Recommended offer: $252k (3.0% below list) — sets the bar for market timing.
- Cap rate 8.1% vs local median 3.8% in Royal Oak — top-decile yield for the area; either an underpriced asset or a hidden risk that comps aren't pricing in. Stress-test before assuming the spread holds.
Location & tenants
- Location reads 83/100 on livability (#50 in MI, #1,020 nationally) — a professional / high-income tenant draw. Strengths: crime A+, commute A+, employment A+; Watch: amenities D+.
- Royal Oak Schools (suburban): math 41% / reading 59% proficiency, ranked #89 of 540 in MI (top 16%) — acceptable for families but not a draw, mixed tenant base, ~2y average lease; only 20% free/reduced lunch — higher-income household profile.
- Market conditions: Rents rising fast (+4.7%/yr); 209 active listings in the ZIP; 26 comparable units currently listed for rent nearby; rentals leasing fast (median 4d on market — plan ~1-2 weeks tenant-placement turnaround); high-income renter base; 2,614 units permitted in Oakland County in 2024 (721 in 5+ unit buildings).
Forward outlook
- Local home prices are declining (-3.0%/yr); year-one equity from $2k of loan paydown is wiped out by about $8k of value loss. Plan a longer hold.
- Oakland County population projected at +10% by 2050 — modest demand growth; plan on rents tracking national, not racing it.
Negotiation context
- It's been on market 57 days — a 3% lower offer ($252k) is reasonable based on typical stale-listing flexibility.
- 4 sale attempts; this cycle's ask has dropped $19k (7%) from the opening price — seller is motivated, your offer sets the floor, not the list.
- Current owner paid $18k; list at $260k implies a 1385% gain — meaningful room to come down on a strong offer.
Risks & watch-outs
- Watch-outs: built in 1920 — expect roof / HVAC / electrical / plumbing capex.
Questions for the listing agent
- It's been on market 57 days. Have you received any prior offers? Is the seller open to a 3% concession, seller financing, or rate buy-down credit?
- Built in 1920 — when were the roof, HVAC, electrical panel, plumbing, and water heater last replaced?
- Is there a deadline driving the sale (1031 exchange, divorce, estate, relocation)? That informs how much negotiation room exists.
- Schools are B-rated — typically a magnet for longer-tenancy family renters. What's the average tenant stay here, and is there a school-zone premium baked into asking?
- What's the average days-on-market for RENTAL listings here right now (not sales)? A rising rental-DOM trend means longer vacancies and softer asking-rent achievability than the comps imply.
- What's the recent tenant-quality profile in this submarket — average credit score on applications, eviction rate, late-payment / NSF rate, and stable-employment percentage? A property-management company in the area should have these aggregated.
- How much new for-sale + rental construction is in the pipeline within 1–3 miles? Heavy new supply typically softens prices + rents 12–24 months out; constrained supply supports both.
Investment metrics
- 1% rule
- 0.98% ✗
- Cap rate
- 8.14%
- Cash-on-cash
- 6.59%
- DSCR
- 1.29
- GRM
- 8.5
CMA / ARV
- ARV (median comp)
- $286,326
- List price
- $259,900
- Delta
- -9.23%
- Verdict
- FAIR
- Comps
- 20 within 1.0 mi
Show comp detail 12 sales within ~0.75 mi
| Address | Dist | Beds/Ba | Sqft | Sold | Price | $/sf | Match |
|---|---|---|---|---|---|---|---|
| 707 Lawson St | 0.16mi | 3/1.5 | 1,879 (+4%) | 2mo | $499,000 | $266 | 82 |
| 1319 Hoffman Ave | 0.56mi | 3/2.0 | 1,906 (+6%) | 0mo | $367,000 | $193 | 64 |
| 510 S Edison Ave | 0.72mi | 3/2.0 | 1,823 (+1%) | 2mo | $355,000 | $195 | 63 |
| 14 Kensington Blvd | 0.62mi | 3/2.0 | 1,894 (+5%) | 1mo | $430,000 | $227 | 62 |
| 218 S Gainsborough Ave | 0.50mi | 3/2.0 | 1,975 (+9%) | 2mo | $413,500 | $209 | 59 |
| 430 S Edison Ave | 0.73mi | 3/2.0 | 1,686 (-7%) | 0mo | $425,000 | $252 | 55 |
| 535 S Campbell Rd | 0.69mi | 3/2.5 | 1,700 (-6%) | 2mo | $328,000 | $193 | 54 |
| 201 N Rembrandt Ave | 0.69mi | 3/1.0 | 1,926 (+7%) | 1mo | $335,000 | $174 | 52 |
| 52 Devonshire Rd | 0.62mi | 4/1.0 (+1) | 1,689 (-6%) | 2mo | $427,000 | $253 | 50 |
| 49 Amherst Rd | 0.70mi | 3/2.0 | 1,568 (-13%) | 2mo | $545,000 | $348 | 44 |
| 1521 E 5th St | 0.63mi | 3/2.5 | 2,068 (+15%) | 1mo | $735,000 | $355 | 43 |
| 125 N Blair Ave | 0.69mi | 3/1.0 | 1,600 (-11%) | 2mo | $383,919 | $240 | 43 |
Match score weights: distance 35% · size 25% · config 20% · recency 20%. Top-matched comps best support the ARV.
Projected returns pro-forma
-3.0% appreciation · 4.72% rent growth · sell at horizon
- IRR
- -4.4%
- Equity multiple
- 0.83×
- Total profit
- $-12,244
- Equity at exit
- $38,752
- IRR
- 7.0%
- Equity multiple
- 1.56×
- Total profit
- $40,939
- Equity at exit
- $22,471
Cash invested: $72,772 (down + closing). Projections, not guarantees.
Landlord ↔ Tenant lean methodology
- Overall (STATE)
- 62 Landlord-Friendly
- State Michigan
- 62 Landlord-Friendly · EVEN
- County
- — inherits STATE
- City
- — inherits STATE
ZIP-level market 48067
- Rents YoY
- 4.7%
- Active inventory
- 209
- Price-to-rent
- 8.5×
Monthly cashflow live
- Estimated rent
- $2,556 high interval (Pro) →
- Mortgage (P&I)
- −$1,363
- Tax from tax record
- −$149 /mo · $1,785/yr
- Insurance
- −$108
- HOA
- −$0
- Vacancy / Maint / Mgmt
- −$537
- Net cashflow
- $399
Break-even live
UW: 25.0% down · 7.5% · 30yr · 1.5% tax · 5.0% vac · 8.0% maint · 8.0% mgmt
Financing live
Cash to close
- Down payment
- $64,975
- Closing costs
- $7,797
- Reserves months
- —
- Total cash needed
- —
Loan-product check · same deal, 3 products live
Conventional
25% down · 7.5% · 30yr
- Down + closing
- —
- Monthly P&I
- —
- Monthly cashflow
- —
- DSCR
- —
- Eligible?
- —
Personal DTI + credit; lowest rate.
DSCR
20% down · 8.5% · 30yr
- Down + closing
- —
- Monthly P&I
- —
- Monthly cashflow
- —
- DSCR
- —
- Eligible?
- —
No personal income docs; deal must DSCR.
Hard money
10% down · 12.0% · 12mo
- Down + closing
- —
- Monthly P&I
- —
- Monthly cashflow
- —
- DSCR
- —
- Eligible?
- —
Short-term bridge; refi at stabilization.
Rent comps 26 comps
| Address | Beds | Baths | Sqft | Rent | $/sqft | DOM | Units | Dist |
|---|---|---|---|---|---|---|---|---|
| 325 E 6th St Unit 325-10 Royal Oak, MI | 2.0 | 1.5 | 1400 | $1,895 | $1.35 | 5d | 1 | 0.33mi |
| 615 E 5th St Royal Oak, MI | 4.0 | 3.0 | 1329 | $3,000 | $2.26 | 24d | 1 | 0.34mi |
| 1605 Anne Dr Royal Oak, MI | 2.0 | 3.5 | 1814 | $2,900 | $1.60 | 3d | 1 | 0.36mi |
| 1572 Maryland Club Dr Royal Oak, MI | 2.0 | 2.0 | 1477 | $2,450 | $1.66 | 3d | 1 | 0.36mi |
| 1100 S Main St Royal Oak, MI | 1.0–2.0 | 1.0–2.0 | 1179 | $6,000 | $5.09 | 2d | 3 | 0.40mi |
| 100 W 5th St Royal Oak, MI | 2.0 | 2.0 | 1283 | $3,015 | $2.35 | 5d | 2 | 0.50mi |
| 1414 Owana Ave Royal Oak, MI | 3.0 | 1.0 | 1489 | $1,675 | $1.12 | 22d | 1 | 0.51mi |
| 159 Allenhurst Ave Royal Oak, MI | 3.0 | 2.0 | 1955 | $2,700 | $1.38 | 2d | 1 | 0.53mi |
| 1337 S Washington Ave Royal Oak, MI | 2.0 | 2.0 | 1380 | $2,350 | $1.70 | 2d | 1 | 0.54mi |
| 160 Tiffany Ln Royal Oak, MI | 3.0 | 2.0 | 2275 | $3,000 | $1.32 | 2d | 1 | 0.55mi |
| 25090 Woodward Ave Royal Oak, MI | 1.0–3.0 | 1.0–2.5 | 1146 | $4,195 | $3.66 | 2d | 13 | 0.58mi |
| 118 N Main St Royal Oak, MI | 3.0 | 1.0–3.0 | 1432 | $6,200 | $4.33 | 2d | 4 | 0.67mi |
| 610 W 4th St Royal Oak, MI | 3.0 | 2.5 | 1700 | $2,400 | $1.41 | 2d | 1 | 0.79mi |
| 674 W Eleven Mile Rd Unit 4B Royal Oak, MI | 2.0 | 2.5 | 1577 | $2,700 | $1.71 | 10d | 1 | 0.90mi |
| 2705 Inman St Ferndale, MI | 3.0 | 2.5 | 1429 | $3,195 | $2.24 | 2d | 1 | 1.00mi |
| 406 N Campbell Rd Royal Oak, MI | 3.0 | 2.0 | 1814 | $2,500 | $1.38 | 2d | 1 | 1.02mi |
| 2803 Grayson St Ferndale, MI | 3.0 | 2.0 | 1274 | $2,000 | $1.57 | 44d | 1 | 1.05mi |
| 709 Hawthorn Ave Royal Oak, MI | 3.0 | 1.5 | 2248 | $3,000 | $1.33 | 24d | 1 | 1.06mi |
| 1031 N Sherman Dr Unit A Royal Oak, MI | 3.0 | 2.5 | 1500 | $3,000 | $2.00 | 2d | 1 | 1.14mi |
| 2186 Garfield St Ferndale, MI | 3.0 | 1.0 | 1300 | $1,750 | $1.35 | 24d | 1 | 1.29mi |
| 1106 Grove Ave Royal Oak, MI | 4.0 | 2.5 | 1289 | $2,325 | $1.80 | 2d | 1 | 1.33mi |
| 211 Woodsboro Dr Unit LOWER Royal Oak, MI | 3.0 | 2.0 | 1800 | $1,425 | $0.79 | 24d | 1 | 1.41mi |
| 1414 Crooks Rd Unit 2 Royal Oak, MI | 3.0 | 2.0 | 1400 | $1,800 | $1.29 | 24d | 1 | 1.41mi |
| 1132 N Campbell Rd Royal Oak, MI | 1.0–3.0 | 1.0–1.5 | 1050 | $2,085 | $1.99 | 2d | 7 | 1.41mi |
| 215 Woodsboro Dr Royal Oak, MI | 3.0 | 2.0 | 2542 | $2,200 | $0.87 | 5d | 1 | 1.41mi |
| 508 Marlin Ave Royal Oak, MI | 3.0 | 2.5 | 1678 | $3,000 | $1.79 | 20d | 1 | 1.49mi |
Listing history 21 events
-
2026-06-18days on market $259,900 Active 57 DOM
-
2026-06-17days on market $259,900 Active 56 DOM
-
2026-06-16days on market $259,900 Active 55 DOM
-
2026-06-15days on market $259,900 Active 54 DOM
-
2026-06-13days on market $259,900 Active 52 DOM
-
2026-06-09days on market $259,900 Active 48 DOM
-
2026-06-08days on market $259,900 Active 47 DOM
-
2026-06-07days on market $259,900 Active 46 DOM
-
2026-06-04days on market $259,900 Active 43 DOM
-
2026-06-03days on market $259,900 Active 42 DOM
-
2026-06-02days on market $259,900 Active 41 DOM
-
2026-06-01days on market $259,900 Active 40 DOM
-
2026-05-31days on market $259,900 Active 39 DOM
-
2026-05-03status Active 277-char remark
Show marketing remark (276 chars)
Clean, Comfortable, and Cozy! Awesome location, walk to downtown! Bright, open, and airy space. Enjoy the big, covered front porch, and the nice space in the yard. Maintenence free exterior. 2 car garage. Seller has been here for 50 years, and the property is well maintained!
-
2026-05-03status Active 276-char remark
Show marketing remark (276 chars)
Clean, Comfortable, and Cozy! Awesome location, walk to downtown! Bright, open, and airy space. Enjoy the big, covered front porch, and the nice space in the yard. Maintenence free exterior. 2 car garage. Seller has been here for 50 years, and the property is well maintained!
-
2026-04-29historical Accepting Backup Offers 276-char remark
Show marketing remark (277 chars)
Clean, Comfortable, and Cozy! Awesome location, walk to downtown! Bright, open, and airy space. Enjoy the big, covered front porch, and the nice space in the yard. Maintenence free exterior. 2 car garage. Seller has been here for 50 years, and the property is well maintained!
-
2026-04-29historical Active Under Contract 277-char remark
Show marketing remark (277 chars)
Clean, Comfortable, and Cozy! Awesome location, walk to downtown! Bright, open, and airy space. Enjoy the big, covered front porch, and the nice space in the yard. Maintenence free exterior. 2 car garage. Seller has been here for 50 years, and the property is well maintained!
-
2026-04-23$278,900 Active 276-char remark
Show marketing remark (277 chars)
Clean, Comfortable, and Cozy! Awesome location, walk to downtown! Bright, open, and airy space. Enjoy the big, covered front porch, and the nice space in the yard. Maintenence free exterior. 2 car garage. Seller has been here for 50 years, and the property is well maintained!
-
2026-04-23$278,900 Active 277-char remark
Show marketing remark (277 chars)
Clean, Comfortable, and Cozy! Awesome location, walk to downtown! Bright, open, and airy space. Enjoy the big, covered front porch, and the nice space in the yard. Maintenence free exterior. 2 car garage. Seller has been here for 50 years, and the property is well maintained!
-
2026-04-21historical $278,900 276-char remark
Show marketing remark (276 chars)
Clean, Comfortable, and Cozy! Awesome location, walk to downtown! Bright, open, and airy space. Enjoy the big, covered front porch, and the nice space in the yard. Maintenence free exterior. 2 car garage. Seller has been here for 50 years, and the property is well maintained!
-
1973-04-01soldstatus $17,500
ⓘ Source: listings_history table (triggers on properties + properties_extension) + one-shot
backfill from property_details.listing_events for pre-trigger history.
Tax reassessment forecast MI · Partial reset (capped growth)
- Current annual tax
- $1,785 · $149/mo
- Projected year-2 tax
- $2,894 · $241/mo
- Expected delta
- +$1,109/yr (+$92/mo · 62.1%)
ⓘ Screening estimate from a state-policy table — verify with the county assessor before closing.
Climate risk First Street
- Flood 3/10 Moderate FEMA zone X (unshaded) · 20% chance over 30 yrs
- Wildfire 1/10 Low
- Heat 3/10 Moderate 7 d/yr ≥97°F today · 15 d/yr by 30 yrs out
- Wind 2/10 Low
- Air quality 3/10 Moderate 3 unhealthy d/yr today · 5 by 30 yrs out
Nearby sold comps map
Loading sold comps map…
Walkable amenities ~0.75 mi
Loading nearby amenities…
Taxation est. · year 1
- Rental income
- $30,675
- − Mortgage interest
- −$14,558
- − Property taxes
- −$1,785
- − Insurance
- −$1,300
- − Repairs & maintenance
- −$2,454
- − Management
- −$2,454
- − Depreciation
- −$7,561
- Taxable income
- $563
- Est. tax owed @ 24.0%
- −$135
- After-tax cash flow
- $4,658/yr
For passive investors: Depreciation is non-cash, so a rental often shows a tax loss while cash-flowing — sheltering income. Rental losses are passive: they offset passive income freely, and up to $25,000/yr can offset ordinary (W-2) income if you actively participate and your MAGI is under $100k (phasing out to $0 by $150k); unused losses carry forward. On sale, claimed depreciation is recaptured at up to 25%, and gains may owe capital-gains tax (a 1031 exchange can defer both). Figures are a year-1 estimate at your 24.0% rate — not tax advice; consult a CPA.
Schools (NCES district)
- District
- Royal Oak Schools
- NCES district ID
- 2630300
- Math proficiency
- 41% ▼ -10.00%
- Reading proficiency
- 59% ▼ -3.00%
- Median HH income
- $65,456
- Composite
- 44.19/100
- National rank
- #2853
- State rank
- #89 of 540 in MI
Livability — Royal Oak
- Score
- 83/100
- State rank
- #50
- US rank
- #1020
Category grades
Schools grade is shown separately in the Schools card above.
Census & demographics
- Census place
- Royal Oak, MI
- County
- Oakland County · 1,009,092 people
- City population
- 57,974
- Metro
- Detroit-Warren-Dearborn, MI
- Population (ZIP)
- 24,868
- Household income
- $112,840
- Rent vs Own
- Severe rent burden
- 625.0
Population outlook (Oakland County) Hauer SSP2
- Today (2025)
- 1,335,747 people
- By 2030
- 1,375,100 · +2.9%
- By 2040
- 1,435,385 · +7.5%
- By 2050
- 1,469,250 · +10.0%
- By 2075
- 1,531,946 · +14.7%
- By 2100
- 1,450,485 · +8.6%
Race, ethnicity, and origin ACS 2023
- Neighborhood character
- Predominantly White (82%)
- Race & ethnicity
- White 82% Hispanic / Latino 7% Two or more races 7% Black 3% Asian 3%
- Hispanic origin (detail)
- Mexican 3%
- Common ancestry
- Romanian 12% Lithuanian 4% Slovak 4%
- Foreign-born
- 7% · Canada, China, South Korea
- Languages at home
- 92% English-only · Spanish 2% Other Indo-European 2% Russian/Polish/Slavic 1%
Political lean MEDSL · Oakland
- 2024 margin
- D (+10.6) · D 54.4% · R 43.8% · Other 1.9%
- 2008→2024 swing
- -3.9pp toward R · 2008: 14.5pp · 2024: 10.6pp
- All cycles
- 2024: D+10.6 2020: D+14.1 2016: D+8.1 2012: D+8.1 2008: D+14.5
Not yet ingested
- Civics
- —
Market trends
- HPI YoY
- ▼ -571.62%
- Current HPI
- 224.5887
- Rent YoY
- ▲ 4.72%
- Metro
- Detroit-Warren-Dearborn, MI
- State GDP YoY
- ▲ 1.37%
- F500 in state
- 28
Industry mix (Fortune 500 HQ in MI)
| Industry | F500 HQs | Revenue |
|---|---|---|
| Automotive Parts | 3 | $48B |
|
||
| Automotive | 2 | $372B |
|
||
| Chemicals | 1 | $45B |
|
||
| Automotive Retail | 1 | $29B |
|
||
| Healthcare / Medical Devices | 1 | $23B |
|
||
| Automotive Technology | 1 | $20B |
|
||
Price history
+1493.7% since first listed8 events — show timeline
- 2026-05-03 Relisted — REALCOMP
- 2026-05-03 Relisted — MiRealSource-MiMLS
- 2026-04-29 Contingent — MiRealSource-MiMLS
- 2026-04-29 Contingent — REALCOMP
- 2026-04-23 Listed $278,900 MiRealSource-MiMLS
- 2026-04-23 Listed $278,900 REALCOMP
- 2026-04-21 Coming Soon $278,900 MiRealSource-MiMLS
- 1973-04-01 Sold (Public Records) $17,500 Public Records
Property tax history
-1.0%/yrLatest (2025): $1,785 · -22.1% YoY. Source: county tax records.
Cash-flow waterfall
monthlySold comps — $/sqft
last 12 mo · ≤1 miLoading sold comps…