3524 Gonzales St Unit 2A · Austin, TX
Flood risk 1/10 · Minimal
- FEMA flood zone
- X (unshaded)
- Chance of flooding over 30 yrs
- 0.0%
- Est. flood insurance / yr
- $507 – $1,088
Fire risk 4/10 · Minor
- Est. fire insurance / yr
- $1,222 – $2,270
Heat risk 8/10 · Major
- Hot days now (above 108°F)
- 7 days/yr
- Hot days in 30 yrs
- 22 days/yr
Wind risk 8/10 · Major
- Chance of severe wind over 30 yrs
- 80.0%
Air-quality risk 2/10 · Minimal
- Unhealthy air days now
- 1 days/yr
- Unhealthy air days in 30 yrs
- 1 days/yr
Risk factors via First Street. Map © Google.
Why this score? — see what drove the B grade
The composite is a weighted blend of 9 inputs, each scored 0–100. Each bar is that input's sub-score; the figure is the points it added to the 100-point composite (weight × sub-score).
- Cash flow +30.0/30.0
- DSCR +10.0/10.0
- 1% rule +9.1/10.0
- ARV discount +7.5/15.0
- Livability +4.1/5.0
- Condition / age +4.0/5.0
- Schools +3.4/10.0
- Rent growth +2.5/5.0
- Appreciation +0.0/10.0
$285,000
🖨 Deal sheet 📄 Offer letter ✓ Due diligence
Listing remarks MLS
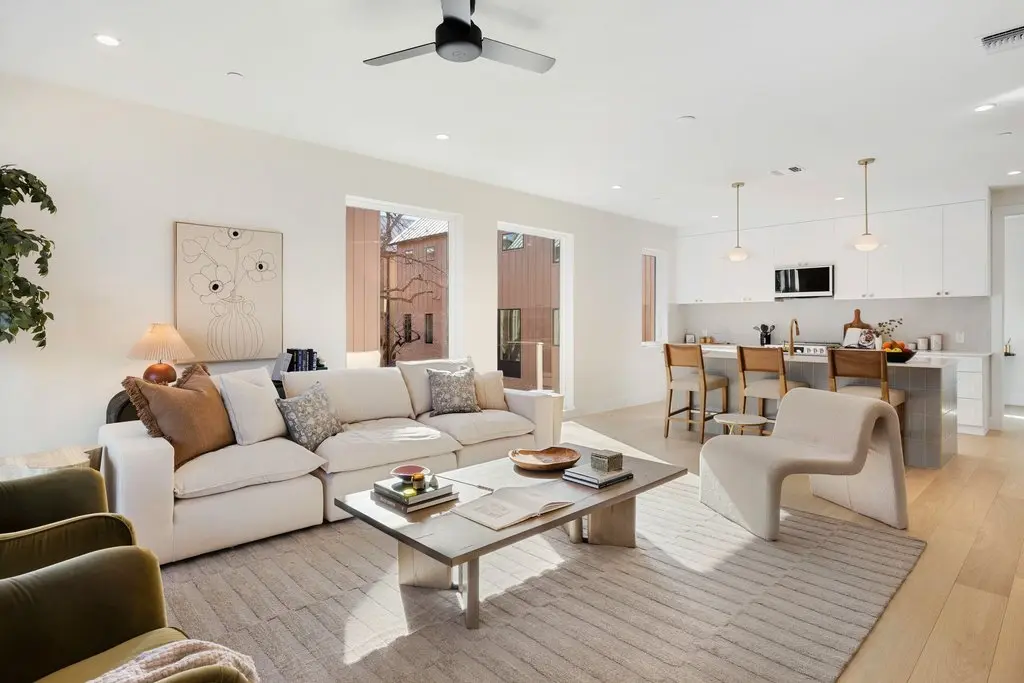
Stunning modern 3-story home offering 4 bedrooms, a flex space, 3 full baths, and 1 half bath—thoughtfully designed for both comfort and style. The open-concept layout flows seamlessly into the living area, highlighted by beautiful windows that fill the home with natural light. Enjoy contemporary finishes, sleek modern appliances, and a sophisticated design throughout. The versatile floor plan includes a private bedroom on the first floor—ideal for guests, a home office, or multigenerational living. Step out onto the balcony for fresh air, or relax in the small, low-maintenance yard. A one-car garage adds convenience and additional storage. This home is part of the City of Austin Affordable Housing Program and is available to income-qualified buyers earning no more than 65% of the Median Family Income (MFI). Don’t miss this rare opportunity to own a modern, thoughtfully designed home at an attainable price.
Key facts
- Private bedroom
- One-car garage
- Open-concept layout
Tags
Neighborhood map
What this means for you Summary
Snapshot
- This is a 4-bed/3.5-bath townhouse listed at $285k. Condition is rated good.
Deal economics
- At list price, monthly cash flow is $1k ($14k/yr) — positive.
- The deal already cash-flows at list — no discount required.
- Meets the 1% rule at list price ($4k rent vs $285k).
- Recommended offer: $259k (9.0% below list) — sets the bar for market timing.
- Cap rate 11.3% vs local median 1.8% in Austin — top-decile yield for the area; either an underpriced asset or a hidden risk that comps aren't pricing in. Stress-test before assuming the spread holds.
Location & tenants
- Location reads 82/100 on livability (#16 in TX, #1,208 nationally) — a professional / high-income tenant draw. Strengths: amenities A+, commute A+, employment A+; Watch: cost of living D, crime F.
- Austin ISD (urban): math 33% / reading 44% proficiency, ranked #431 of 826 in TX (top 52%) — families likely to look elsewhere, expect single-tenant / working-renter base with shorter leases.
- Market conditions: Rents soft (-0.1%/yr); 312 active listings in the ZIP; 33 comparable units currently listed for rent nearby; rentals at typical pace (median 17d on market — plan ~3-4 weeks tenant-placement turnaround); solid renter incomes; 17,121 units permitted in Travis County in 2024 (11,963 in 5+ unit buildings).
- At $4,020/mo this rent would consume 47% of the median local household income ($102k/yr) (locally 1750% of renters already pay >50% of income on rent) — very limited rent-growth headroom before tenants either downsize or default.
Forward outlook
- Local home prices are declining (-3.0%/yr); year-one equity from $2k of loan paydown is wiped out by about $9k of value loss. Plan a longer hold.
- Travis County population projected at +60% by 2050 — long-run rental-demand tailwind backs the buy-and-hold thesis.
- At projected returns (-3.0% appreciation + 0.0% rent growth), your $80k cash investment doubles in ~10 years — after that, you're playing with house money.
Negotiation context
- It's been on market 114 days — a 9% lower offer ($259k) is reasonable based on typical stale-listing flexibility.
Risks & watch-outs
- Climate carrying-cost: severe wind risk, 80% chance of damaging wind over 30y; extreme-heat days projected 7→22/yr by 2055 (HVAC capex compounding) — expect insurance premiums to compound above CPI over the hold.
Questions for the listing agent
- It's been on market 114 days. Have you received any prior offers? Is the seller open to a 9% concession, seller financing, or rate buy-down credit?
- What does the HOA fee cover, when was the last increase, and are there any pending special assessments or reserve-fund shortfalls?
- Why hasn't it sold? Are there any deal-killer items the seller is aware of (foundation, flood, title, zoning, code violations)?
- Is there a deadline driving the sale (1031 exchange, divorce, estate, relocation)? That informs how much negotiation room exists.
- Crime grade is F in this area — have there been break-ins, vandalism, or insurance claims at this property in the last 3 years? What carrier currently insures it and at what premium?
- What's the average days-on-market for RENTAL listings here right now (not sales)? A rising rental-DOM trend means longer vacancies and softer asking-rent achievability than the comps imply.
- What's the recent tenant-quality profile in this submarket — average credit score on applications, eviction rate, late-payment / NSF rate, and stable-employment percentage? A property-management company in the area should have these aggregated.
- How much new for-sale + rental construction is in the pipeline within 1–3 miles? Heavy new supply typically softens prices + rents 12–24 months out; constrained supply supports both.
Investment metrics
- 1% rule
- 1.41% ✓
- Cap rate
- 11.33%
- Cash-on-cash
- 17.99%
- DSCR
- 1.80
- GRM
- 5.9
CMA / ARV
- ARV (median comp)
- $797,143
- List price
- $285,000
- Delta
- -64.25%
- Verdict
- UNDERPRICED
- Comps
- 20 within 1.0 mi
Show comp detail 12 sales within ~0.75 mi
| Address | Dist | Beds/Ba | Sqft | Sold | Price | $/sf | Match |
|---|---|---|---|---|---|---|---|
| 3412 Gonzales St #1 | 0.09mi | 3/2.5 (-1) | 1,800 (-6%) | 1mo | $865,000 | $481 | 75 |
| 502 Tillery St #1 | 0.37mi | 3/3.5 (-1) | 1,932 (+0%) | 16mo | $649,000 | $336 | 64 |
| 610 Allen St #1 | 0.24mi | 4/3.0 | 2,173 (+13%) | 3mo | $1,150,000 | $529 | 63 |
| 4709 Milburn Ln Unit A | 0.21mi | 3/2.5 (-1) | 1,762 (-8%) | 12mo | $695,000 | $394 | 57 |
| 3007 Garwood St #1 | 0.38mi | 4/4.0 | 2,081 (+8%) | 23mo | $1,075,000 | $517 | 48 |
| 505 Tillery St #4 | 0.35mi | 3/3.5 (-1) | 1,751 (-9%) | 22mo | $624,900 | $357 | 45 |
| 1100 Brass St #2 | 0.52mi | 3/3.5 (-1) | 1,656 (-14%) | 6mo | $663,888 | $401 | 43 |
| 1123 3/4 Gunter St #1 | 0.67mi | 4/3.0 | 2,108 (+10%) | 14mo | $899,900 | $427 | 40 |
| 2913 Govalle Ave Unit A | 0.65mi | 3/2.5 (-1) | 1,759 (-9%) | 13mo | $579,000 | $329 | 36 |
| 2912 Govalle Ave Unit A | 0.67mi | 3/2.5 (-1) | 1,654 (-14%) | 9mo | $705,000 | $426 | 29 |
| 1125 Tillery St Unit 3A | 0.72mi | 3/2.5 (-1) | 1,752 (-9%) | 19mo | $649,990 | $371 | 27 |
| 1125 Tillery St Unit 3B | 0.72mi | 3/2.5 (-1) | 1,752 (-9%) | 20mo | $699,000 | $399 | 26 |
Match score weights: distance 35% · size 25% · config 20% · recency 20%. Top-matched comps best support the ARV.
Projected returns pro-forma
-3.0% appreciation · 0.0% rent growth · sell at horizon
- IRR
- 6.1%
- Equity multiple
- 1.23×
- Total profit
- $18,309
- Equity at exit
- $42,494
- IRR
- 12.6%
- Equity multiple
- 1.86×
- Total profit
- $68,809
- Equity at exit
- $24,642
Cash invested: $79,800 (down + closing). Projections, not guarantees.
Landlord ↔ Tenant lean methodology
- Overall (STATE)
- 87 Strongly Landlord-Friendly
- State Texas
- 87 Strongly Landlord-Friendly · R+5
- County
- — inherits STATE
- City
- — inherits STATE
ZIP-level market 78702
- Rents YoY
- -0.1%
- Active inventory
- 312
- Price-to-rent
- 5.9×
Monthly cashflow live
- Estimated rent
- $4,020 high interval (Pro) →
- Mortgage (P&I)
- −$1,495
- Tax est. 1.5%
- −$356 /mo · $4,275/yr
- Insurance
- −$119
- HOA
- −$10
- Vacancy / Maint / Mgmt
- −$844
- Net cashflow
- $1,197
Break-even live
UW: 25.0% down · 7.5% · 30yr · 1.5% tax · 5.0% vac · 8.0% maint · 8.0% mgmt
Financing live
Cash to close
- Down payment
- $71,250
- Closing costs
- $8,550
- Reserves months
- —
- Total cash needed
- —
Loan-product check · same deal, 3 products live
Conventional
25% down · 7.5% · 30yr
- Down + closing
- —
- Monthly P&I
- —
- Monthly cashflow
- —
- DSCR
- —
- Eligible?
- —
Personal DTI + credit; lowest rate.
DSCR
20% down · 8.5% · 30yr
- Down + closing
- —
- Monthly P&I
- —
- Monthly cashflow
- —
- DSCR
- —
- Eligible?
- —
No personal income docs; deal must DSCR.
Hard money
10% down · 12.0% · 12mo
- Down + closing
- —
- Monthly P&I
- —
- Monthly cashflow
- —
- DSCR
- —
- Eligible?
- —
Short-term bridge; refi at stabilization.
Rent comps 33 comps
| Address | Beds | Baths | Sqft | Rent | $/sqft | DOM | Units | Dist |
|---|---|---|---|---|---|---|---|---|
| 732 Springdale Rd Unit A Austin, TX | 3.0 | 3.5 | 1966 | $4,750 | $2.42 | 24d | 1 | 0.03mi |
| 732 Springdale Rd Unit A Austin, TX | 3.0 | 3.5 | 1966 | $4,995 | $2.54 | 16d | 1 | 0.03mi |
| 3116 Prado St Unit 1 Austin, TX | 5.0 | 4.0 | 1833 | $7,500 | $4.09 | 13d | 1 | 0.31mi |
| 1011 Cherico St Austin, TX | 3.0 | 2.0 | 1680 | $3,500 | $2.08 | 44d | 1 | 0.38mi |
| 2905 Prado St Austin, TX | 3.0 | 2.0 | 2280 | $4,500 | $1.97 | 24d | 1 | 0.45mi |
| 3300 Neal St Unit B Austin, TX | 3.0 | 3.0 | 1872 | $4,000 | $2.14 | 24d | 1 | 0.48mi |
| 2808 Lyons Rd Unit A Austin, TX | 3.0 | 2.0 | 1722 | $2,100 | $1.22 | 4d | 1 | 0.53mi |
| 3014 Neal St Austin, TX | 4.0 | 2.5 | 1987 | $4,500 | $2.26 | 44d | 1 | 0.55mi |
| 1010 Springdale Rd Austin, TX | 3.0 | 1.0–3.0 | 1141 | $4,450 | $3.90 | 2d | 127 | 0.71mi |
| 2906 Webberville Rd #1 Austin, TX | 3.0 | 3.0 | 2032 | $5,350 | $2.63 | 44d | 1 | 0.73mi |
| 3708 Goodwin Ave Austin, TX | 3.0 | 2.0 | 1526 | $3,004 | $1.97 | 24d | 1 | 0.76mi |
| 1116 Walton Ln Austin, TX | 3.0 | 2.5 | 1420 | $3,250 | $2.29 | 4d | 1 | 0.76mi |
| 1143 Shady Ln Austin, TX | 3.0 | 1.0–2.0 | 924 | $1,745 | $1.89 | 44d | 4 | 0.77mi |
| 1136 Emmitt Run Austin, TX | 3.0 | 3.0 | 2047 | $2,723 | $1.33 | 24d | 1 | 0.93mi |
| 1050 Springdale Rd Austin, TX | 3.0 | 2.0–2.5 | 1163 | $1,350 | $1.16 | 3d | 5 | 1.01mi |
| 1153 Brookswood Ave Austin, TX | 3.0 | 2.0 | 1660 | $2,495 | $1.50 | 4d | 1 | 1.02mi |
| 4700 Prock Ln Unit B Austin, TX | 3.0 | 3.5 | 1365 | $3,200 | $2.34 | 44d | 1 | 1.04mi |
| 6103 Calmar Cv Austin, TX | 3.0 | 1.0 | 1940 | $2,100 | $1.08 | 24d | 1 | 1.04mi |
| 1187 Oakgrove Ave Austin, TX | 3.0 | 3.0 | 1915 | $5,600 | $2.92 | 4d | 1 | 1.17mi |
| 1107 Estes Ave Austin, TX | 3.0 | 2.5 | 1899 | $3,400 | $1.79 | 4d | 1 | 1.21mi |
| 1911 Hamilton Ave Austin, TX | 3.0 | 2.5 | 1800 | $4,999 | $2.78 | 15d | 1 | 1.25mi |
| 1902 E 8th St Austin, TX | 4.0 | 2.5 | 1876 | $8,900 | $4.74 | 4d | 1 | 1.27mi |
| 6106 Atwood St Unit A Austin, TX | 4.0 | 2.0 | 1447 | $2,250 | $1.55 | 24d | 1 | 1.27mi |
| 2013 E Cesar Chavez St Unit A Austin, TX | 3.0 | 2.0 | 1340 | $3,300 | $2.46 | 44d | 1 | 1.31mi |
| 1163 Alamo St Austin, TX | 3.0 | 2.0 | 1440 | $2,950 | $2.05 | 3d | 1 | 1.33mi |
| 120 Kimble Ln Unit B Austin, TX | 3.0 | 3.5 | 1574 | $2,400 | $1.52 | 3d | 1 | 1.34mi |
| 2902 E 13th St Austin, TX | 3.0 | 2.5 | 1824 | $3,400 | $1.86 | 2d | 1 | 1.36mi |
| 2924 E 13th St Austin, TX | 3.0 | 2.0 | 1552 | $3,895 | $2.51 | 24d | 1 | 1.36mi |
| 3607 Grant St Unit A Austin, TX | 3.0 | 3.0 | 1793 | $3,600 | $2.01 | 2d | 1 | 1.37mi |
| 4712 Reyes St #1 Austin, TX | 3.0 | 3.0 | 2216 | $4,250 | $1.92 | 24d | 1 | 1.37mi |
| 2921 E 14th St Austin, TX | 3.0 | 2.0 | 1472 | $3,300 | $2.24 | 15d | 1 | 1.40mi |
| 6405 Torres St Austin, TX | 3.0 | 2.0 | 1428 | $1,950 | $1.37 | 18d | 1 | 1.40mi |
| 2404 E 13th St Unit A Austin, TX | 4.0 | 2.5 | 1560 | $2,995 | $1.92 | 4d | 1 | 1.49mi |
HOA detail
- Monthly dues
- $10 · $120/yr
Listing history 13 events
-
2026-06-17days on market $285,000 Active 114 DOM
-
2026-06-16days on market $285,000 Active 113 DOM
-
2026-06-15days on market $285,000 Active 112 DOM
-
2026-06-13days on market $285,000 Active 110 DOM
-
2026-06-09days on market $285,000 Active 106 DOM
-
2026-06-08days on market $285,000 Active 105 DOM
-
2026-06-07days on market $285,000 Active 104 DOM
-
2026-06-05days on market $285,000 Active 101 DOM
-
2026-06-03days on market $285,000 Active 100 DOM
-
2026-06-02days on market $285,000 Active 99 DOM
-
2026-06-01days on market $285,000 Active 98 DOM
-
2026-05-31days on market $285,000 Active 97 DOM
-
2026-02-23$285,000 Active 938-char remark
Show marketing remark (938 chars)
Stunning modern 3-story home offering 4 bedrooms, a flex space, 3 full baths, and 1 half bath—thoughtfully designed for both comfort and style. The open-concept layout flows seamlessly into the living area, highlighted by beautiful windows that fill the home with natural light. Enjoy contemporary finishes, sleek modern appliances, and a sophisticated design throughout. The versatile floor plan includes a private bedroom on the first floor—ideal for guests, a home office, or multigenerational living. Step out onto the balcony for fresh air, or relax in the small, low-maintenance yard. A one-car garage adds convenience and additional storage. This home is part of the City of Austin Affordable Housing Program and is available to income-qualified buyers earning no more than 65% of the Median Family Income (MFI). Don’t miss this rare opportunity to own a modern, thoughtfully designed home at an attainable price.
ⓘ Source: listings_history table (triggers on properties + properties_extension) + one-shot
backfill from property_details.listing_events for pre-trigger history.
Climate risk First Street
- Flood 1/10 Low FEMA zone X (unshaded) · 0% chance over 30 yrs
- Wildfire 4/10 Moderate
- Heat 8/10 Severe 7 d/yr ≥108°F today · 22 d/yr by 30 yrs out
- Wind 8/10 Severe 80% chance of damaging wind over 30 yrs
- Air quality 2/10 Low 1 unhealthy d/yr today · 1 by 30 yrs out
Nearby sold comps map
Loading sold comps map…
Walkable amenities ~0.75 mi
Loading nearby amenities…
Taxation est. · year 1
- Rental income
- $48,244
- − Mortgage interest
- −$15,964
- − Property taxes
- −$4,275
- − Insurance
- −$1,425
- − Repairs & maintenance
- −$3,860
- − Management
- −$3,860
- − HOA
- −$120
- − Depreciation
- −$8,291
- Taxable income
- $10,450
- Est. tax owed @ 24.0%
- −$2,508
- After-tax cash flow
- $11,850/yr
For passive investors: Depreciation is non-cash, so a rental often shows a tax loss while cash-flowing — sheltering income. Rental losses are passive: they offset passive income freely, and up to $25,000/yr can offset ordinary (W-2) income if you actively participate and your MAGI is under $100k (phasing out to $0 by $150k); unused losses carry forward. On sale, claimed depreciation is recaptured at up to 25%, and gains may owe capital-gains tax (a 1031 exchange can defer both). Figures are a year-1 estimate at your 24.0% rate — not tax advice; consult a CPA.
Condition & rehab AI · 12 photos
This modern 3-story condo is in excellent condition with a good layout and contemporary finishes. It's move-in ready with minimal maintenance required.
Value-add opportunities
- Both Painting exterior siding — Enhances curb appeal and value
- Both Landscaping improvements — Enhances curb appeal and value
- Both Add smart home features — Improves convenience and marketability
Renovation cost estimate screening
Value-add ROI direction
- Both Painting exterior siding — Enhances curb appeal and value ↑
- Both Landscaping improvements — Enhances curb appeal and value ↑
- Both Add smart home features — Improves convenience and marketability ↑
ⓘ Cost ranges are severity-bucket heuristics (US national rule-of-thumb). Get contractor quotes + a written scope before underwriting a rehab budget.
Schools (NCES district)
- District
- Austin ISD
- NCES district ID
- 4808940
- Math proficiency
- 33% ▼ -19.00%
- Reading proficiency
- 44% ▼ -7.00%
- Median HH income
- $54,627
- Composite
- 33.65/100
- National rank
- #5397
- State rank
- #431 of 826 in TX
Livability — Austin
- Score
- 82/100
- State rank
- #16
- US rank
- #1208
Category grades
Schools grade is shown separately in the Schools card above.
Census & demographics
- Census place
- Austin, TX
- County
- Travis County · 1,299,254 people
- City population
- 1,066,854
- Metro
- Austin-Round Rock-Georgetown, TX
- Population (ZIP)
- 25,985
- Household income
- $102,171
- Rent vs Own
- Severe rent burden
- 1750.0
Population outlook (Travis County) Hauer SSP2
- Today (2025)
- 1,545,133 people
- By 2030
- 1,729,269 · +11.9%
- By 2040
- 2,097,596 · +35.8%
- By 2050
- 2,463,890 · +59.5%
- By 2075
- 3,249,374 · +110.3%
- By 2100
- 3,801,868 · +146.1%
Race, ethnicity, and origin ACS 2023
- Neighborhood character
- Diverse neighborhood (Simpson 0.64)
- Race & ethnicity
- White 49% Hispanic / Latino 32% Two or more races 14% Black 12% Asian 3%
- Hispanic origin (detail)
- Mexican 25%
- Common ancestry
- Romanian 2% Lithuanian 2% Slovak 2%
- Foreign-born
- 9% · Canada, South Korea
- Languages at home
- 78% English-only · Spanish 17% French/Haitian/Cajun 1% Other Indo-European 1%
Political lean MEDSL · Travis
- 2024 margin
- Solid D (+39.3) · D 68.8% · R 29.4% · Other 1.8%
- 2008→2024 swing
- +9.9pp toward D · 2008: 29.4pp · 2024: 39.3pp
- All cycles
- 2024: D+39.3 2020: D+45.0 2016: D+38.9 2012: D+23.9 2008: D+29.4
Not yet ingested
- Civics
- —
Market trends
- HPI YoY
- ▼ -394.53%
- Current HPI
- 295.5178
- Rent YoY
- ▼ -0.06%
- Metro
- Austin-Round Rock-Georgetown, TX
- State GDP YoY
- ▲ 3.95%
- F500 in state
- 110
Industry mix (Fortune 500 HQ in TX)
| Industry | F500 HQs | Revenue |
|---|---|---|
| Energy | 16 | $1,198B |
|
||
| Technology | 5 | $198B |
|
||
| Engineering / Construction | 4 | $72B |
|
||
| Energy Services | 3 | $60B |
|
||
| Utilities | 3 | $41B |
|
||
| Healthcare | 2 | $330B |
|
||
Price history
1 event — show timeline
- 2026-02-23 Listed $285,000 Unlock MLS
Cash-flow waterfall
monthlySold comps — $/sqft
last 12 mo · ≤1 miLoading sold comps…