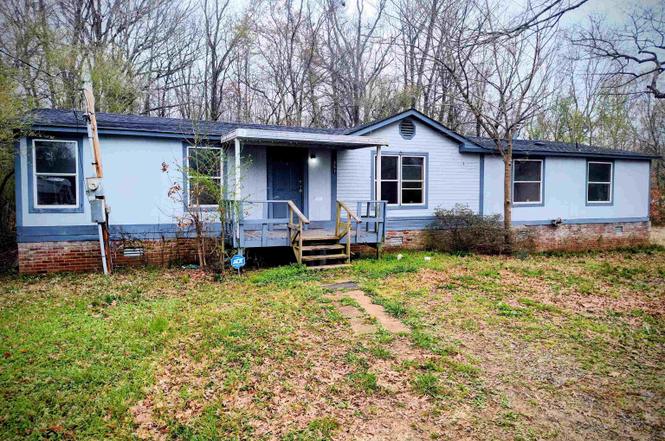
257 Bailey St · Higginson, AR
Flood risk 1/10 · Minimal
- FEMA flood zone
- X (unshaded)
- Chance of flooding over 30 yrs
- 0.0%
- Est. flood insurance / yr
- $507 – $1,088
Fire risk 4/10 · Minor
- Est. fire insurance / yr
- $1,499 – $2,785
Heat risk 5/10 · Moderate
- Hot days now (above 111°F)
- 6 days/yr
- Hot days in 30 yrs
- 16 days/yr
Wind risk 3/10 · Minor
- Chance of severe wind over 30 yrs
- 6.0%
Air-quality risk 1/10 · Minimal
- Unhealthy air days now
- 0 days/yr
- Unhealthy air days in 30 yrs
- 0 days/yr
Risk factors via First Street. Map © Google.
Why this score? — see what drove the C+ grade
The composite is a weighted blend of 9 inputs, each scored 0–100. Each bar is that input's sub-score; the figure is the points it added to the 100-point composite (weight × sub-score).
- Cash flow +25.5/30.0
- ARV discount +11.4/15.0
- DSCR +8.4/10.0
- 1% rule +5.5/10.0
- Schools +3.8/10.0
- Livability +3.6/5.0
- Rent growth +2.5/5.0
- Condition / age +2.5/5.0
- Appreciation +0.0/10.0
$114,900
🖨 Deal sheet (PDF) 📄 Offer letter ✓ Due diligence
Listing remarks
Looking for space and a little breathing room? This home sits on 1 acre and offers nearly 2,000 square feet with a layout that gives everyone room to spread out. Enjoy the luxury of the country with the convenience of town just minutes away. 1 ACRE + 1,900 SQ FT under $125K is hard to find. Recent updates include new paint, new flooring, and a brand new furnace, making it move-in ready. Inside features two living areas, generously sized bedrooms, and a large primary suite with an oversized bathroom and walk-in closet. Roof replaced in 2023. Storage shed conveys.
Key facts
- New furnace
- New flooring
- New paint
Tags
Property features AI
Exterior
- Parking: Parking for 4+ cars
- Utilities: Public sewer; Public water; Municipal electric (Entergy)
- Home design: Brick, metal/vinyl siding, masonite and wood exterior
- Construction: Architectural shingle roof; Crawl space foundation
- Exterior features: Level lot; Gravel road surface
Interior
- Kitchen: Free-standing stove; Electric range; Dishwasher; Refrigerator stays
- Flooring: Luxury vinyl
- Bathrooms: 2 full bathrooms
- Heating & cooling: Central electric heat; Central electric cooling
- Interior features: Luxury vinyl flooring; Gas-starter fireplace; Den/Family room
Neighborhood map
What this means for you Summary
Snapshot
- This is a 3-bed/2.0-bath manufactured listed at $115k.
Deal economics
- At list price, monthly cash flow is $267 ($3k/yr) — positive.
- The deal already cash-flows at list — no discount required.
- Meets the 1% rule at list price ($1k rent vs $115k).
- Recommended offer: $105k (9.0% below list) — sets the bar for market timing.
Location & tenants
- Location reads 71/100 on livability (#45 in AR) — a middle-class / working-renter tenant base. Strengths: crime A+, cost of living A+, health & safety A; Watch: schools F, amenities F, commute F.
- Searcy School District (town): math 47% / reading 43% proficiency, ranked #37 of 238 in AR (top 16%) — families likely to look elsewhere, expect single-tenant / working-renter base with shorter leases.
- Market conditions: 173 active listings in the ZIP; 219 units permitted in White County in 2024 (36 in 5+ unit buildings).
Forward outlook
- Local home prices are declining (-3.0%/yr); year-one equity from $794 of loan paydown is wiped out by about $3k of value loss. Plan a longer hold.
- White County population projected at +7% by 2050 — modest demand growth; plan on rents tracking national, not racing it.
Negotiation context
- It's been on market 100 days — a 9% lower offer ($105k) is reasonable based on typical stale-listing flexibility.
- Current owner paid $60k; list at $115k implies a 92% gain — meaningful room to come down on a strong offer.
Risks & watch-outs
- Climate carrying-cost: extreme-heat days projected 6→16/yr by 2055 (HVAC capex compounding) — expect insurance premiums to compound above CPI over the hold.
Questions for the listing agent
- It's been on market 100 days. Have you received any prior offers? Is the seller open to a 9% concession, seller financing, or rate buy-down credit?
- Why hasn't it sold? Are there any deal-killer items the seller is aware of (foundation, flood, title, zoning, code violations)?
- Is there a deadline driving the sale (1031 exchange, divorce, estate, relocation)? That informs how much negotiation room exists.
- Schools are F-rated, which usually means shorter tenancies and higher turnover. Who's the typical renter profile here, and what's been the actual vacancy rate?
- What's the average days-on-market for RENTAL listings here right now (not sales)? A rising rental-DOM trend means longer vacancies and softer asking-rent achievability than the comps imply.
- What's the recent tenant-quality profile in this submarket — average credit score on applications, eviction rate, late-payment / NSF rate, and stable-employment percentage? A property-management company in the area should have these aggregated.
- How much new for-sale + rental construction is in the pipeline within 1–3 miles? Heavy new supply typically softens prices + rents 12–24 months out; constrained supply supports both.
Investment metrics
- 1% rule
- 1.05% ✓
- Cap rate
- 9.08%
- Cash-on-cash
- 9.95%
- DSCR
- 1.44
- GRM
- 8.0
CMA / ARV
- ARV (on-the-fly)
- $125,664
- Comps found
- 1
Show comp detail 1 sale within ~0.75 mi
| Address | Dist | Beds/Ba | Sqft | Sold | Price | $/sf | Match |
|---|---|---|---|---|---|---|---|
| 106 Y St | 0.55mi | 4/2.0 (+1) | 1,650 (-13%) | 11mo | $109,000 | $66 | 38 |
Match score weights: distance 35% · size 25% · config 20% · recency 20%. Top-matched comps best support the ARV.
Projected returns pro-forma
-3.0% appreciation · 3.0% rent growth · sell at horizon
- IRR
- -1.4%
- Equity multiple
- 0.95×
- Total profit
- $-1,685
- Equity at exit
- $17,132
- IRR
- 8.3%
- Equity multiple
- 1.63×
- Total profit
- $20,200
- Equity at exit
- $9,934
Cash invested: $32,172 (down + closing). Projections, not guarantees.
Landlord ↔ Tenant lean methodology
- Overall (STATE)
- 92 Strongly Landlord-Friendly
- State Arkansas
- 92 Strongly Landlord-Friendly · R+14
- County
- — inherits STATE
- City
- — inherits STATE
ZIP-level market 72143
- Home prices YoY
- -28.4%
- Active inventory
- 173
- Price-to-rent
- 8.0×
Monthly cashflow live
- Estimated rent
- $1,203 medium interval (Pro) →
- Mortgage (P&I)
- −$603
- Tax from tax record
- −$33 /mo · $396/yr
- Insurance
- −$48
- HOA
- −$0
- Vacancy / Maint / Mgmt
- −$253
- Net cashflow
- $267
Break-even live
Sensitivity live
| Price | -10% $332 | -5% $299 | +0% $267 | +5% $234 | +10% $202 |
|---|---|---|---|---|---|
| Rent | -10% $172 | -5% $219 | +0% $267 | +5% $314 | +10% $362 |
| Rate | -1.0pp $325 | -0.5pp $296 | base $267 | +0.5pp $237 | +1.0pp $207 |
UW: 25.0% down · 7.5% · 30yr · 1.5% tax · 5.0% vac · 8.0% maint · 8.0% mgmt
Financing live
Cash to close
- Down payment
- $28,725
- Closing costs
- $3,447
- Reserves months
- —
- Total cash needed
- —
Loan-product check · same deal, 3 products live
Conventional
25% down · 7.5% · 30yr
- Down + closing
- —
- Monthly P&I
- —
- Monthly cashflow
- —
- DSCR
- —
- Eligible?
- —
Personal DTI + credit; lowest rate.
DSCR
20% down · 8.5% · 30yr
- Down + closing
- —
- Monthly P&I
- —
- Monthly cashflow
- —
- DSCR
- —
- Eligible?
- —
No personal income docs; deal must DSCR.
Hard money
10% down · 12.0% · 12mo
- Down + closing
- —
- Monthly P&I
- —
- Monthly cashflow
- —
- DSCR
- —
- Eligible?
- —
Short-term bridge; refi at stabilization.
Listing history 21 events
-
2026-06-18status $114,900 Under Contract 100 DOM
-
2026-06-18days on market $114,900 Take Backups 100 DOM
-
2026-06-17days on market $114,900 Take Backups 99 DOM
-
2026-06-16days on market $114,900 Take Backups 98 DOM
-
2026-06-15days on market $114,900 Take Backups 97 DOM
-
2026-06-14days on market $114,900 Take Backups 95 DOM
-
2026-06-12days on market $114,900 Take Backups 94 DOM
-
2026-06-09days on market $114,900 Take Backups 91 DOM
-
2026-06-08days on market $114,900 Take Backups 90 DOM
-
2026-06-07days on market $114,900 Take Backups 89 DOM
-
2026-06-05days on market $114,900 Take Backups 86 DOM
-
2026-06-03days on market $114,900 Take Backups 85 DOM
-
2026-06-02days on market $114,900 Take Backups 84 DOM
-
2026-06-01days on market $114,900 Take Backups 83 DOM
-
2026-05-31days on market $114,900 Take Backups 82 DOM
-
2026-05-30days on market $114,900 Take Backups 81 DOM
-
2026-04-10historical Take Backups
-
2026-03-28price $114,900
-
2026-03-10$124,999 New Listing
-
2024-04-22soldstatus $60,000
-
2007-04-02soldstatus $31,000
ⓘ Source: listings_history table (triggers on properties + properties_extension) + one-shot
backfill from property_details.listing_events for pre-trigger history.
Tax reassessment forecast AR · Resets to sale price
- Current annual tax
- $396 · $33/mo
- Projected year-2 tax
- $735 · $61/mo
- Expected delta
- +$340/yr (+$28/mo · 85.9%)
ⓘ Screening estimate from a state-policy table — verify with the county assessor before closing.
Climate risk First Street
- Flood 1/10 Low FEMA zone X (unshaded) · 0% chance over 30 yrs
- Wildfire 4/10 Moderate
- Heat 5/10 Major 6 d/yr ≥111°F today · 16 d/yr by 30 yrs out
- Wind 3/10 Moderate 6% chance of damaging wind over 30 yrs
- Air quality 1/10 Low 0 unhealthy d/yr today · 0 by 30 yrs out
Nearby sold comps map
Loading sold comps map…
Walkable amenities ~0.75 mi
Loading nearby amenities…
Taxation est. · year 1
- Rental income
- $14,431
- − Mortgage interest
- −$6,436
- − Property taxes
- −$396
- − Insurance
- −$574
- − Repairs & maintenance
- −$1,154
- − Management
- −$1,154
- − Depreciation
- −$3,343
- Taxable income
- $1,373
- Est. tax owed @ 24.0%
- −$330
- After-tax cash flow
- $2,870/yr
For passive investors: Depreciation is non-cash, so a rental often shows a tax loss while cash-flowing — sheltering income. Rental losses are passive: they offset passive income freely, and up to $25,000/yr can offset ordinary (W-2) income if you actively participate and your MAGI is under $100k (phasing out to $0 by $150k); unused losses carry forward. On sale, claimed depreciation is recaptured at up to 25%, and gains may owe capital-gains tax (a 1031 exchange can defer both). Figures are a year-1 estimate at your 24.0% rate — not tax advice; consult a CPA.
Schools (NCES district)
- District
- Searcy School District
- NCES district ID
- 0512210
- Math proficiency
- 47% ▼ -11.00%
- Reading proficiency
- 43% ▼ -10.00%
- Median HH income
- $44,318
- Composite
- 38.12/100
- National rank
- #4272
- State rank
- #37 of 238 in AR
Livability — Higginson
- Score
- 71/100
- State rank
- #45
- US rank
- #7145
Category grades
Schools grade is shown separately in the Schools card above.
Census & demographics
- County
- White County · 35,000 people
- Metro
- Searcy, AR
- Population (ZIP)
- 35,000
- Household income
- $58,344
- Rent vs Own
- Severe rent burden
- 804.0
Population outlook (White County) Hauer SSP2
- Today (2025)
- 82,310 people
- By 2030
- 83,861 · +1.9%
- By 2040
- 86,492 · +5.1%
- By 2050
- 88,246 · +7.2%
- By 2075
- 91,307 · +10.9%
- By 2100
- 91,548 · +11.2%
Race, ethnicity, and origin ACS 2023
- Neighborhood character
- Predominantly White (82%)
- Race & ethnicity
- White 82% Black 7% Hispanic / Latino 6% Two or more races 5%
- Hispanic origin (detail)
- Mexican 4%
- Common ancestry
- Italian 2% Slovak 1% Serbian 1%
- Foreign-born
- 2% · Canada
- Languages at home
- 95% English-only · Spanish 4%
Political lean MEDSL · White
- 2024 margin
- Solid R (+61.2) · D 18.3% · R 79.5% · Other 2.2%
- 2008→2024 swing
- -14.0pp toward R · 2008: -47.2pp · 2024: -61.2pp
- All cycles
- 2024: R+61.2 2020: R+58.9 2016: R+57.9 2012: R+53.7 2008: R+47.2
Not yet ingested
- Civics
- —
Market trends
- HPI YoY
- ▼ -81.60%
- Current HPI
- 206.0334
- Rent YoY
- —
- Metro
- Searcy, AR
- State GDP YoY
- ▲ 3.80%
- F500 in state
- 10
Industry mix (Fortune 500 HQ in AR)
| Industry | F500 HQs | Revenue |
|---|---|---|
| Retail | 1 | $681B |
|
||
| Food / Agriculture | 1 | $53B |
|
||
| Retail / Energy | 1 | $22B |
|
||
| Transportation / Logistics | 1 | $12B |
|
||
| Energy | 1 | $4B |
|
||
Price history
+270.6% since first listed5 events — show timeline
- 2026-04-10 Contingent — CARMLS
- 2026-03-28 Price Changed $114,900 CARMLS
- 2026-03-10 Listed $124,999 CARMLS
- 2024-04-22 Sold (Public Records) $60,000 Public Records
- 2007-04-02 Sold (Public Records) $31,000 Public Records
Property tax history
+0.6%/yrLatest (2024): $396 · +2.4% YoY. Source: county tax records.
Cash-flow waterfall
monthlySold comps — $/sqft
last 12 mo · ≤1 miLoading sold comps…