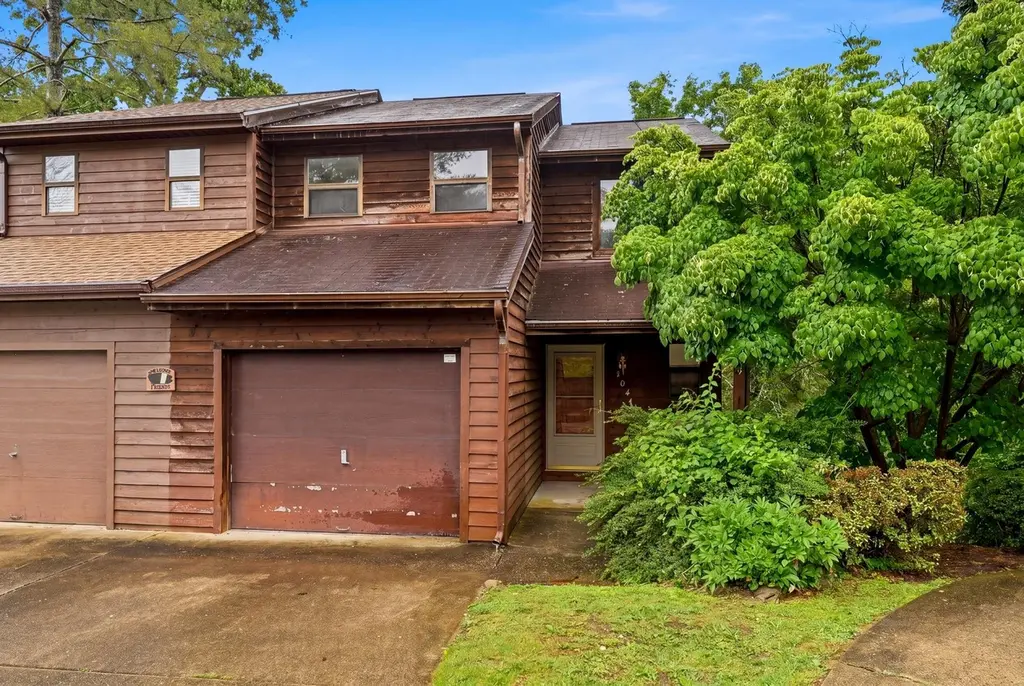
104 Stonewood Dr · Pea Ridge, WV
Flood risk 1/10 · Minimal
- FEMA flood zone
- X (unshaded)
- Chance of flooding over 30 yrs
- 0.0%
- Est. flood insurance / yr
- $507 – $1,088
Fire risk 3/10 · Minor
- Est. fire insurance / yr
- $787 – $1,461
Heat risk 4/10 · Minor
- Hot days now (above 103°F)
- 7 days/yr
- Hot days in 30 yrs
- 19 days/yr
Wind risk 2/10 · Minimal
- Chance of severe wind over 30 yrs
- 2.0%
Air-quality risk 1/10 · Minimal
- Unhealthy air days now
- 0 days/yr
- Unhealthy air days in 30 yrs
- 0 days/yr
Risk factors via First Street. Map © Google.
Why this score? — see what drove the C+ grade
The composite is a weighted blend of 9 inputs, each scored 0–100. Each bar is that input's sub-score; the figure is the points it added to the 100-point composite (weight × sub-score).
- Cash flow +22.3/30.0
- ARV discount +15.0/15.0
- DSCR +7.1/10.0
- 1% rule +4.9/10.0
- Livability +4.1/5.0
- Schools +3.0/10.0
- Rent growth +2.5/5.0
- Condition / age +2.5/5.0
- Appreciation +0.0/10.0
$130,000
🖨 Deal sheet 📄 Offer letter ✓ Due diligence
Listing remarks
You are going to love this amazing townhouse on East Pea Ridge. NO HOA and the convenience to shopping, restaurants, I-64 and more is just something you can't pass up. 3 bedrooms, 2 full baths, 2 half baths, screened in deck. You are going to love living here.
Key facts
- Screened in deck
- No hoa
- 3,485 sq ft lot
Tags
Property features AI
Exterior
- Parking: Attached garage with garage door opener; Off-street parking; 1 garage space
- Utilities: Public water; Public sewer
- Home design: Single family residence; 2-story
- Construction: Wood siding; Shingle roof; Basement
- Exterior features: Deck; Porch; Sloped lot
Interior
- Kitchen: Dishwasher; Range; Oven; Refrigerator
- Flooring: Carpet
- Bathrooms: 2 full bathrooms; 2 half bathrooms
- Heating & cooling: Central heating (electric); Central air conditioning; Ceiling fans
- Interior features: Storm windows; Partially finished basement with concrete floor and walk-out access
Neighborhood map
What this means for you Summary
Snapshot
- This is a 2-bed/3.0-bath single-family listed at $130k.
Deal economics
- At list price, monthly cash flow is $214 ($3k/yr) — positive.
- The deal already cash-flows at list — no discount required.
- To meet the 1% rule (rent ≥ 1% of price), the offer needs to be $129k (0.7% below list).
- Recommended offer: $129k (0.7% below list) — sets the bar for 1% rule.
- Cap rate 8.3% vs local median 4.4% in Pea Ridge — top-decile yield for the area; either an underpriced asset or a hidden risk that comps aren't pricing in. Stress-test before assuming the spread holds.
Location & tenants
- Location reads 82/100 on livability (#9 in WV, #1,254 nationally) — a professional / high-income tenant draw. Strengths: crime A+, cost of living A+, housing A+; Watch: employment D, commute F.
- Cabell County Schools (urban): math 31% / reading 42% proficiency, ranked #13 of 55 in WV (top 24%) — families likely to look elsewhere, expect single-tenant / working-renter base with shorter leases.
- Market conditions: 163 active listings in the ZIP; 61 units permitted in Cabell County in 2024 (5 in 5+ unit buildings).
Forward outlook
- Local home prices are declining (-3.0%/yr); year-one equity from $899 of loan paydown is wiped out by about $4k of value loss. Plan a longer hold.
Negotiation context
- Only 6 days on market — expect competitive offers; lowballing is unlikely to land.
Questions for the listing agent
- Is there a deadline driving the sale (1031 exchange, divorce, estate, relocation)? That informs how much negotiation room exists.
- Schools are B-rated — typically a magnet for longer-tenancy family renters. What's the average tenant stay here, and is there a school-zone premium baked into asking?
- What's the average days-on-market for RENTAL listings here right now (not sales)? A rising rental-DOM trend means longer vacancies and softer asking-rent achievability than the comps imply.
- What's the recent tenant-quality profile in this submarket — average credit score on applications, eviction rate, late-payment / NSF rate, and stable-employment percentage? A property-management company in the area should have these aggregated.
- How much new for-sale + rental construction is in the pipeline within 1–3 miles? Heavy new supply typically softens prices + rents 12–24 months out; constrained supply supports both.
Investment metrics
- 1% rule
- 0.99% ✗
- Cap rate
- 8.27%
- Cash-on-cash
- 7.05%
- DSCR
- 1.31
- GRM
- 8.4
CMA / ARV
- ARV (on-the-fly)
- $228,096
- Comps found
- 12
Show comp detail 12 sales within ~0.75 mi
| Address | Dist | Beds/Ba | Sqft | Sold | Price | $/sf | Match |
|---|---|---|---|---|---|---|---|
| 104 Stonewood Dr | 0.00mi | 3/3.0 (+1) | 1,584 (0%) | 0mo | $82,000 | $52 | 95 |
| 113 Stonewood Dr | 0.02mi | 2/3.0 | 1,545 (-2%) | 5mo | $223,000 | $144 | 90 |
| 1 Dogwood Place Pl | 0.45mi | 3/2.5 (+1) | 1,538 (-3%) | 1mo | $235,000 | $153 | 66 |
| 3 Sentiment Way, Suite A Way | 0.45mi | 3/2.0 (+1) | 1,554 (-2%) | 2mo | $362,000 | $233 | 65 |
| 5 Sentiment Way, C Way | 0.46mi | 3/2.0 (+1) | 1,530 (-3%) | 1mo | $366,000 | $239 | 63 |
| 743 East Pea Ridge Rd | 0.32mi | 3/2.0 (+1) | 1,640 (+4%) | 8mo | $279,000 | $170 | 63 |
| 4 Dogwood Pl | 0.47mi | 3/2.5 (+1) | 1,659 (+5%) | 7mo | $232,900 | $140 | 57 |
| 12 Crestridge Dr | 0.61mi | 3/2.5 (+1) | 1,612 (+2%) | 9mo | $210,000 | $130 | 54 |
| 8 Blakeney Rose Ln | 0.41mi | 3/2.0 (+1) | 1,393 (-12%) | 1mo | $202,000 | $145 | 51 |
| 3 Dogwood Pl | 0.47mi | 3/2.5 (+1) | 1,732 (+9%) | 11mo | $234,900 | $136 | 46 |
| 589 Fairwood Rd | 0.60mi | 3/2.0 (+1) | 1,772 (+12%) | 1mo | $237,000 | $134 | 43 |
| 125 Jefferson Park Dr | 0.52mi | 3/1.5 (+1) | 1,764 (+11%) | 9mo | $170,000 | $96 | 38 |
Match score weights: distance 35% · size 25% · config 20% · recency 20%. Top-matched comps best support the ARV.
Projected returns pro-forma
-3.0% appreciation · 3.0% rent growth · sell at horizon
- IRR
- -5.5%
- Equity multiple
- 0.79×
- Total profit
- $-7,477
- Equity at exit
- $19,383
- IRR
- 4.1%
- Equity multiple
- 1.30×
- Total profit
- $10,882
- Equity at exit
- $11,240
Cash invested: $36,400 (down + closing). Projections, not guarantees.
Landlord ↔ Tenant lean methodology
- Overall (STATE)
- 83 Strongly Landlord-Friendly
- State West Virginia
- 83 Strongly Landlord-Friendly · R+22
- County
- — inherits STATE
- City
- — inherits STATE
ZIP-level market 25705
- Home prices YoY
- -24.9%
- Active inventory
- 163
- Price-to-rent
- 8.4×
Monthly cashflow live
- Estimated rent
- $1,291 medium interval (Pro) →
- Mortgage (P&I)
- −$682
- Tax from tax record
- −$70 /mo · $839/yr
- Insurance
- −$54
- HOA
- −$0
- Vacancy / Maint / Mgmt
- −$271
- Net cashflow
- $214
Break-even live
UW: 25.0% down · 7.5% · 30yr · 1.5% tax · 5.0% vac · 8.0% maint · 8.0% mgmt
Financing live
Cash to close
- Down payment
- $32,500
- Closing costs
- $3,900
- Reserves months
- —
- Total cash needed
- —
Loan-product check · same deal, 3 products live
Conventional
25% down · 7.5% · 30yr
- Down + closing
- —
- Monthly P&I
- —
- Monthly cashflow
- —
- DSCR
- —
- Eligible?
- —
Personal DTI + credit; lowest rate.
DSCR
20% down · 8.5% · 30yr
- Down + closing
- —
- Monthly P&I
- —
- Monthly cashflow
- —
- DSCR
- —
- Eligible?
- —
No personal income docs; deal must DSCR.
Hard money
10% down · 12.0% · 12mo
- Down + closing
- —
- Monthly P&I
- —
- Monthly cashflow
- —
- DSCR
- —
- Eligible?
- —
Short-term bridge; refi at stabilization.
Listing history 5 events
-
2026-06-02status $130,000 Pending 6 DOM
-
2026-06-01days on market $130,000 Active 6 DOM
-
2026-05-31days on market $130,000 Active 5 DOM
-
2026-05-30days on market $130,000 Active 4 DOM
-
2026-05-26$130,000 Active
ⓘ Source: listings_history table (triggers on properties + properties_extension) + one-shot
backfill from property_details.listing_events for pre-trigger history.
Tax reassessment forecast WV · Resets to sale price
- Current annual tax
- $839 · $70/mo
- Projected year-2 tax
- $839 · $70/mo
- Expected delta
- $0/yr ($0/mo · 0.0%)
ⓘ Screening estimate from a state-policy table — verify with the county assessor before closing.
Climate risk First Street
- Flood 1/10 Low FEMA zone X (unshaded) · 0% chance over 30 yrs
- Wildfire 3/10 Moderate
- Heat 4/10 Moderate 7 d/yr ≥103°F today · 19 d/yr by 30 yrs out
- Wind 2/10 Low 2% chance of damaging wind over 30 yrs
- Air quality 1/10 Low 0 unhealthy d/yr today · 0 by 30 yrs out
Nearby sold comps map
Loading sold comps map…
Walkable amenities ~0.75 mi
Loading nearby amenities…
Taxation est. · year 1
- Rental income
- $15,490
- − Mortgage interest
- −$7,282
- − Property taxes
- −$839
- − Insurance
- −$650
- − Repairs & maintenance
- −$1,239
- − Management
- −$1,239
- − Depreciation
- −$3,782
- Taxable income
- $459
- Est. tax owed @ 24.0%
- −$110
- After-tax cash flow
- $2,457/yr
For passive investors: Depreciation is non-cash, so a rental often shows a tax loss while cash-flowing — sheltering income. Rental losses are passive: they offset passive income freely, and up to $25,000/yr can offset ordinary (W-2) income if you actively participate and your MAGI is under $100k (phasing out to $0 by $150k); unused losses carry forward. On sale, claimed depreciation is recaptured at up to 25%, and gains may owe capital-gains tax (a 1031 exchange can defer both). Figures are a year-1 estimate at your 24.0% rate — not tax advice; consult a CPA.
Schools (NCES district)
- District
- Cabell County Schools
- NCES district ID
- 5400180
- Math proficiency
- 31% ▼ -7.00%
- Reading proficiency
- 42% ▼ -6.00%
- Median HH income
- $36,426
- Composite
- 30.26/100
- National rank
- #6285
- State rank
- #13 of 55 in WV
Livability — Pea Ridge
- Score
- 82/100
- State rank
- #9
- US rank
- #1254
Category grades
Schools grade is shown separately in the Schools card above.
Census & demographics
- Census place
- Pea Ridge, WV
- Population (ZIP)
- 20,668
Population outlook (Cabell County) Hauer SSP2
- Today (2025)
- 97,574 people
- By 2030
- 98,060 · +0.5%
- By 2040
- 98,817 · +1.3%
- By 2050
- 100,185 · +2.7%
- By 2075
- 105,895 · +8.5%
- By 2100
- 105,948 · +8.6%
Race, ethnicity, and origin ACS 2023
- Neighborhood character
- Predominantly White (89%)
- Race & ethnicity
- White 89% Black 5% Two or more races 4% Hispanic / Latino 2% Asian 1%
- Common ancestry
- Slovak 3% Serbian 2% Lithuanian 2%
- Foreign-born
- 2%
- Languages at home
- 97% English-only · Spanish 1%
Political lean MEDSL · Cabell
- 2024 margin
- Strong R (+21.9) · D 38.0% · R 59.9% · Other 2.0%
- 2008→2024 swing
- -11.8pp toward R · 2008: -10.1pp · 2024: -21.9pp
- All cycles
- 2024: R+21.9 2020: R+18.0 2016: R+25.5 2012: R+13.9 2008: R+10.1
Not yet ingested
- Civics
- —
Market trends
- HPI YoY
- ▼ -57.08%
- Current HPI
- 171.7797
- Rent YoY
- —
- Metro
- —
- State GDP YoY
- —
- F500 in state
- 0
Price history
1 event — show timeline
- 2026-05-26 Listed $130,000 HBRMLS
Property tax history
+1.0%/yrLatest (2025): $839 · +7.0% YoY. Source: county tax records.
Cash-flow waterfall
monthlySold comps — $/sqft
last 12 mo · ≤1 miLoading sold comps…