255/275 Lee Johnson Ln · Dawson Springs, KY
Flood risk 1/10 · Minimal
- FEMA flood zone
- X (unshaded)
- Chance of flooding over 30 yrs
- 0.0%
- Est. flood insurance / yr
- $507 – $1,088
Fire risk 4/10 · Minor
- Est. fire insurance / yr
- $839 – $1,559
Heat risk 4/10 · Minor
- Hot days now (above 108°F)
- 7 days/yr
- Hot days in 30 yrs
- 19 days/yr
Wind risk 2/10 · Minimal
- Chance of severe wind over 30 yrs
- 4.0%
Air-quality risk 2/10 · Minimal
- Unhealthy air days now
- 0 days/yr
- Unhealthy air days in 30 yrs
- 1 days/yr
Risk factors via First Street. Map © Google.
Why this score? — see what drove the C- grade
The composite is a weighted blend of 9 inputs, each scored 0–100. Each bar is that input's sub-score; the figure is the points it added to the 100-point composite (weight × sub-score).
- Cash flow +19.0/30.0
- ARV discount +7.5/15.0
- DSCR +6.0/10.0
- 1% rule +4.8/10.0
- Livability +3.4/5.0
- Schools +3.0/10.0
- Rent growth +2.5/5.0
- Condition / age +2.5/5.0
- Appreciation +1.6/10.0
$120,000
🖨 Deal sheet 📄 Offer letter ✓ Due diligence
Listing remarks MLS
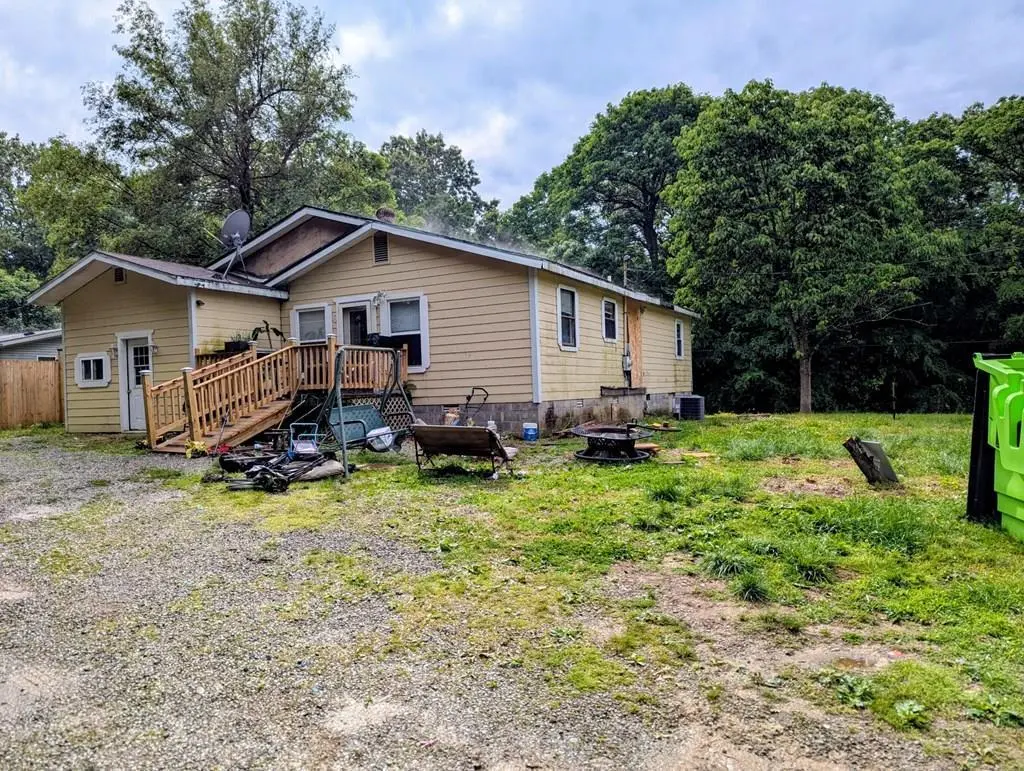
There are two homes located on this property. Buyer will purchase both for one price. Both homes have had a lot of remodeling which includes new laminate flooring, windows, kitchen cabinets, bathroom fixtures, drywall, paint, but has not yet been completed. Seller will sell as is or if buyer would like to complete the work, seller will adjust purchase price accordingly. This property gives the opportunity to occupy one home and rent the other or provide as a guest house. Possible owner financing with down payment. Main Home is 1226 sq ft, smaller home is 816 sq ft. To schedule a showing, contact Donnie Howton at 270-875-2932 today!
Key facts
- 2 acre lot
- Built 1990
- Listed 43 days
Property features AI
Exterior
- Parking: Gravel parking
- Home design: Single-family residence; Residential property
- Construction: Vinyl siding; Asphalt roof
- Exterior features: Wood fencing; Outbuilding on the property
Interior
- Bedrooms: Three bedrooms on the main level
- Bathrooms: Two full bathrooms on the main level
- Heating & cooling: Central air conditioning
- Interior features: Main-level laundry
- Laundry & utility: Laundry located on the main level
Neighborhood map
What this means for you Summary
Snapshot
- This is a 3-bed/2.0-bath single-family listed at $120k.
Deal economics
- At list price, monthly cash flow is $126 ($2k/yr) — positive.
- The deal already cash-flows at list — no discount required.
- To meet the 1% rule (rent ≥ 1% of price), the offer needs to be $117k (2.3% below list).
- Recommended offer: $116k (3.0% below list) — sets the bar for market timing.
Location & tenants
- Location reads 67/100 on livability (#207 in KY) — a middle-class / working-renter tenant base. Strengths: crime A+, cost of living A+, housing A+; Watch: schools D, amenities F, commute F.
- Hopkins County (town): math 27% / reading 43% proficiency, ranked #65 of 165 in KY (top 39%) — families likely to look elsewhere, expect single-tenant / working-renter base with shorter leases.
- Market conditions: 30 active listings in the ZIP; 122 units permitted in Hopkins County in 2024 (0 in 5+ unit buildings).
Forward outlook
- Local home prices are declining (-3.0%/yr); year-one equity from $830 of loan paydown is wiped out by about $4k of value loss. Plan a longer hold.
- Hopkins County population projected at -13% by 2050 — secular population decline; favor cash flow + early exit over multi-decade hold.
Negotiation context
- It's been on market 44 days — a 3% lower offer ($116k) is reasonable based on typical stale-listing flexibility.
Questions for the listing agent
- It's been on market 44 days. Have you received any prior offers? Is the seller open to a 3% concession, seller financing, or rate buy-down credit?
- Is there a deadline driving the sale (1031 exchange, divorce, estate, relocation)? That informs how much negotiation room exists.
- Schools are D-rated, which usually means shorter tenancies and higher turnover. Who's the typical renter profile here, and what's been the actual vacancy rate?
- What's the average days-on-market for RENTAL listings here right now (not sales)? A rising rental-DOM trend means longer vacancies and softer asking-rent achievability than the comps imply.
- What's the recent tenant-quality profile in this submarket — average credit score on applications, eviction rate, late-payment / NSF rate, and stable-employment percentage? A property-management company in the area should have these aggregated.
- How much new for-sale + rental construction is in the pipeline within 1–3 miles? Heavy new supply typically softens prices + rents 12–24 months out; constrained supply supports both.
Investment metrics
- 1% rule
- 0.98% ✗
- Cap rate
- 7.55%
- Cash-on-cash
- 4.49%
- DSCR
- 1.20
- GRM
- 8.5
CMA / ARV
No comps found within radius.
Projected returns pro-forma
-3.0% appreciation · 3.0% rent growth · sell at horizon
- IRR
- -9.3%
- Equity multiple
- 0.66×
- Total profit
- $-11,442
- Equity at exit
- $17,892
- IRR
- 0.1%
- Equity multiple
- 1.01×
- Total profit
- $343
- Equity at exit
- $10,375
Cash invested: $33,600 (down + closing). Projections, not guarantees.
Landlord ↔ Tenant lean methodology
- Overall (STATE)
- 83 Strongly Landlord-Friendly
- State Kentucky
- 83 Strongly Landlord-Friendly · R+16
- County
- — inherits STATE
- City
- — inherits STATE
ZIP-level market 42408
- Home prices YoY
- -2.7%
- Active inventory
- 30
- Price-to-rent
- 8.5×
Monthly cashflow live
- Estimated rent
- $1,172 medium interval (Pro) →
- Mortgage (P&I)
- −$629
- Tax from tax record
- −$121 /mo · $1,452/yr
- Insurance
- −$50
- HOA
- −$0
- Vacancy / Maint / Mgmt
- −$246
- Net cashflow
- $126
Break-even live
UW: 25.0% down · 7.5% · 30yr · 1.5% tax · 5.0% vac · 8.0% maint · 8.0% mgmt
Financing live
Cash to close
- Down payment
- $30,000
- Closing costs
- $3,600
- Reserves months
- —
- Total cash needed
- —
Loan-product check · same deal, 3 products live
Conventional
25% down · 7.5% · 30yr
- Down + closing
- —
- Monthly P&I
- —
- Monthly cashflow
- —
- DSCR
- —
- Eligible?
- —
Personal DTI + credit; lowest rate.
DSCR
20% down · 8.5% · 30yr
- Down + closing
- —
- Monthly P&I
- —
- Monthly cashflow
- —
- DSCR
- —
- Eligible?
- —
No personal income docs; deal must DSCR.
Hard money
10% down · 12.0% · 12mo
- Down + closing
- —
- Monthly P&I
- —
- Monthly cashflow
- —
- DSCR
- —
- Eligible?
- —
Short-term bridge; refi at stabilization.
Listing history 19 events
-
2026-06-18days on market $120,000 Active 44 DOM
-
2026-06-17days on market $120,000 Active 43 DOM
-
2026-06-16days on market $120,000 Active 42 DOM
-
2026-06-15days on market $120,000 Active 41 DOM
-
2026-06-13days on market $120,000 Active 39 DOM
-
2026-06-12days on market $120,000 Active 38 DOM
-
2026-06-09pricedays on market $120,000 Active 35 DOM
-
2026-06-08days on market $129,000 Active 34 DOM
-
2026-06-07days on market $129,000 Active 33 DOM
-
2026-06-07days on market $129,000 Active 32 DOM
-
2026-06-04days on market $129,000 Active 29 DOM
-
2026-06-02days on market $129,000 Active 28 DOM
-
2026-06-01days on market $129,000 Active 27 DOM
-
2026-05-31days on market $129,000 Active 26 DOM
-
2026-05-31days on market $129,000 Active 25 DOM
-
2026-05-05$129,000 Active
-
2024-10-25soldstatus $138,670
-
2022-06-14soldstatus $165,000
-
2022-06-13soldstatus $165,000 639-char remark
Show marketing remark (639 chars)
There are two homes located on this property. Buyer will purchase both for one price. Both homes have had a lot of remodeling which includes new laminate flooring, windows, kitchen cabinets, bathroom fixtures, drywall, paint, but has not yet been completed. Seller will sell as is or if buyer would like to complete the work, seller will adjust purchase price accordingly. This property gives the opportunity to occupy one home and rent the other or provide as a guest house. Possible owner financing with down payment. Main Home is 1226 sq ft, smaller home is 816 sq ft. To schedule a showing, contact Donnie Howton at 270-875-2932 today!
ⓘ Source: listings_history table (triggers on properties + properties_extension) + one-shot
backfill from property_details.listing_events for pre-trigger history.
Tax reassessment forecast KY · Resets to sale price
- Current annual tax
- $1,452 · $121/mo
- Projected year-2 tax
- $1,452 · $121/mo
- Expected delta
- $0/yr ($0/mo · 0.0%)
ⓘ Screening estimate from a state-policy table — verify with the county assessor before closing.
Climate risk First Street
- Flood 1/10 Low FEMA zone X (unshaded) · 0% chance over 30 yrs
- Wildfire 4/10 Moderate
- Heat 4/10 Moderate 7 d/yr ≥108°F today · 19 d/yr by 30 yrs out
- Wind 2/10 Low 4% chance of damaging wind over 30 yrs
- Air quality 2/10 Low 0 unhealthy d/yr today · 1 by 30 yrs out
Nearby sold comps map
Loading sold comps map…
Walkable amenities ~0.75 mi
Loading nearby amenities…
Taxation est. · year 1
- Rental income
- $14,065
- − Mortgage interest
- −$6,722
- − Property taxes
- −$1,452
- − Insurance
- −$600
- − Repairs & maintenance
- −$1,125
- − Management
- −$1,125
- − Depreciation
- −$3,491
- Taxable loss
- −$450
- Est. tax savings @ 24.0%
- +$108
- After-tax cash flow
- $1,616/yr
For passive investors: Depreciation is non-cash, so a rental often shows a tax loss while cash-flowing — sheltering income. Rental losses are passive: they offset passive income freely, and up to $25,000/yr can offset ordinary (W-2) income if you actively participate and your MAGI is under $100k (phasing out to $0 by $150k); unused losses carry forward. On sale, claimed depreciation is recaptured at up to 25%, and gains may owe capital-gains tax (a 1031 exchange can defer both). Figures are a year-1 estimate at your 24.0% rate — not tax advice; consult a CPA.
Schools (NCES district)
- District
- Hopkins County
- NCES district ID
- 2102860
- Math proficiency
- 27% ▼ -23.00%
- Reading proficiency
- 43% ▼ -17.00%
- Median HH income
- $42,436
- Composite
- 29.56/100
- National rank
- #6488
- State rank
- #65 of 165 in KY
Livability — Dawson Springs
- Score
- 67/100
- State rank
- #207
- US rank
- #10195
Category grades
Schools grade is shown separately in the Schools card above.
Census & demographics
- City population
- 6,167
- Population (ZIP)
- 6,167
Population outlook (Hopkins County) Hauer SSP2
- Today (2025)
- 45,164 people
- By 2030
- 44,083 · -2.4%
- By 2040
- 41,650 · -7.8%
- By 2050
- 39,303 · -13.0%
- By 2075
- 34,567 · -23.5%
- By 2100
- 29,476 · -34.7%
Race, ethnicity, and origin ACS 2023
- Neighborhood character
- Predominantly White (98%)
- Race & ethnicity
- White 98% Hispanic / Latino 1%
- Common ancestry
- Serbian 5% Lithuanian 4% Italian 2%
- Foreign-born
- 0%
Political lean MEDSL · Hopkins
- 2024 margin
- Solid R (+50.9) · D 23.9% · R 74.8% · Other 1.2%
- 2008→2024 swing
- -26.0pp toward R · 2008: -24.9pp · 2024: -50.9pp
- All cycles
- 2024: R+50.9 2020: R+48.0 2016: R+54.0 2012: R+39.9 2008: R+24.9
Not yet ingested
- Civics
- —
Market trends
- HPI YoY
- ▼ -6.70%
- Current HPI
- 240.3026
- Rent YoY
- —
- Metro
- —
- State GDP YoY
- ▲ 1.81%
- F500 in state
- 4
Industry mix (Fortune 500 HQ in KY)
| Industry | F500 HQs | Revenue |
|---|---|---|
| Healthcare | 1 | $118B |
|
||
| Food / Beverage | 1 | $7B |
|
||
Price history
-21.8% since first listed4 events — show timeline
- 2026-05-05 Listed $129,000 MHCBOR
- 2024-10-25 Sold (Public Records) $138,670 Public Records
- 2022-06-14 Sold (Public Records) $165,000 Public Records
- 2022-06-13 Sold (MLS) $165,000 MHCBOR
Property tax history
+26.0%/yrLatest (2025): $1,452 · -15.3% YoY. Source: county tax records.
Cash-flow waterfall
monthlySold comps — $/sqft
last 12 mo · ≤1 miLoading sold comps…