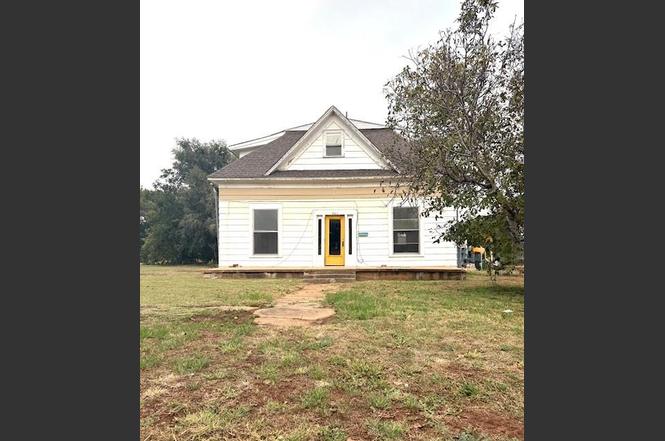
421 S Linwood St · New Cordell, OK
Flood risk 1/10 · Minimal
- FEMA flood zone
- X (unshaded)
- Chance of flooding over 30 yrs
- 0.0%
- Est. flood insurance / yr
- $507 – $1,088
Fire risk 1/10 · Minimal
- Est. fire insurance / yr
- $2,463 – $4,575
Heat risk 6/10 · Moderate
- Hot days now (above 107°F)
- 7 days/yr
- Hot days in 30 yrs
- 19 days/yr
Wind risk 2/10 · Minimal
- Chance of severe wind over 30 yrs
- 3.0%
Air-quality risk 1/10 · Minimal
- Unhealthy air days now
- 0 days/yr
- Unhealthy air days in 30 yrs
- 0 days/yr
Risk factors via First Street. Map © Google.
Why this score? — see what drove the B grade
The composite is a weighted blend of 9 inputs, each scored 0–100. Each bar is that input's sub-score; the figure is the points it added to the 100-point composite (weight × sub-score).
- Cash flow +30.0/30.0
- 1% rule +10.0/10.0
- DSCR +10.0/10.0
- ARV discount +7.5/15.0
- Appreciation +3.3/10.0
- Schools +3.0/10.0
- Livability +3.0/5.0
- Rent growth +2.5/5.0
- Condition / age +2.5/5.0
$45,000
🖨 Deal sheet 📄 Offer letter ✓ Due diligence
Listing remarks
This spacious property is filled with potential and packed with extras! Bring your tools and creative ideas — the possibilities here are endless. Inside, you’ll find a large living room with charming craftsman-style detailing, beautiful vintage door hardware, and oversized bathrooms. Renovations are already underway, with updates to electrical and plumbing systems completed in several areas. Multiple bonus rooms provide flexibility for offices, hobbies, or guest space, and a huge loft with an elevator/pulley lift sits above the garage — a rare and unique feature. Outside, you’ll enjoy an almond tree, an additional storage building, and plenty of space to design the o
Key facts
- Updates to plumbing
- Multiple bonus rooms
- Oversized bathrooms
Tags
Property features AI
Finance
- Other: Living area listed as 2,792 (assessor source); Directions: From Cordell's Historic Downtown Courthouse Square go east on Hwy 152 to Linwood Street and turn south to 421
- Financial info: Listing offered As Is; financing options include Cash and Conventional; Assumable: No
- HOA & community: No mandatory association dues
Exterior
- Parking: 3-car garage
- Utilities: Public utilities
- Home design: Two-level single family residence; Residential property; Existing property
- Construction: Composition roof; Other construction materials; Conventional foundation; Built (existing)
- Exterior features: Open patio; Outbuildings; Rain gutters; Workshop; Below-ground storm shelter; Corner lot
Interior
- Bedrooms: 5 bedrooms; Bonus room and optional bedroom/optional living area available
- Flooring: Combination flooring
- Bathrooms: 3 full bathrooms
- Heating & cooling: Central gas heating
- Interior features: Combination flooring throughout; Elevator/Lift; Garage door lift
- Laundry & utility: Inside utility
Neighborhood map
What this means for you Summary
Snapshot
- This is a 5-bed/4.0-bath single-family listed at $45k.
Deal economics
- At list price, monthly cash flow is $735 ($9k/yr) — positive.
- The deal already cash-flows at list — no discount required.
- Meets the 1% rule at list price ($1k rent vs $45k).
- Recommended offer: $40k (12.0% below list) — sets the bar for market timing.
- Cap rate 25.9% vs local median 6.6% in New Cordell — top-decile yield for the area; either an underpriced asset or a hidden risk that comps aren't pricing in. Stress-test before assuming the spread holds.
Location & tenants
- Location reads 60/100 on livability (#335 in OK) — a middle-class / working-renter tenant base. Strengths: cost of living A+, housing A+, crime A-; Watch: employment D+, amenities F, commute F.
- Cordell (town): math 37% / reading 33% proficiency, ranked #33 of 270 in OK (top 12%) — families likely to look elsewhere, expect single-tenant / working-renter base with shorter leases.
- Zoned schools: Cordell Es (math 42% / reading 37%, grade F, #107 of 845 statewide, top 14%, 358 students, 0% FRL); Cordell Hs (math 24% / reading 44%, grade F, #48 of 447 statewide, top 14%, 104 students, 0% FRL) — zoned schools average 0% FRL vs 52% district-wide (52 pts lower); this property's tenant base skews higher-income than the district average.
- Market conditions: 38 active listings in the ZIP; 1 units permitted in Washita County in 2024 (0 in 5+ unit buildings).
Forward outlook
- Local home prices are declining (-3.0%/yr); year-one equity from $311 of loan paydown is wiped out by about $1k of value loss. Plan a longer hold.
- Washita County population projected at +5% by 2050 — modest demand growth; plan on rents tracking national, not racing it.
- At projected returns (-3.0% appreciation + 3.0% rent growth), your $13k cash investment doubles in ~2 years — after that, you're playing with house money.
Negotiation context
- It's been on market 232 days — a 12% lower offer ($40k) is reasonable based on typical stale-listing flexibility.
- 2 sale attempts since 12y ago; this cycle's ask has dropped $20k (31%) from the opening price — seller is motivated, your offer sets the floor, not the list.
Risks & watch-outs
- Watch-outs: built in 1901 — expect roof / HVAC / electrical / plumbing capex.
- Climate carrying-cost: extreme-heat days projected 7→19/yr by 2055 (HVAC capex compounding) — expect insurance premiums to compound above CPI over the hold.
Questions for the listing agent
- It's been on market 232 days. Have you received any prior offers? Is the seller open to a 12% concession, seller financing, or rate buy-down credit?
- Built in 1901 — when were the roof, HVAC, electrical panel, plumbing, and water heater last replaced?
- Why hasn't it sold? Are there any deal-killer items the seller is aware of (foundation, flood, title, zoning, code violations)?
- Is there a deadline driving the sale (1031 exchange, divorce, estate, relocation)? That informs how much negotiation room exists.
- Schools are D-rated, which usually means shorter tenancies and higher turnover. Who's the typical renter profile here, and what's been the actual vacancy rate?
- What's the average days-on-market for RENTAL listings here right now (not sales)? A rising rental-DOM trend means longer vacancies and softer asking-rent achievability than the comps imply.
- What's the recent tenant-quality profile in this submarket — average credit score on applications, eviction rate, late-payment / NSF rate, and stable-employment percentage? A property-management company in the area should have these aggregated.
- How much new for-sale + rental construction is in the pipeline within 1–3 miles? Heavy new supply typically softens prices + rents 12–24 months out; constrained supply supports both.
Investment metrics
- 1% rule
- 2.93% ✓
- Cap rate
- 25.89%
- Cash-on-cash
- 69.99%
- DSCR
- 4.11
- GRM
- 2.8
CMA / ARV
- ARV (on-the-fly)
- $234,528
- Comps found
- 5
Show comp detail 5 sales within ~0.75 mi
| Address | Dist | Beds/Ba | Sqft | Sold | Price | $/sf | Match |
|---|---|---|---|---|---|---|---|
| 502 E Cavalry St | 0.08mi | 4/2.0 (-1) | 2,848 (+2%) | 11mo | $70,000 | $25 | 70 |
| 303 N Cordell Ave | 0.45mi | 4/2.5 (-1) | 2,543 (-9%) | 16mo | $168,000 | $66 | 40 |
| 1 Holly Dr | 0.68mi | 4/4.0 (-1) | 3,065 (+10%) | 9mo | $425,000 | $139 | 40 |
| 620 N College St | 0.74mi | 5/2.5 | 2,734 (-2%) | 20mo | $230,000 | $84 | 39 |
| 605 N College St | 0.71mi | 4/3.5 (-1) | 2,407 (-14%) | 6mo | $270,000 | $112 | 32 |
Match score weights: distance 35% · size 25% · config 20% · recency 20%. Top-matched comps best support the ARV.
Projected returns pro-forma
-3.0% appreciation · 3.0% rent growth · sell at horizon
- IRR
- 69.5%
- Equity multiple
- 4.14×
- Total profit
- $39,534
- Equity at exit
- $6,710
- IRR
- 73.6%
- Equity multiple
- 8.52×
- Total profit
- $94,768
- Equity at exit
- $3,891
Cash invested: $12,600 (down + closing). Projections, not guarantees.
Landlord ↔ Tenant lean methodology
- Overall (STATE)
- 83 Strongly Landlord-Friendly
- State Oklahoma
- 83 Strongly Landlord-Friendly · R+20
- County
- — inherits STATE
- City
- — inherits STATE
ZIP-level market 73632
- Home prices YoY
- -1.6%
- Active inventory
- 38
- Price-to-rent
- 2.8×
Monthly cashflow live
- Estimated rent
- $1,318 medium interval (Pro) →
- Mortgage (P&I)
- −$236
- Tax from tax record
- −$52 /mo · $619/yr
- Insurance
- −$19
- HOA
- −$0
- Vacancy / Maint / Mgmt
- −$277
- Net cashflow
- $735
Break-even live
UW: 25.0% down · 7.5% · 30yr · 1.5% tax · 5.0% vac · 8.0% maint · 8.0% mgmt
Financing live
Cash to close
- Down payment
- $11,250
- Closing costs
- $1,350
- Reserves months
- —
- Total cash needed
- —
Loan-product check · same deal, 3 products live
Conventional
25% down · 7.5% · 30yr
- Down + closing
- —
- Monthly P&I
- —
- Monthly cashflow
- —
- DSCR
- —
- Eligible?
- —
Personal DTI + credit; lowest rate.
DSCR
20% down · 8.5% · 30yr
- Down + closing
- —
- Monthly P&I
- —
- Monthly cashflow
- —
- DSCR
- —
- Eligible?
- —
No personal income docs; deal must DSCR.
Hard money
10% down · 12.0% · 12mo
- Down + closing
- —
- Monthly P&I
- —
- Monthly cashflow
- —
- DSCR
- —
- Eligible?
- —
Short-term bridge; refi at stabilization.
Listing history 19 events
-
2026-06-17status $45,000 Pending 232 DOM
-
2026-06-16days on market $45,000 Active 232 DOM
-
2026-06-15days on market $45,000 Active 231 DOM
-
2026-06-13days on market $45,000 Active 229 DOM
-
2026-06-12days on market $45,000 Active 228 DOM
-
2026-06-09days on market $45,000 Active 225 DOM
-
2026-06-08days on market $45,000 Active 224 DOM
-
2026-06-08days on market $45,000 Active 223 DOM
-
2026-06-07days on market $45,000 Active 222 DOM
-
2026-06-04days on market $45,000 Active 219 DOM
-
2026-06-02days on market $45,000 Active 218 DOM
-
2026-06-01days on market $45,000 Active 217 DOM
-
2026-05-31days on market $45,000 Active 216 DOM
-
2026-05-01price $45,000
-
2025-12-22price $60,000
-
2025-10-27$65,000 Active
-
2015-06-23historical
-
2014-06-24$127,500
-
2010-07-01soldstatus $54,500
ⓘ Source: listings_history table (triggers on properties + properties_extension) + one-shot
backfill from property_details.listing_events for pre-trigger history.
Tax reassessment forecast OK · Resets to sale price
- Current annual tax
- $619 · $52/mo
- Projected year-2 tax
- $619 · $52/mo
- Expected delta
- $0/yr ($0/mo · 0.0%)
ⓘ Screening estimate from a state-policy table — verify with the county assessor before closing.
Climate risk First Street
- Flood 1/10 Low FEMA zone X (unshaded) · 0% chance over 30 yrs
- Wildfire 1/10 Low
- Heat 6/10 Major 7 d/yr ≥107°F today · 19 d/yr by 30 yrs out
- Wind 2/10 Low 3% chance of damaging wind over 30 yrs
- Air quality 1/10 Low 0 unhealthy d/yr today · 0 by 30 yrs out
Nearby sold comps map
Loading sold comps map…
Walkable amenities ~0.75 mi
Loading nearby amenities…
Taxation est. · year 1
- Rental income
- $15,817
- − Mortgage interest
- −$2,521
- − Property taxes
- −$619
- − Insurance
- −$225
- − Repairs & maintenance
- −$1,265
- − Management
- −$1,265
- − Depreciation
- −$1,309
- Taxable income
- $8,612
- Est. tax owed @ 24.0%
- −$2,067
- After-tax cash flow
- $6,752/yr
For passive investors: Depreciation is non-cash, so a rental often shows a tax loss while cash-flowing — sheltering income. Rental losses are passive: they offset passive income freely, and up to $25,000/yr can offset ordinary (W-2) income if you actively participate and your MAGI is under $100k (phasing out to $0 by $150k); unused losses carry forward. On sale, claimed depreciation is recaptured at up to 25%, and gains may owe capital-gains tax (a 1031 exchange can defer both). Figures are a year-1 estimate at your 24.0% rate — not tax advice; consult a CPA.
Schools (NCES district)
- District
- Cordell
- NCES district ID
- 4008640
- Math proficiency
- 37% ▼ -10.00%
- Reading proficiency
- 33% ▼ -4.00%
- Median HH income
- $48,294
- Composite
- 30.21/100
- National rank
- #6304
- State rank
- #33 of 270 in OK
Livability — New Cordell
- Score
- 60/100
- State rank
- #335
- US rank
- #18607
Category grades
Schools grade is shown separately in the Schools card above.
Census & demographics
- Census place
- New Cordell, OK
- Population (ZIP)
- 3,041
Population outlook (Washita County) Hauer SSP2
- Today (2025)
- 12,143 people
- By 2030
- 12,276 · +1.1%
- By 2040
- 12,522 · +3.1%
- By 2050
- 12,740 · +4.9%
- By 2075
- 13,198 · +8.7%
- By 2100
- 13,189 · +8.6%
Race, ethnicity, and origin ACS 2023
- Neighborhood character
- Predominantly White (88%)
- Race & ethnicity
- White 88% Hispanic / Latino 6% Two or more races 2% Native American 2% Black 2%
- Hispanic origin (detail)
- Mexican 6%
- Common ancestry
- Romanian 3% Iranian 2% Serbian 2%
- Languages at home
- 97% English-only · Spanish 3%
Political lean MEDSL · Washita
- 2024 margin
- Solid R (+74.8) · D 11.8% · R 86.6% · Other 1.5%
- 2008→2024 swing
- -18.9pp toward R · 2008: -55.9pp · 2024: -74.8pp
- All cycles
- 2024: R+74.8 2020: R+73.0 2016: R+70.5 2012: R+61.8 2008: R+55.9
Not yet ingested
- Civics
- —
Market trends
- HPI YoY
- ▼ -3.38%
- Current HPI
- 203.69
- Rent YoY
- —
- Metro
- —
- State GDP YoY
- ▲ 1.55%
- F500 in state
- 6
Industry mix (Fortune 500 HQ in OK)
| Industry | F500 HQs | Revenue |
|---|---|---|
| Energy | 3 | $48B |
|
||
Price history
-17.4% since first listed6 events — show timeline
- 2026-05-01 Price Changed $45,000 MLSOK
- 2025-12-22 Price Changed $60,000 MLSOK
- 2025-10-27 Listed $65,000 MLSOK
- 2015-06-23 Listing Removed — MLSOK
- 2014-06-24 Listed $127,500 MLSOK
- 2010-07-01 Sold (Public Records) $54,500 Public Records
Property tax history
+1.2%/yrLatest (2025): $619 · +5.8% YoY. Source: county tax records.
Cash-flow waterfall
monthlySold comps — $/sqft
last 12 mo · ≤1 miLoading sold comps…