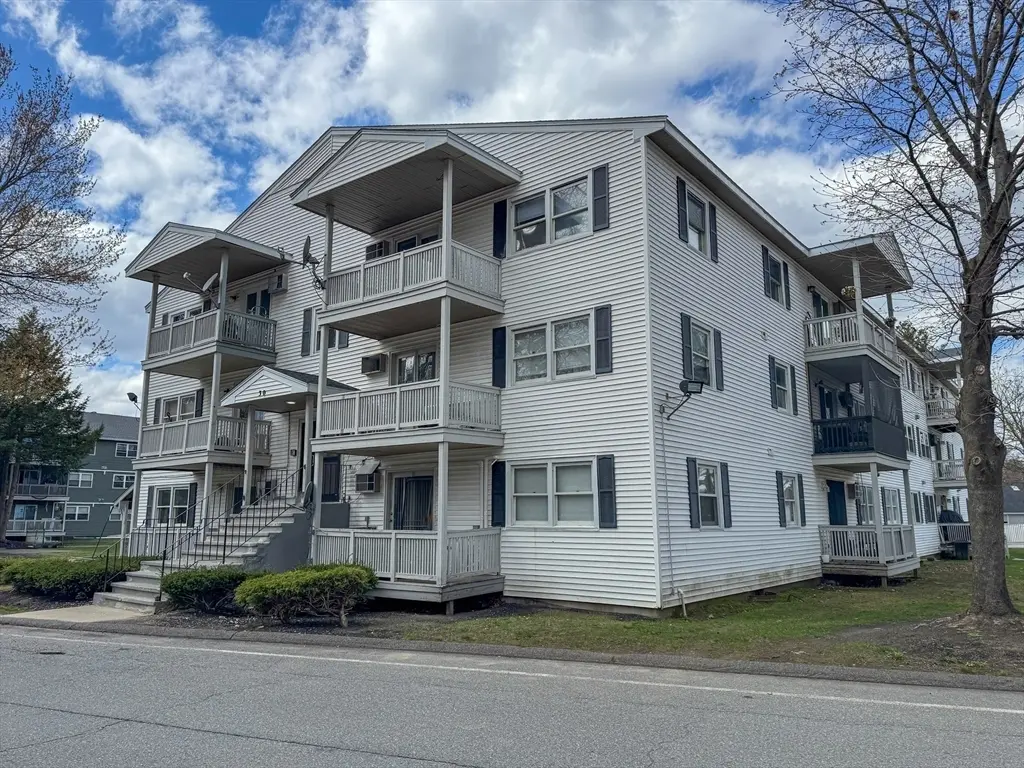
30 Abbey Rd #108 · Leominster, MA
Flood risk 1/10 · Minimal
- FEMA flood zone
- —
- Chance of flooding over 30 yrs
- 0.0%
- Est. flood insurance / yr
- —
Fire risk 1/10 · Minimal
- Est. fire insurance / yr
- $915 – $1,699
Heat risk 4/10 · Minor
- Hot days now (above 95°F)
- 7 days/yr
- Hot days in 30 yrs
- 17 days/yr
Wind risk 6/10 · Moderate
- Chance of severe wind over 30 yrs
- 27.0%
Air-quality risk 2/10 · Minimal
- Unhealthy air days now
- 1 days/yr
- Unhealthy air days in 30 yrs
- 1 days/yr
Risk factors via First Street. Map © Google.
Why this score? — see what drove the D- grade
The composite is a weighted blend of 9 inputs, each scored 0–100. Each bar is that input's sub-score; the figure is the points it added to the 100-point composite (weight × sub-score).
- ARV discount +12.9/15.0
- Cash flow +7.7/30.0
- 1% rule +4.2/10.0
- Rent growth +3.7/5.0
- Livability +3.5/5.0
- Schools +2.8/10.0
- Condition / age +2.5/5.0
- DSCR +1.8/10.0
- Appreciation +0.0/10.0
$179,900
🖨 Deal sheet 📄 Offer letter ✓ Due diligence
Listing remarks
This first-floor unit at that offers a great opportunity for customization and value. The condo features a functional layout with a combined living and dining area, ideal for simple, efficient living. The kitchen is ready for renovation, offering a blank slate to design and finish to your taste. With some updates and finishing touches, this space can be transformed into a charming and comfortable home. Conveniently located near shopping, dining, and major routes, this is a great option for investors or buyers looking to add personal value.
Key facts
- First floor unit
- $275 HOA
- Parking
Tags
Property features AI
Finance
- Other: Directions: Please use GPS for best navigation.
- HOA & community: Monthly association fee of $275; Association fee includes water, sewer, insurance, building structure maintenance, road maintenance, grounds maintenance, snow removal, and trash; Community has a garden area; Not a senior community
Exterior
- Parking: 1 open parking space
- Utilities: Public water; Public sewer
- Home design: One-story unit; Approximately built (year from public records)
- Exterior features: Condominium property; Entry level is 1
Interior
- Bathrooms: 1 full bathroom
- Heating & cooling: Electric heating; Has cooling (type listed as Other)
- Interior features: Total of 4 rooms
Neighborhood map
What this means for you Summary
Snapshot
- This is a 2-bed/1.0-bath condo listed at $180k.
Deal economics
- At list price, monthly cash flow is $-212 ($-3k/yr) — negative.
- To cash-flow at today's rent, offer at most $143k (20.8% below list).
- To meet the 1% rule (rent ≥ 1% of price), the offer needs to be $166k (7.9% below list).
- Recommended offer: $143k (20.8% below list) — sets the bar for cash-flow.
- Cap rate 4.9% vs local median 3.2% in Leominster — top-decile yield for the area; either an underpriced asset or a hidden risk that comps aren't pricing in. Stress-test before assuming the spread holds.
Location & tenants
- Location reads 69/100 on livability (#139 in MA) — a middle-class / working-renter tenant base. Strengths: housing A+, health & safety B+; Watch: schools C-, commute D+, cost of living D+.
- Leominster (suburban): math 25% / reading 38% proficiency, ranked #247 of 302 in MA (top 82%) — families likely to look elsewhere, expect single-tenant / working-renter base with shorter leases.
- Market conditions: Rents rising fast (+4.8%/yr); 56 active listings in the ZIP; 4 comparable units currently listed for rent nearby; rentals lingering (median 44d on market — plan ~5-8 weeks vacancy on turnover, expect pricing pressure); 50% of comp listings sitting > 30 days — soft ceiling on asking rent; solid renter incomes; 2,293 units permitted in Worcester County in 2024 (1,205 in 5+ unit buildings).
Forward outlook
- Local home prices are declining (-3.0%/yr); year-one equity from $1k of loan paydown is wiped out by about $5k of value loss. Plan a longer hold.
Negotiation context
- It's been on market 42 days — a 3% lower offer ($175k) is reasonable based on typical stale-listing flexibility.
Risks & watch-outs
- Climate carrying-cost: major wind risk, 27% chance of damaging wind over 30y — expect insurance premiums to compound above CPI over the hold.
Questions for the listing agent
- What do current leases actually rent for vs. the listed asking? Can we see a recent rent roll and the last 12 months of T-12 income?
- It's been on market 42 days. Have you received any prior offers? Is the seller open to a 21% concession, seller financing, or rate buy-down credit?
- What does the HOA fee cover, when was the last increase, and are there any pending special assessments or reserve-fund shortfalls?
- Any open or pending special assessments — roof, HVAC, plumbing, elevator, façade? What's the per-unit balance and payoff schedule, and is the seller paying it off at close or rolling it to the buyer?
- Is there a deadline driving the sale (1031 exchange, divorce, estate, relocation)? That informs how much negotiation room exists.
- Crime grade is D in this area — have there been break-ins, vandalism, or insurance claims at this property in the last 3 years? What carrier currently insures it and at what premium?
- The area grade is low — what's the realistic commute time and amenity access for the typical tenant pool here? Any planned neighborhood developments (good or bad) we should know about?
- What's the average days-on-market for RENTAL listings here right now (not sales)? A rising rental-DOM trend means longer vacancies and softer asking-rent achievability than the comps imply.
- What's the recent tenant-quality profile in this submarket — average credit score on applications, eviction rate, late-payment / NSF rate, and stable-employment percentage? A property-management company in the area should have these aggregated.
- How much new apartment / multifamily construction is in the pipeline within 1–3 miles? Heavy new supply (>2% of stock underway) typically softens rents 12–24 months out; light construction supports rent growth.
Investment metrics
- 1% rule
- 0.92% ✗
- Cap rate
- 4.88%
- Cash-on-cash
- -5.04%
- DSCR
- 0.78
- GRM
- 9.0
CMA / ARV
- ARV (median comp)
- $204,240
- List price
- $179,900
- Delta
- -11.92%
- Verdict
- UNDERPRICED
- Comps
- 20 within 1.0 mi
Projected returns pro-forma
-3.0% appreciation · 4.83% rent growth · sell at horizon
- IRR
- -22.2%
- Equity multiple
- 0.22×
- Total profit
- $-39,323
- Equity at exit
- $26,824
- IRR
- -11.3%
- Equity multiple
- 0.25×
- Total profit
- $-37,566
- Equity at exit
- $15,554
Cash invested: $50,372 (down + closing). Projections, not guarantees.
Landlord ↔ Tenant lean methodology
- Overall (STATE)
- 20 Strongly Tenant-Friendly
- State Massachusetts
- 20 Strongly Tenant-Friendly · D+15
- County
- — inherits STATE
- City
- — inherits STATE
ZIP-level market 01453
- Rents YoY
- 4.8%
- Active inventory
- 56
- Price-to-rent
- 9.0×
Monthly cashflow live
- Estimated rent
- $1,657 medium interval (Pro) →
- Mortgage (P&I)
- −$943
- Tax from tax record
- −$227 /mo · $2,724/yr
- Insurance
- −$75
- HOA
- −$275
- Vacancy / Maint / Mgmt
- −$348
- Net cashflow
- $-212
Break-even live
UW: 25.0% down · 7.5% · 30yr · 1.5% tax · 5.0% vac · 8.0% maint · 8.0% mgmt
Financing live
Cash to close
- Down payment
- $44,975
- Closing costs
- $5,397
- Reserves months
- —
- Total cash needed
- —
Loan-product check · same deal, 3 products live
Conventional
25% down · 7.5% · 30yr
- Down + closing
- —
- Monthly P&I
- —
- Monthly cashflow
- —
- DSCR
- —
- Eligible?
- —
Personal DTI + credit; lowest rate.
DSCR
20% down · 8.5% · 30yr
- Down + closing
- —
- Monthly P&I
- —
- Monthly cashflow
- —
- DSCR
- —
- Eligible?
- —
No personal income docs; deal must DSCR.
Hard money
10% down · 12.0% · 12mo
- Down + closing
- —
- Monthly P&I
- —
- Monthly cashflow
- —
- DSCR
- —
- Eligible?
- —
Short-term bridge; refi at stabilization.
Rent comps 4 comps
| Address | Beds | Baths | Sqft | Rent | $/sqft | DOM | Units | Dist |
|---|---|---|---|---|---|---|---|---|
| 357 Lancaster St Unit 2 Leominster, MA | 1.0 | 1.0 | 680 | $1,700 | $2.50 | 23d | 1 | 0.56mi |
| 56 South St #2 Leominster, MA | 1.0 | 1.0 | 750 | $1,500 | $2.00 | 43d | 1 | 0.89mi |
| 17 Laurel St Unit 5 Leominster, MA | 1.0 | 1.0 | 740 | $1,550 | $2.09 | 43d | 1 | 1.32mi |
| 124 3rd St Leominster, MA | 1.0 | 1.0 | 550 | $1,575 | $2.86 | 23d | 1 | 1.40mi |
HOA detail condo
- Monthly dues
- $275 · $3,300/yr
- Assessments
- None detected in remarks — confirm with the listing agent.
Listing history 18 events
-
2026-06-18days on market $179,900 Active 42 DOM
-
2026-06-17days on market $179,900 Active 41 DOM
-
2026-06-16days on market $179,900 Active 40 DOM
-
2026-06-15statusdays on market $179,900 Active 39 DOM
-
2026-06-14days on market $179,900 Price Changed 37 DOM
-
2026-06-13pricestatusdays on market $179,900 Price Changed 36 DOM
-
2026-06-10days on market $189,900 Active 34 DOM
-
2026-06-09days on market $189,900 Active 33 DOM
-
2026-06-08days on market $189,900 Active 32 DOM
-
2026-06-07days on market $189,900 Active 31 DOM
-
2026-06-05days on market $189,900 Active 28 DOM
-
2026-06-03days on market $189,900 Active 27 DOM
-
2026-06-02days on market $189,900 Active 26 DOM
-
2026-06-01days on market $189,900 Active 25 DOM
-
2026-05-31days on market $189,900 Active 24 DOM
-
2026-05-31days on market $189,900 Active 23 DOM
-
2026-05-07$189,900 New 546-char remark
-
2007-02-16soldstatus $160,000
ⓘ Source: listings_history table (triggers on properties + properties_extension) + one-shot
backfill from property_details.listing_events for pre-trigger history.
Tax reassessment forecast MA · Partial reset (capped growth)
- Current annual tax
- $2,724 · $227/mo
- Projected year-2 tax
- $2,724 · $227/mo
- Expected delta
- $0/yr ($0/mo · 0.0%)
ⓘ Screening estimate from a state-policy table — verify with the county assessor before closing.
Climate risk First Street
- Flood 1/10 Low 0% chance over 30 yrs
- Wildfire 1/10 Low
- Heat 4/10 Moderate 7 d/yr ≥95°F today · 17 d/yr by 30 yrs out
- Wind 6/10 Major 27% chance of damaging wind over 30 yrs
- Air quality 2/10 Low 1 unhealthy d/yr today · 1 by 30 yrs out
Nearby sold comps map
Loading sold comps map…
Walkable amenities ~0.75 mi
Loading nearby amenities…
Taxation est. · year 1
- Rental income
- $19,881
- − Mortgage interest
- −$10,077
- − Property taxes
- −$2,724
- − Insurance
- −$900
- − Repairs & maintenance
- −$1,590
- − Management
- −$1,590
- − HOA
- −$3,300
- − Depreciation
- −$5,233
- Taxable loss
- −$5,534
- Est. tax savings @ 24.0%
- +$1,328
- After-tax cash flow
- $-1,210/yr
For passive investors: Depreciation is non-cash, so a rental often shows a tax loss while cash-flowing — sheltering income. Rental losses are passive: they offset passive income freely, and up to $25,000/yr can offset ordinary (W-2) income if you actively participate and your MAGI is under $100k (phasing out to $0 by $150k); unused losses carry forward. On sale, claimed depreciation is recaptured at up to 25%, and gains may owe capital-gains tax (a 1031 exchange can defer both). Figures are a year-1 estimate at your 24.0% rate — not tax advice; consult a CPA.
Schools (NCES district)
- District
- Leominster
- NCES district ID
- 2506780
- Math proficiency
- 25% ▼ -23.00%
- Reading proficiency
- 38% ▼ -6.00%
- Median HH income
- $57,041
- Composite
- 28.07/100
- National rank
- #6836
- State rank
- #247 of 302 in MA
Livability — Leominster
- Score
- 69/100
- State rank
- #139
- US rank
- #8562
Category grades
Schools grade is shown separately in the Schools card above.
Census & demographics
- Census place
- Leominster, MA
- County
- Worcester County · 487,911 people
- City population
- 43,851
- Metro
- Worcester, MA-CT
- Population (ZIP)
- 43,851
- Household income
- $84,296
- Rent vs Own
- Severe rent burden
- 1633.0
Population outlook (Worcester County) Hauer SSP2
- Today (2025)
- 850,858 people
- By 2030
- 860,403 · +1.1%
- By 2040
- 869,902 · +2.2%
- By 2050
- 869,110 · +2.1%
- By 2075
- 870,120 · +2.3%
- By 2100
- 829,703 · -2.5%
Race, ethnicity, and origin ACS 2023
- Neighborhood character
- Predominantly White (68%)
- Race & ethnicity
- White 68% Hispanic / Latino 17% Two or more races 12% Black 5% Asian 3%
- Hispanic origin (detail)
- Mexican 2% Puerto Rican 8% Dominican 1%
- Common ancestry
- Lithuanian 9% Estonian 2% Romanian 2%
- Foreign-born
- 15% · Canada, South Korea, Jamaica
- Languages at home
- 76% English-only · Spanish 13% Other Indo-European 5% French/Haitian/Cajun 1%
Political lean MEDSL · Worcester
- 2024 margin
- D (+10.0) · D 53.9% · R 43.9% · Other 2.2%
- 2008→2024 swing
- -3.8pp toward R · 2008: 13.8pp · 2024: 10.0pp
- All cycles
- 2024: D+10.0 2020: D+17.8 2016: D+10.5 2012: D+9.2 2008: D+13.8
Not yet ingested
- Civics
- —
Market trends
- HPI YoY
- ▼ -621.70%
- Current HPI
- 296.2863
- Rent YoY
- ▲ 4.83%
- Metro
- Worcester, MA-CT
- State GDP YoY
- ▲ 2.28%
- F500 in state
- 38
Industry mix (Fortune 500 HQ in MA)
| Industry | F500 HQs | Revenue |
|---|---|---|
| Technology | 3 | $17B |
|
||
| Insurance | 2 | $84B |
|
||
| Retail | 2 | $76B |
|
||
| Life Sciences | 1 | $43B |
|
||
| Energy Technology | 1 | $31B |
|
||
| Aerospace / Defense | 1 | $18B |
|
||
Price history
+12.4% since first listed3 events — show timeline
- 2026-06-11 Price Changed $179,900 MLS PIN
- 2026-05-07 Listed $189,900 MLS PIN
- 2007-02-16 Sold (Public Records) $160,000 Public Records
Property tax history
+3.1%/yrLatest (2023): $2,724 · +22.0% YoY. Source: county tax records.
Cash-flow waterfall
monthlySold comps — $/sqft
last 12 mo · ≤1 miLoading sold comps…