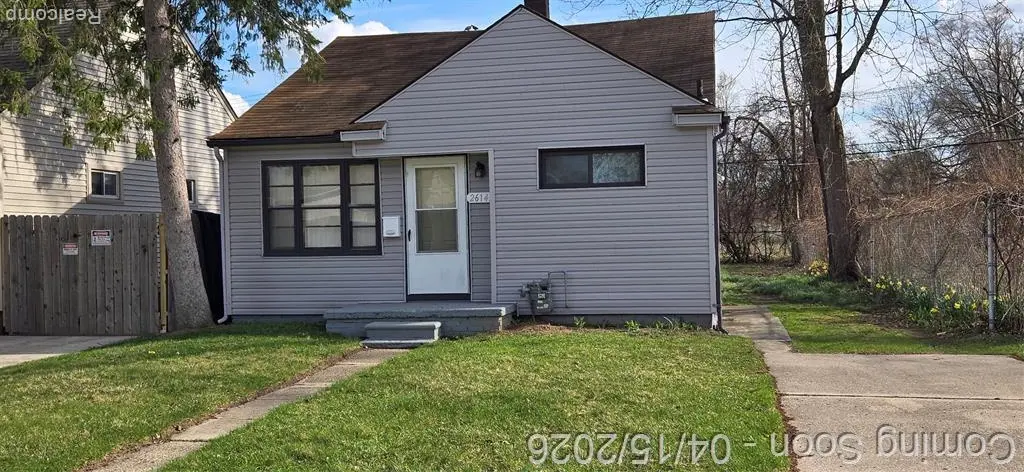
26147 Lehigh St · Inkster, MI
Flood risk 1/10 · Minimal
- FEMA flood zone
- X (unshaded)
- Chance of flooding over 30 yrs
- 0.0%
- Est. flood insurance / yr
- $507 – $1,088
Fire risk 1/10 · Minimal
- Est. fire insurance / yr
- $784 – $1,456
Heat risk 3/10 · Minor
- Hot days now (above 98°F)
- 7 days/yr
- Hot days in 30 yrs
- 14 days/yr
Wind risk 2/10 · Minimal
- Chance of severe wind over 30 yrs
- —
Air-quality risk 2/10 · Minimal
- Unhealthy air days now
- 1 days/yr
- Unhealthy air days in 30 yrs
- 2 days/yr
Risk factors via First Street. Map © Google.
Why this score? — see what drove the B grade
The composite is a weighted blend of 9 inputs, each scored 0–100. Each bar is that input's sub-score; the figure is the points it added to the 100-point composite (weight × sub-score).
- Cash flow +30.0/30.0
- ARV discount +15.0/15.0
- 1% rule +10.0/10.0
- DSCR +10.0/10.0
- Livability +3.4/5.0
- Rent growth +3.2/5.0
- Condition / age +2.5/5.0
- Schools +0.7/10.0
- Appreciation +0.0/10.0
$80,000
🖨 Deal sheet 📄 Offer letter ✓ Due diligence
Listing remarks MLS
Welcome to 26147 Lehigh! This is a nice updated ranch home that has a NEW kitchen with white cabinets, NEW flooring, freshly painted in neutral tones, Updated bathroom with custom tile, NEW vinyl siding, most of the windows are NEW, third bedroom is connected to 2nd bedroom and could be office area or nursery, spacious yard, located close to shopping and freeways. hurry before its gone. property taxes are NON homestead. FHA and VA is OK!
Key facts
- 5,227 sq ft lot
- Built 1954
- Listed 65 days
Property features AI
Exterior
- Parking: No garage
- Utilities: Public water; Public sewer
- Home design: Single-family residence; One story; Ground-level entry with steps; Vinyl siding exterior; Asphalt roof
- Construction: Vinyl siding construction; Asphalt roof
- Exterior features: Paved road access; Pets allowed (cats and dogs); No pool
Interior
- Bathrooms: 1 full bathroom
- Heating & cooling: Forced air heating (natural gas); No cooling
- Interior features: Crawl space basement; 6 total rooms
- Laundry & utility: Dedicated laundry room
Neighborhood map
What this means for you Summary
Snapshot
- This is a 3-bed/1.0-bath single-family listed at $80k.
Deal economics
- At list price, monthly cash flow is $491 ($6k/yr) — positive.
- The deal already cash-flows at list — no discount required.
- Meets the 1% rule at list price ($1k rent vs $80k).
- Recommended offer: $75k (6.0% below list) — sets the bar for market timing.
- Cap rate 13.7% vs local median 9.8% in Inkster — top-decile yield for the area; either an underpriced asset or a hidden risk that comps aren't pricing in. Stress-test before assuming the spread holds.
Location & tenants
- Location reads 67/100 on livability (#406 in MI) — a middle-class / working-renter tenant base. Strengths: commute A+, cost of living A+, housing A+; Watch: health & safety D, schools F, crime F.
- Westwood Community School District (suburban): math 6% / reading 11% proficiency, ranked #529 of 540 in MI (top 98%) — low school quality limits family demand, transient renter base, plan for 1-2y turnover; 81% free/reduced lunch — lower-income household profile, screen leases tightly.
- Market conditions: Rents rising (+3.0%/yr); 142 active listings in the ZIP; 22 comparable units currently listed for rent nearby; rentals at typical pace (median 15d on market — plan ~3-4 weeks tenant-placement turnaround); lower-income renter base — watch delinquency; 2,639 units permitted in Wayne County in 2024 (1,216 in 5+ unit buildings).
- This rent runs 42% of the median local income ($39k/yr) — at the standard rent-burdened threshold; future hikes will face affordability resistance.
Forward outlook
- Local home prices are declining (-3.0%/yr); year-one equity from $553 of loan paydown is wiped out by about $2k of value loss. Plan a longer hold.
- Wayne County population projected at -17% by 2050 — secular population decline; favor cash flow + early exit over multi-decade hold.
- At projected returns (-3.0% appreciation + 3.0% rent growth), your $22k cash investment doubles in ~5 years — after that, you're playing with house money.
Negotiation context
- It's been on market 65 days — a 6% lower offer ($75k) is reasonable based on typical stale-listing flexibility.
- 2 sale attempts; this cycle's ask has dropped $5k (6%) from the opening price — seller is motivated, your offer sets the floor, not the list.
Risks & watch-outs
- Watch-outs: built in 1954 — expect roof / HVAC / electrical / plumbing capex.
Questions for the listing agent
- It's been on market 65 days. Have you received any prior offers? Is the seller open to a 6% concession, seller financing, or rate buy-down credit?
- Built in 1954 — when were the roof, HVAC, electrical panel, plumbing, and water heater last replaced?
- Why hasn't it sold? Are there any deal-killer items the seller is aware of (foundation, flood, title, zoning, code violations)?
- Is there a deadline driving the sale (1031 exchange, divorce, estate, relocation)? That informs how much negotiation room exists.
- Schools are F-rated, which usually means shorter tenancies and higher turnover. Who's the typical renter profile here, and what's been the actual vacancy rate?
- Crime grade is F in this area — have there been break-ins, vandalism, or insurance claims at this property in the last 3 years? What carrier currently insures it and at what premium?
- What's the average days-on-market for RENTAL listings here right now (not sales)? A rising rental-DOM trend means longer vacancies and softer asking-rent achievability than the comps imply.
- What's the recent tenant-quality profile in this submarket — average credit score on applications, eviction rate, late-payment / NSF rate, and stable-employment percentage? A property-management company in the area should have these aggregated.
- How much new for-sale + rental construction is in the pipeline within 1–3 miles? Heavy new supply typically softens prices + rents 12–24 months out; constrained supply supports both.
Investment metrics
- 1% rule
- 1.74% ✓
- Cap rate
- 13.66%
- Cash-on-cash
- 26.29%
- DSCR
- 2.17
- GRM
- 4.8
CMA / ARV
- ARV (on-the-fly)
- $115,508
- Comps found
- 12
Show comp detail 12 sales within ~0.75 mi
| Address | Dist | Beds/Ba | Sqft | Sold | Price | $/sf | Match |
|---|---|---|---|---|---|---|---|
| 26159 Stanford St | 0.07mi | 4/1.0 (+1) | 850 (-1%) | 2mo | $92,000 | $108 | 88 |
| 26076 Colgate St | 0.16mi | 3/1.0 | 950 (+10%) | 6mo | $111,610 | $117 | 70 |
| 26656 Kitch St | 0.57mi | 3/1.0 | 909 (+6%) | 5mo | $60,000 | $66 | 60 |
| 25885 Currier St | 0.47mi | 3/1.0 | 936 (+9%) | 5mo | $117,000 | $125 | 59 |
| 25038 Annapolis St | 0.69mi | 2/1.0 (-1) | 841 (-2%) | 1mo | $125,000 | $149 | 58 |
| 25046 Andover Dr | 0.71mi | 3/1.0 | 910 (+6%) | 3mo | $140,000 | $154 | 55 |
| 25716 Notre Dame St | 0.71mi | 2/1.0 (-1) | 850 (-1%) | 6mo | $105,000 | $124 | 55 |
| 25007 Hopkins St | 0.72mi | 2/1.0 (-1) | 841 (-2%) | 4mo | $129,000 | $153 | 54 |
| 25037 Hopkins St | 0.68mi | 2/1.0 (-1) | 812 (-6%) | 2mo | $159,900 | $197 | 51 |
| 25036 Colgate St | 0.70mi | 3/1.0 | 945 (+10%) | 1mo | $85,000 | $90 | 50 |
| 26825 Kitch St | 0.60mi | 3/1.0 | 972 (+13%) | 2mo | $130,000 | $134 | 49 |
| 26131 Amherst St | 0.56mi | 3/1.0 | 988 (+15%) | 3mo | $136,000 | $138 | 47 |
Match score weights: distance 35% · size 25% · config 20% · recency 20%. Top-matched comps best support the ARV.
Projected returns pro-forma
-3.0% appreciation · 2.95% rent growth · sell at horizon
- IRR
- 20.0%
- Equity multiple
- 1.82×
- Total profit
- $18,280
- Equity at exit
- $11,928
- IRR
- 28.3%
- Equity multiple
- 3.50×
- Total profit
- $56,102
- Equity at exit
- $6,917
Cash invested: $22,400 (down + closing). Projections, not guarantees.
Landlord ↔ Tenant lean methodology
- Overall (STATE)
- 62 Landlord-Friendly
- State Michigan
- 62 Landlord-Friendly · EVEN
- County
- — inherits STATE
- City
- — inherits STATE
ZIP-level market 48141
- Home prices YoY
- -2.9%
- Rents YoY
- 3.0%
- Active inventory
- 142
- Price-to-rent
- 4.8×
Monthly cashflow live
- Estimated rent
- $1,388 high interval (Pro) →
- Mortgage (P&I)
- −$420
- Tax from tax record
- −$153 /mo · $1,834/yr
- Insurance
- −$33
- HOA
- −$0
- Vacancy / Maint / Mgmt
- −$291
- Net cashflow
- $491
Break-even live
UW: 25.0% down · 7.5% · 30yr · 1.5% tax · 5.0% vac · 8.0% maint · 8.0% mgmt
Financing live
Cash to close
- Down payment
- $20,000
- Closing costs
- $2,400
- Reserves months
- —
- Total cash needed
- —
Loan-product check · same deal, 3 products live
Conventional
25% down · 7.5% · 30yr
- Down + closing
- —
- Monthly P&I
- —
- Monthly cashflow
- —
- DSCR
- —
- Eligible?
- —
Personal DTI + credit; lowest rate.
DSCR
20% down · 8.5% · 30yr
- Down + closing
- —
- Monthly P&I
- —
- Monthly cashflow
- —
- DSCR
- —
- Eligible?
- —
No personal income docs; deal must DSCR.
Hard money
10% down · 12.0% · 12mo
- Down + closing
- —
- Monthly P&I
- —
- Monthly cashflow
- —
- DSCR
- —
- Eligible?
- —
Short-term bridge; refi at stabilization.
Rent comps 22 comps
| Address | Beds | Baths | Sqft | Rent | $/sqft | DOM | Units | Dist |
|---|---|---|---|---|---|---|---|---|
| 26089 Lehigh St Inkster, MI | 2.0 | 1.0 | 900 | $1,295 | $1.44 | 17d | 1 | 0.06mi |
| 26159 Stanford St Inkster, MI | 4.0 | 1.0 | 1056 | $1,350 | $1.28 | 5d | 1 | 0.10mi |
| 26382 Colgate St Inkster, MI | 2.0 | 1.0 | 850 | $935 | $1.10 | 24d | 1 | 0.31mi |
| 25722 Carlysle St Dearborn Heights, MI | 3.0 | 1.0 | 1040 | $1,450 | $1.39 | 17d | 1 | 0.51mi |
| 3755 Heritage Pkwy Dearborn, MI | 2.0 | 1.0 | 830 | $1,450 | $1.75 | 43d | 1 | 0.58mi |
| 3763 Heritage Pkwy Dearborn, MI | 2.0 | 1.5 | 1035 | $1,450 | $1.40 | 43d | 1 | 0.62mi |
| 3809 Heritage Pkwy Dearborn, MI | 2.0 | 1.5 | 1035 | $1,400 | $1.35 | 43d | 1 | 0.64mi |
| 26707 Penn St Inkster, MI | 3.0 | 1.0 | 900 | $1,400 | $1.56 | 5d | 1 | 0.64mi |
| 26742 Penn St Inkster, MI | 3.0 | 1.0 | 1000 | $1,300 | $1.30 | 16d | 1 | 0.68mi |
| 25016 Lehigh St Dearborn Heights, MI | 2.0 | 1.0 | 1000 | $1,400 | $1.40 | 4d | 1 | 0.69mi |
| 24684 Lehigh St Dearborn Heights, MI | 4.0 | 1.0 | 878 | $1,600 | $1.82 | 12d | 1 | 0.81mi |
| 27139 Penn St Inkster, MI | 3.0 | 1.0 | 832 | $675 | $0.81 | 17d | 1 | 0.82mi |
| 5845 Michael St Taylor, MI | 2.0 | 1.0 | 618 | $1,325 | $2.14 | 4d | 1 | 0.83mi |
| 24601 Andover Dr Dearborn Heights, MI | 3.0 | 1.5 | 1092 | $1,700 | $1.56 | 2d | 1 | 0.91mi |
| 25745 Princeton St Dearborn Heights, MI | 3.0 | 1.0 | 1080 | $1,500 | $1.39 | 11d | 1 | 0.93mi |
| 24442 Union St Dearborn, MI | 3.0 | 1.5 | 1000 | $1,900 | $1.90 | 1d | 1 | 1.07mi |
| 24154 Dartmouth St Dearborn, MI | 2.0 | 1.0 | 950 | $1,275 | $1.34 | 15d | 1 | 1.12mi |
| 4481 Westpoint St Dearborn Heights, MI | 3.0 | 2.0 | 768 | $1,549 | $2.02 | 14d | 1 | 1.29mi |
| 4301 Harriet St Unit A-1 Inkster, MI | 2.0 | 1.5 | 1000 | $1,300 | $1.30 | 43d | 1 | 1.33mi |
| 4167 Isabelle St Inkster, MI | 2.0 | 1.0 | 900 | $1,295 | $1.44 | 17d | 1 | 1.39mi |
| 4080 Isabelle St Inkster, MI | 4.0 | 1.0 | 975 | $1,150 | $1.18 | 14d | 1 | 1.42mi |
| 3236 Walnut St Inkster, MI | 3.0 | 1.0 | 1096 | $1,495 | $1.36 | 3d | 1 | 1.43mi |
Listing history 19 events
-
2026-06-18days on market $80,000 Active 65 DOM
-
2026-06-17days on market $80,000 Active 64 DOM
-
2026-06-16days on market $80,000 Active 63 DOM
-
2026-06-15days on market $80,000 Active 62 DOM
-
2026-06-13days on market $80,000 Active 60 DOM
-
2026-06-13days on market $80,000 Active 59 DOM
-
2026-06-09days on market $80,000 Active 56 DOM
-
2026-06-08days on market $80,000 Active 55 DOM
-
2026-06-07days on market $80,000 Active 54 DOM
-
2026-06-04days on market $80,000 Active 51 DOM
-
2026-06-03days on market $80,000 Active 50 DOM
-
2026-06-02days on market $80,000 Active 49 DOM
-
2026-06-01days on market $80,000 Active 48 DOM
-
2026-05-31days on market $80,000 Active 47 DOM
-
2026-05-12price $80,000 441-char remark
Show marketing remark (441 chars)
Welcome to 26147 Lehigh! This is a nice updated ranch home that has a NEW kitchen with white cabinets, NEW flooring, freshly painted in neutral tones, Updated bathroom with custom tile, NEW vinyl siding, most of the windows are NEW, third bedroom is connected to 2nd bedroom and could be office area or nursery, spacious yard, located close to shopping and freeways. hurry before its gone. property taxes are NON homestead. FHA and VA is OK!
-
2026-05-11price $80,000
-
2026-04-15$85,000 Active 441-char remark
Show marketing remark (441 chars)
Welcome to 26147 Lehigh! This is a nice updated ranch home that has a NEW kitchen with white cabinets, NEW flooring, freshly painted in neutral tones, Updated bathroom with custom tile, NEW vinyl siding, most of the windows are NEW, third bedroom is connected to 2nd bedroom and could be office area or nursery, spacious yard, located close to shopping and freeways. hurry before its gone. property taxes are NON homestead. FHA and VA is OK!
-
2026-04-15$85,000 Active
Show marketing remark (441 chars)
Welcome to 26147 Lehigh! This is a nice updated ranch home that has a NEW kitchen with white cabinets, NEW flooring, freshly painted in neutral tones, Updated bathroom with custom tile, NEW vinyl siding, most of the windows are NEW, third bedroom is connected to 2nd bedroom and could be office area or nursery, spacious yard, located close to shopping and freeways. hurry before its gone. property taxes are NON homestead. FHA and VA is OK!
-
2026-04-14historical $85,000 441-char remark
Show marketing remark (441 chars)
Welcome to 26147 Lehigh! This is a nice updated ranch home that has a NEW kitchen with white cabinets, NEW flooring, freshly painted in neutral tones, Updated bathroom with custom tile, NEW vinyl siding, most of the windows are NEW, third bedroom is connected to 2nd bedroom and could be office area or nursery, spacious yard, located close to shopping and freeways. hurry before its gone. property taxes are NON homestead. FHA and VA is OK!
ⓘ Source: listings_history table (triggers on properties + properties_extension) + one-shot
backfill from property_details.listing_events for pre-trigger history.
Tax reassessment forecast MI · Partial reset (capped growth)
- Current annual tax
- $1,834 · $153/mo
- Projected year-2 tax
- $1,834 · $153/mo
- Expected delta
- $0/yr ($0/mo · 0.0%)
ⓘ Screening estimate from a state-policy table — verify with the county assessor before closing.
Climate risk First Street
- Flood 1/10 Low FEMA zone X (unshaded) · 0% chance over 30 yrs
- Wildfire 1/10 Low
- Heat 3/10 Moderate 7 d/yr ≥98°F today · 14 d/yr by 30 yrs out
- Wind 2/10 Low
- Air quality 2/10 Low 1 unhealthy d/yr today · 2 by 30 yrs out
Nearby sold comps map
Loading sold comps map…
Walkable amenities ~0.75 mi
Loading nearby amenities…
Taxation est. · year 1
- Rental income
- $16,656
- − Mortgage interest
- −$4,481
- − Property taxes
- −$1,834
- − Insurance
- −$400
- − Repairs & maintenance
- −$1,332
- − Management
- −$1,332
- − Depreciation
- −$2,327
- Taxable income
- $4,948
- Est. tax owed @ 24.0%
- −$1,188
- After-tax cash flow
- $4,702/yr
For passive investors: Depreciation is non-cash, so a rental often shows a tax loss while cash-flowing — sheltering income. Rental losses are passive: they offset passive income freely, and up to $25,000/yr can offset ordinary (W-2) income if you actively participate and your MAGI is under $100k (phasing out to $0 by $150k); unused losses carry forward. On sale, claimed depreciation is recaptured at up to 25%, and gains may owe capital-gains tax (a 1031 exchange can defer both). Figures are a year-1 estimate at your 24.0% rate — not tax advice; consult a CPA.
Schools (NCES district)
- District
- Westwood Community School District
- NCES district ID
- 2611640
- Math proficiency
- 6% ▼ -6.00%
- Reading proficiency
- 11% ▼ -6.00%
- Median HH income
- $36,350
- Composite
- 7.06/100
- National rank
- #9967
- State rank
- #529 of 540 in MI
Livability — Inkster
- Score
- 67/100
- State rank
- #406
- US rank
- #11087
Category grades
Schools grade is shown separately in the Schools card above.
Census & demographics
- Census place
- Inkster, MI
- County
- Wayne County · 1,562,939 people
- City population
- 25,428
- Metro
- Detroit-Warren-Dearborn, MI
- Population (ZIP)
- 25,428
- Household income
- $39,252
- Rent vs Own
- Severe rent burden
- 1558.0
Population outlook (Wayne County) Hauer SSP2
- Today (2025)
- 1,675,273 people
- By 2030
- 1,620,300 · -3.3%
- By 2040
- 1,502,341 · -10.3%
- By 2050
- 1,384,039 · -17.4%
- By 2075
- 1,124,592 · -32.9%
- By 2100
- 881,193 · -47.4%
Race, ethnicity, and origin ACS 2023
- Neighborhood character
- Predominantly Black (72%)
- Race & ethnicity
- Black 72% White 17% Two or more races 7% Hispanic / Latino 2% Asian 1%
- Common ancestry
- Romanian 3% Slovak 1% Italian 1%
- Foreign-born
- 5% · Canada, China
- Languages at home
- 92% English-only · Arabic 3% Other Asian/Pacific 1% Spanish 1%
Political lean MEDSL · Wayne
- 2024 margin
- Strong D (+29.0) · D 62.7% · R 33.7% · Other 3.6%
- 2008→2024 swing
- -20.5pp toward R · 2008: 49.5pp · 2024: 29.0pp
- All cycles
- 2024: D+29.0 2020: D+38.1 2016: D+37.3 2012: D+46.9 2008: D+49.5
Not yet ingested
- Civics
- —
Market trends
- HPI YoY
- ▼ -11.74%
- Current HPI
- 390.2139
- Rent YoY
- ▲ 2.95%
- Metro
- Detroit-Warren-Dearborn, MI
- State GDP YoY
- ▲ 1.37%
- F500 in state
- 28
Industry mix (Fortune 500 HQ in MI)
| Industry | F500 HQs | Revenue |
|---|---|---|
| Automotive Parts | 3 | $48B |
|
||
| Automotive | 2 | $372B |
|
||
| Chemicals | 1 | $45B |
|
||
| Automotive Retail | 1 | $29B |
|
||
| Healthcare / Medical Devices | 1 | $23B |
|
||
| Automotive Technology | 1 | $20B |
|
||
Price history
-5.9% since first listed5 events — show timeline
- 2026-05-12 Price Changed $80,000 MiRealSource-MiMLS
- 2026-05-11 Price Changed $80,000 REALCOMP
- 2026-04-15 Listed $85,000 MiRealSource-MiMLS
- 2026-04-15 Listed $85,000 REALCOMP
- 2026-04-14 Coming Soon $85,000 MiRealSource-MiMLS
Property tax history
-3.6%/yrLatest (2025): $1,834 · -15.3% YoY. Source: county tax records.
Cash-flow waterfall
monthlySold comps — $/sqft
last 12 mo · ≤1 miLoading sold comps…