 Duplex
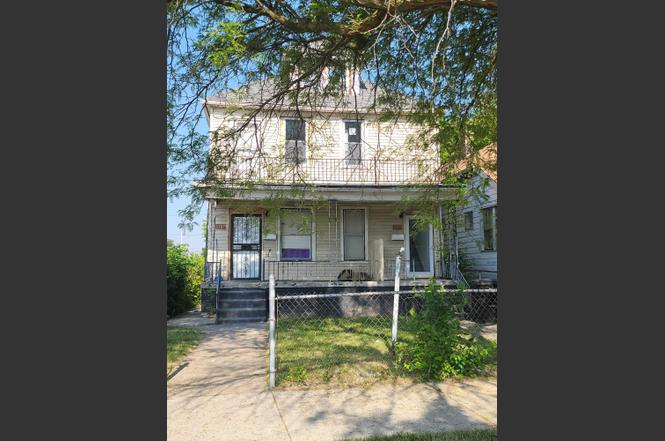
6307 Woodrow St · Detroit, MI
Flood risk 1/10 · Minimal
- FEMA flood zone
- X (unshaded)
- Chance of flooding over 30 yrs
- 0.0%
- Est. flood insurance / yr
- $473 – $860
Fire risk 1/10 · Minimal
- Est. fire insurance / yr
- $784 – $1,456
Heat risk 3/10 · Minor
- Hot days now (above 97°F)
- 7 days/yr
- Hot days in 30 yrs
- 15 days/yr
Wind risk 2/10 · Minimal
- Chance of severe wind over 30 yrs
- —
Air-quality risk 4/10 · Minor
- Unhealthy air days now
- 4 days/yr
- Unhealthy air days in 30 yrs
- 6 days/yr
Risk factors via First Street. Map © Google.
Why this score? — see what drove the B- grade
The composite is a weighted blend of 9 inputs, each scored 0–100. Each bar is that input's sub-score; the figure is the points it added to the 100-point composite (weight × sub-score).
- Cash flow +30.0/30.0
- 1% rule +10.0/10.0
- DSCR +10.0/10.0
- ARV discount +7.5/15.0
- Livability +3.7/5.0
- Rent growth +2.5/5.0
- Condition / age +2.5/5.0
- Schools +1.3/10.0
- Appreciation +0.0/10.0
$74,900
🖨 Deal sheet 📄 Offer letter ✓ Due diligence
Multi-family units
County records classify this as Multi-Family (2-4 Unit). Listing-text estimate: 2 units. confirmed
Listing remarks MLS
Investor special with value-add potential! This Detroit duplex features two separate 2-bedroom, 1-bath units with private entrances. The upper unit is rent-ready with updated flooring, refreshed kitchen cabinetry, and an updated bathroom, while the lower unit requires renovation, providing an opportunity to increase value and maximize rental income. Ideal for investors seeking a fix-and-hold, BRRRR, or portfolio addition. Separate units offer flexibility for future income generation, and the rent-ready upper unit allows improvements to be phased as needed. The basement and separate living spaces add to the property's potential. Property sold as-is. Buyer and buyer's agent to verify all information.
Key facts
- Basement
- Private entrances
- Updated flooring
Tags
Property features AI
Finance
- Financial info: Annual tax amount listed
Exterior
- Utilities: Public water; Public sewer; Electricity connected; Natural gas connected; Sewer available
- Home design: Multi-family residential income property; Two-unit building with upper and lower units
- Construction: Aluminum siding
- Exterior features: Paved public road access; Lot dimensions approximately 30 x 147
Interior
- Bedrooms: Upper unit: 2 bedrooms; Lower unit: 2 bedrooms
- Bathrooms: Upper unit: 1 bathroom; Lower unit: 1 bathroom
- Heating & cooling: Baseboard heating; Electric heating; Forced air heating; Natural gas heating; Has heating
- Interior features: Full basement
Neighborhood map
What this means for you Summary
Snapshot
- This is a 2 × 2-bed/1.0-bath units multifamily listed at $75k.
Deal economics
- At list price, monthly cash flow is $857 ($10k/yr) — positive. Per door: $429/mo.
- The deal already cash-flows at list — no discount required.
- Meets the 1% rule at list price ($2k rent vs $75k).
- Cap rate 20.0% vs local median 10.2% in Detroit — top-decile yield for the area; either an underpriced asset or a hidden risk that comps aren't pricing in. Stress-test before assuming the spread holds.
Location & tenants
- Location reads 73/100 on livability (#218 in MI) — a middle-class / working-renter tenant base. Strengths: amenities A+, commute A+, cost of living A+; Watch: schools F, crime F, employment F.
- Detroit Public Schools Community District (urban): math 10% / reading 24% proficiency, ranked #499 of 540 in MI (top 92%) — low school quality limits family demand, transient renter base, plan for 1-2y turnover; 90% free/reduced lunch — lower-income household profile, screen leases tightly.
- Market conditions: 94 active listings in the ZIP; 14 comparable units currently listed for rent nearby; rentals lingering (median 44d on market — plan ~5-8 weeks vacancy on turnover, expect pricing pressure); 50% of comp listings sitting > 30 days — soft ceiling on asking rent; 2,639 units permitted in Wayne County in 2024 (1,216 in 5+ unit buildings).
Forward outlook
- Local home prices are declining (-3.0%/yr); year-one equity from $518 of loan paydown is wiped out by about $2k of value loss. Plan a longer hold.
- Wayne County population projected at -17% by 2050 — secular population decline; favor cash flow + early exit over multi-decade hold.
- At projected returns (-3.0% appreciation + 3.0% rent growth), your $21k cash investment doubles in ~3 years — after that, you're playing with house money.
Negotiation context
- Only 3 days on market — expect competitive offers; lowballing is unlikely to land.
- 10 sale attempts since 5y ago with the ask held roughly flat each time — persistent listings suggest the price (not the market) is what's stuck; bring a comps-based counter.
- Current owner paid $40k; list at $75k implies a 87% gain — meaningful room to come down on a strong offer.
Risks & watch-outs
- Watch-outs: built in 1921 — expect roof / HVAC / electrical / plumbing capex.
Questions for the listing agent
- Can we see the unit-by-unit rent roll, current vacancy, and any below-market leases? What's the average tenancy length?
- What capital expenditures (roof, boiler, parking lot, exteriors) have been made in the last 5 years, and what's planned in the next 2?
- Built in 1921 — when were the roof, HVAC, electrical panel, plumbing, and water heater last replaced?
- Is there a deadline driving the sale (1031 exchange, divorce, estate, relocation)? That informs how much negotiation room exists.
- Schools are F-rated, which usually means shorter tenancies and higher turnover. Who's the typical renter profile here, and what's been the actual vacancy rate?
- Crime grade is F in this area — have there been break-ins, vandalism, or insurance claims at this property in the last 3 years? What carrier currently insures it and at what premium?
- What's the average days-on-market for RENTAL listings here right now (not sales)? A rising rental-DOM trend means longer vacancies and softer asking-rent achievability than the comps imply.
- What's the recent tenant-quality profile in this submarket — average credit score on applications, eviction rate, late-payment / NSF rate, and stable-employment percentage? A property-management company in the area should have these aggregated.
- How much new apartment / multifamily construction is in the pipeline within 1–3 miles? Heavy new supply (>2% of stock underway) typically softens rents 12–24 months out; light construction supports rent growth.
Investment metrics
- 1% rule
- 2.31% ✓
- Cap rate
- 20.03%
- Cash-on-cash
- 49.06%
- DSCR
- 3.18
- GRM
- 3.6
CMA / ARV
- ARV (on-the-fly)
- $162,400
- Comps found
- 2
Show comp detail 2 sales within ~0.75 mi
| Address | Dist | Beds/Ba | Sqft | Sold | Price | $/sf | Match |
|---|---|---|---|---|---|---|---|
| 6344 Scotten St | 0.31mi | 4/2.0 | 1,232 (-15%) | 10mo | $47,000 | $38 | 50 |
| 7331 Scotten St | 0.49mi | 4/2.0 | 1,250 (-14%) | 16mo | $140,000 | $112 | 39 |
Match score weights: distance 35% · size 25% · config 20% · recency 20%. Top-matched comps best support the ARV.
Projected returns pro-forma
-3.0% appreciation · 3.0% rent growth · sell at horizon
- IRR
- 46.7%
- Equity multiple
- 3.03×
- Total profit
- $42,498
- Equity at exit
- $11,168
- IRR
- 52.4%
- Equity multiple
- 6.12×
- Total profit
- $107,421
- Equity at exit
- $6,476
Cash invested: $20,972 (down + closing). Projections, not guarantees.
Landlord ↔ Tenant lean methodology
- Overall (STATE)
- 62 Landlord-Friendly
- State Michigan
- 62 Landlord-Friendly · EVEN
- County
- — inherits STATE
- City
- — inherits STATE
ZIP-level market 48210
- Home prices YoY
- -22.3%
- Active inventory
- 94
- Price-to-rent
- 7.2×
Monthly cashflow live
- Estimated rent
- $1,733 medium interval (Pro) →
- Mortgage (P&I)
- −$393
- Tax from tax record
- −$88 /mo · $1,051/yr
- Insurance
- −$31
- HOA
- −$0
- Vacancy / Maint / Mgmt
- −$364
- Net cashflow
- $857
Break-even live
2-unit breakdown (identical units grouped — click to expand)
| Units | Beds | Baths | Est. rent |
|---|---|---|---|
| 2× units | 2 | 1 | $1,732 |
| #1 | 2 | 1 | $866 |
| #2 | 2 | 1 | $866 |
| Total (2 units) | $1,733 | ||
UW: 25.0% down · 7.5% · 30yr · 1.5% tax · 5.0% vac · 8.0% maint · 8.0% mgmt
Financing live
Cash to close
- Down payment
- $18,725
- Closing costs
- $2,247
- Reserves months
- —
- Total cash needed
- —
Loan-product check · same deal, 3 products live
Conventional
25% down · 7.5% · 30yr
- Down + closing
- —
- Monthly P&I
- —
- Monthly cashflow
- —
- DSCR
- —
- Eligible?
- —
Personal DTI + credit; lowest rate.
DSCR
20% down · 8.5% · 30yr
- Down + closing
- —
- Monthly P&I
- —
- Monthly cashflow
- —
- DSCR
- —
- Eligible?
- —
No personal income docs; deal must DSCR.
Hard money
10% down · 12.0% · 12mo
- Down + closing
- —
- Monthly P&I
- —
- Monthly cashflow
- —
- DSCR
- —
- Eligible?
- —
Short-term bridge; refi at stabilization.
Rent comps 14 comps
| Address | Beds | Baths | Sqft | Rent | $/sqft | DOM | Units | Dist |
|---|---|---|---|---|---|---|---|---|
| 4426 McGraw Ave Unit 1 Detroit, MI | 3.0 | 1.0 | 1400 | $1,200 | $0.86 | 43d | 1 | 0.31mi |
| 4915 Maplewood St Detroit, MI | 3.0 | 1.0 | 1324 | $1,100 | $0.83 | 16d | 1 | 0.78mi |
| 4345 W Euclid St Unit 2 Detroit, MI | 3.0 | 1.0 | 1300 | $1,450 | $1.12 | 24d | 1 | 0.82mi |
| 4345 W Euclid St Unit 1 Detroit, MI | 3.0 | 1.0 | 1300 | $1,400 | $1.08 | 24d | 1 | 0.82mi |
| 3757 Blaine St Detroit, MI | 3.0 | 1.0 | 1169 | $1,480 | $1.27 | 16d | 1 | 1.07mi |
| 3259 W Philadelphia St Detroit, MI | 3.0 | 1.0 | 1293 | $1,400 | $1.08 | 16d | 1 | 1.10mi |
| 3786 Carter St Unit 2 Detroit, MI | 3.0 | 1.0 | 1400 | $1,100 | $0.79 | 24d | 1 | 1.13mi |
| 7424 Wykes St Detroit, MI | 3.0 | 1.0 | 1200 | $1,100 | $0.92 | 43d | 1 | 1.22mi |
| 3220 Gladstone St Detroit, MI | 3.0 | 1.0 | 1248 | $1,200 | $0.96 | 43d | 1 | 1.31mi |
| 6144 16th St Detroit, MI | 3.0 | 1.0 | 1284 | $1,200 | $0.93 | 43d | 1 | 1.33mi |
| 2504 W Euclid St Unit 2504 Detroit, MI | 3.0 | 1.0 | 1475 | $1,650 | $1.12 | 43d | 1 | 1.44mi |
| 2506 W Euclid St Detroit, MI | 3.0 | 1.0 | 1475 | $1,675 | $1.14 | 43d | 1 | 1.44mi |
| 2504 W Euclid St Unit 2506 Detroit, MI | 3.0 | 1.0 | 1475 | $1,675 | $1.14 | 43d | 1 | 1.44mi |
| 2531 Pingree St Unit 2 (FL 2) Detroit, MI | 3.0 | 1.0 | 893 | $1,100 | $1.23 | 2d | 1 | 1.48mi |
Listing history 4 events
-
2026-06-18days on market $74,900 Active 3 DOM
-
2026-06-17days on market $74,900 Active 2 DOM
-
2026-06-15remarks 699-char remark
Show marketing remark (707 chars)
Investor special with value-add potential! This Detroit duplex features two separate 2-bedroom, 1-bath units with private entrances. The upper unit is rent-ready with updated flooring, refreshed kitchen cabinetry, and an updated bathroom, while the lower unit requires renovation, providing an opportunity to increase value and maximize rental income. Ideal for investors seeking a fix-and-hold, BRRRR, or portfolio addition. Separate units offer flexibility for future income generation, and the rent-ready upper unit allows improvements to be phased as needed. The basement and separate living spaces add to the property's potential. Property sold as-is. Buyer and buyer's agent to verify all information.
-
2026-06-15$74,900 Active 1 DOM
Show marketing remark (707 chars)
Investor special with value-add potential! This Detroit duplex features two separate 2-bedroom, 1-bath units with private entrances. The upper unit is rent-ready with updated flooring, refreshed kitchen cabinetry, and an updated bathroom, while the lower unit requires renovation, providing an opportunity to increase value and maximize rental income. Ideal for investors seeking a fix-and-hold, BRRRR, or portfolio addition. Separate units offer flexibility for future income generation, and the rent-ready upper unit allows improvements to be phased as needed. The basement and separate living spaces add to the property's potential. Property sold as-is. Buyer and buyer's agent to verify all information.
ⓘ Source: listings_history table (triggers on properties + properties_extension) + one-shot
backfill from property_details.listing_events for pre-trigger history.
Tax reassessment forecast MI · Partial reset (capped growth)
- Current annual tax
- $1,051 · $88/mo
- Projected year-2 tax
- $1,102 · $92/mo
- Expected delta
- +$51/yr (+$4/mo · 4.9%)
ⓘ Screening estimate from a state-policy table — verify with the county assessor before closing.
Climate risk First Street
- Flood 1/10 Low FEMA zone X (unshaded) · 0% chance over 30 yrs
- Wildfire 1/10 Low
- Heat 3/10 Moderate 7 d/yr ≥97°F today · 15 d/yr by 30 yrs out
- Wind 2/10 Low
- Air quality 4/10 Moderate 4 unhealthy d/yr today · 6 by 30 yrs out
Nearby sold comps map
Loading sold comps map…
Walkable amenities ~0.75 mi
Loading nearby amenities…
Taxation est. · year 1
- Rental income
- $20,796
- − Mortgage interest
- −$4,196
- − Property taxes
- −$1,051
- − Insurance
- −$374
- − Repairs & maintenance
- −$1,664
- − Management
- −$1,664
- − Depreciation
- −$2,179
- Taxable income
- $9,668
- Est. tax owed @ 24.0%
- −$2,320
- After-tax cash flow
- $7,969/yr
For passive investors: Depreciation is non-cash, so a rental often shows a tax loss while cash-flowing — sheltering income. Rental losses are passive: they offset passive income freely, and up to $25,000/yr can offset ordinary (W-2) income if you actively participate and your MAGI is under $100k (phasing out to $0 by $150k); unused losses carry forward. On sale, claimed depreciation is recaptured at up to 25%, and gains may owe capital-gains tax (a 1031 exchange can defer both). Figures are a year-1 estimate at your 24.0% rate — not tax advice; consult a CPA.
Schools (NCES district)
- District
- Detroit Public Schools Community District
- NCES district ID
- 2601103
- Math proficiency
- 10% ▼ -2.00%
- Reading proficiency
- 24% ▲ 6.00%
- Median HH income
- $25,815
- Composite
- 13.06/100
- National rank
- #9564
- State rank
- #499 of 540 in MI
Livability — Detroit
- Score
- 73/100
- State rank
- #218
- US rank
- #5427
Category grades
Schools grade is shown separately in the Schools card above.
Census & demographics
- Census place
- Detroit, MI
- City population
- 572,865
- Population (ZIP)
- 26,925
Population outlook (Wayne County) Hauer SSP2
- Today (2025)
- 1,675,273 people
- By 2030
- 1,620,300 · -3.3%
- By 2040
- 1,502,341 · -10.3%
- By 2050
- 1,384,039 · -17.4%
- By 2075
- 1,124,592 · -32.9%
- By 2100
- 881,193 · -47.4%
Race, ethnicity, and origin ACS 2023
- Neighborhood character
- Diverse neighborhood (Simpson 0.58)
- Race & ethnicity
- Hispanic / Latino 59% White 20% Black 17% Two or more races 16% Native American 1%
- Hispanic origin (detail)
- Mexican 44% Puerto Rican 5% Dominican 1%
- Common ancestry
- Romanian 2% Danish 1%
- Foreign-born
- 27% · Canada, Jamaica
- Languages at home
- 39% English-only · Spanish 50% Arabic 10%
Political lean MEDSL · Wayne
- 2024 margin
- Strong D (+29.0) · D 62.7% · R 33.7% · Other 3.6%
- 2008→2024 swing
- -20.5pp toward R · 2008: 49.5pp · 2024: 29.0pp
- All cycles
- 2024: D+29.0 2020: D+38.1 2016: D+37.3 2012: D+46.9 2008: D+49.5
Not yet ingested
- Civics
- —
Market trends
- HPI YoY
- ▼ -85.82%
- Current HPI
- 299.5909
- Rent YoY
- —
- Metro
- —
- State GDP YoY
- ▲ 1.37%
- F500 in state
- 28
Industry mix (Fortune 500 HQ in MI)
| Industry | F500 HQs | Revenue |
|---|---|---|
| Automotive Parts | 3 | $48B |
|
||
| Automotive | 2 | $372B |
|
||
| Chemicals | 1 | $45B |
|
||
| Automotive Retail | 1 | $29B |
|
||
| Healthcare / Medical Devices | 1 | $23B |
|
||
| Automotive Technology | 1 | $20B |
|
||
Price history
+732.2% since first listed26 events — show timeline
- 2026-06-15 Listed $74,900 REALCOMP
- 2026-06-15 Listed $74,900 MiRealSource-MiMLS
- 2026-04-18 Price Changed $750 APPFOLIO
- 2026-02-19 Listed for Rent $775 APPFOLIO
- 2024-03-14 Rental Removed $775 APPFOLIO
- 2024-01-28 Price Changed $775 APPFOLIO
- 2023-10-27 Listed for Rent $850 APPFOLIO
- 2022-06-10 Sold (MLS) $40,000 MiRealSource-MiMLS
- 2022-06-10 Sold (MLS) $40,000 MiRealSource-MiMLS
- 2022-06-10 Sold (MLS) $40,000 REALCOMP
- 2022-06-10 Sold (MLS) $40,000 REALCOMP
- 2022-05-31 Pending — MiRealSource-MiMLS
- 2022-05-31 Pending — MiRealSource-MiMLS
- 2022-05-31 Pending — REALCOMP
- 2022-05-31 Pending — REALCOMP
- 2022-05-24 Listed $45,000 MiRealSource-MiMLS
- 2022-05-24 Listed $45,000 REALCOMP
- 2022-05-16 Price Changed $45,000 MiRealSource-MiMLS
- 2022-05-16 Price Changed $45,000 REALCOMP
- 2022-05-11 Listed $54,900 MiRealSource-MiMLS
- 2022-05-11 Listed $54,900 REALCOMP
- 2021-07-05 Listing Removed — REALCOMP
- 2021-07-05 Listing Removed — MiRealSource-MiMLS
- 2021-07-03 Listed $29,900 MiRealSource-MiMLS
- 2021-07-03 Listed $29,900 REALCOMP
- 1996-07-19 Sold (Public Records) $9,000 Public Records
Property tax history
+0.1%/yrLatest (2025): $1,051 · +48.4% YoY. Source: county tax records.
Cash-flow waterfall
monthlySold comps — $/sqft
last 12 mo · ≤1 miLoading sold comps…