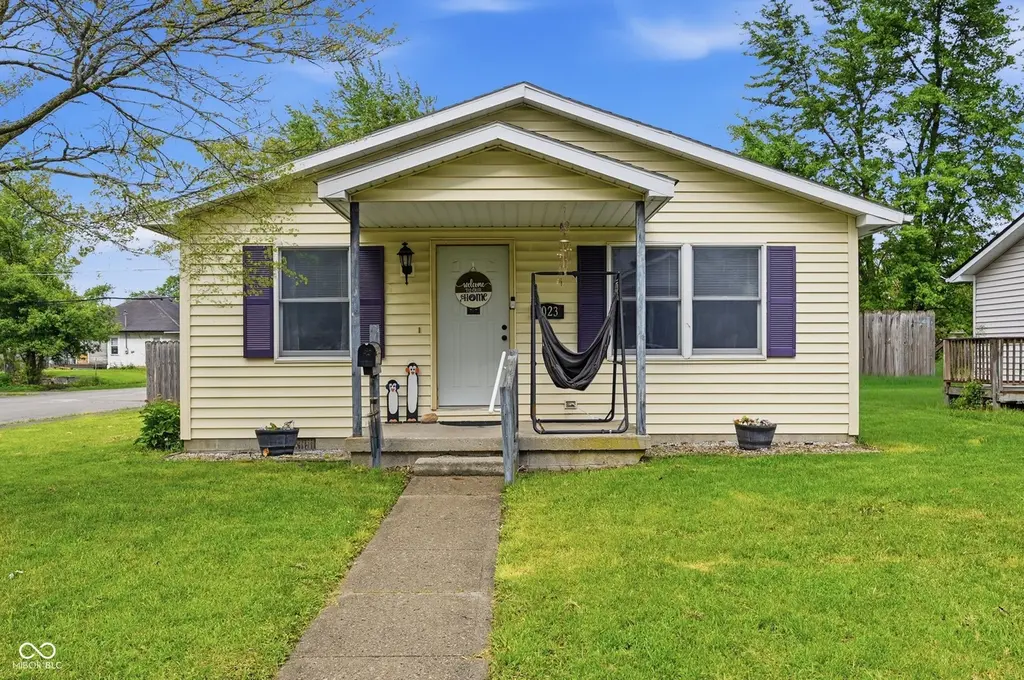
1023 S 20th St · New Castle, IN
Flood risk 1/10 · Minimal
- FEMA flood zone
- X (unshaded)
- Chance of flooding over 30 yrs
- 0.0%
- Est. flood insurance / yr
- $507 – $1,088
Fire risk 1/10 · Minimal
- Est. fire insurance / yr
- $717 – $1,331
Heat risk 3/10 · Minor
- Hot days now (above 99°F)
- 7 days/yr
- Hot days in 30 yrs
- 18 days/yr
Wind risk 2/10 · Minimal
- Chance of severe wind over 30 yrs
- 1.0%
Air-quality risk 2/10 · Minimal
- Unhealthy air days now
- 1 days/yr
- Unhealthy air days in 30 yrs
- 2 days/yr
Risk factors via First Street. Map © Google.
Why this score? — see what drove the D- grade
The composite is a weighted blend of 9 inputs, each scored 0–100. Each bar is that input's sub-score; the figure is the points it added to the 100-point composite (weight × sub-score).
- Cash flow +14.1/30.0
- DSCR +4.3/10.0
- Livability +3.8/5.0
- Rent growth +3.6/5.0
- 1% rule +3.0/10.0
- ARV discount +2.9/15.0
- Schools +2.7/10.0
- Condition / age +2.5/5.0
- Appreciation +0.0/10.0
$119,900
🖨 Deal sheet (PDF) 📄 Offer letter ✓ Due diligence
Listing remarks
Welcome home to this charming 3-bedroom residence situated on a desirable corner lot! Inside, you'll find a recently remodeled kitchen that offers a fresh, updated feel, complete with included appliances and the option for a gas stove. The functional layout provides comfortable living spaces that are easy to maintain and enjoy. Step outside to the open patio, perfect for relaxing, grilling, or enjoying time with family and friends. The fully fenced backyard offers privacy and space for pets, play, or gardening. Whether you're a first-time homebuyer or looking to downsize, this affordable and move-in-ready home is one you won't want to miss!
Key facts
- Open patio
- Remodeled kitchen
- Included appliances
Tags
Property features AI
Exterior
- Parking: Alley access; On-street parking
- Security: Smoke detector(s)
- Utilities: Public water; Municipal sewer connected; No solid waste service indicated
- Home design: Single-family residence; One level
- Construction: Vinyl siding; Block foundation
- Exterior features: Covered patio; Patio area; Fire pit; Full privacy fence; Corner lot with sidewalks and mature trees
Interior
- Kitchen: Kitchen (12x12); Dishwasher; Microwave; Electric oven; Refrigerator
- Bedrooms: Three bedrooms on the main level (Bedroom 2: 10x12; Bedroom 3: 9x9)
- Bathrooms: One full bathroom on the main level
- Heating & cooling: Electric forced-air heating; Window air-conditioning units
- Interior features: Living room (14x13); Additional main-level room (10x12)
- Laundry & utility: Washer; Dryer; Main-level laundry
Neighborhood map
What this means for you Summary
Snapshot
- This is a 2-bed/1.0-bath single-family listed at $120k.
Deal economics
- At list price, monthly cash flow is $17 ($203/yr) — positive.
- The deal already cash-flows at list — no discount required.
- To meet the 1% rule (rent ≥ 1% of price), the offer needs to be $96k (20.1% below list).
- Recommended offer: $96k (20.1% below list) — sets the bar for 1% rule.
- Cap rate 6.5% vs local median 4.7% in New Castle — top-decile yield for the area; either an underpriced asset or a hidden risk that comps aren't pricing in. Stress-test before assuming the spread holds.
Location & tenants
- Location reads 75/100 on livability (#64 in IN, #4,219 nationally) — a middle-class / working-renter tenant base. Strengths: crime A+, cost of living A+, housing A+; Watch: amenities F, commute F, employment D-.
- New Castle Community School Corporation (town): math 30% / reading 35% proficiency, ranked #229 of 301 in IN (top 76%) — families likely to look elsewhere, expect single-tenant / working-renter base with shorter leases.
- Zoned schools: New Castle Middle School (math 20% / reading 31%, grade F, #243 of 330 statewide, top 74%, 666 students, 61% FRL); New Castle High School (math 27% / reading 52%, grade F, #221 of 369 statewide, top 63%, 836 students, 56% FRL).
- Market conditions: Rents rising fast (+4.6%/yr); 217 active listings in the ZIP; 3 comparable units currently listed for rent nearby; rentals leasing fast (median 4d on market — plan ~1-2 weeks tenant-placement turnaround); 47 units permitted in Henry County in 2024 (0 in 5+ unit buildings).
Forward outlook
- Local home prices are declining (-3.0%/yr); year-one equity from $829 of loan paydown is wiped out by about $4k of value loss. Plan a longer hold.
- Henry County population projected at -12% by 2050 — secular population decline; favor cash flow + early exit over multi-decade hold.
Negotiation context
- Only 4 days on market — expect competitive offers; lowballing is unlikely to land.
- 9 sale attempts since 21y ago with the ask held roughly flat each time — persistent listings suggest the price (not the market) is what's stuck; bring a comps-based counter.
- Current owner paid $62k; list at $120k implies a 93% gain — meaningful room to come down on a strong offer.
Questions for the listing agent
- Is there a deadline driving the sale (1031 exchange, divorce, estate, relocation)? That informs how much negotiation room exists.
- Schools are D-rated, which usually means shorter tenancies and higher turnover. Who's the typical renter profile here, and what's been the actual vacancy rate?
- The area grade is low — what's the realistic commute time and amenity access for the typical tenant pool here? Any planned neighborhood developments (good or bad) we should know about?
- What's the average days-on-market for RENTAL listings here right now (not sales)? A rising rental-DOM trend means longer vacancies and softer asking-rent achievability than the comps imply.
- What's the recent tenant-quality profile in this submarket — average credit score on applications, eviction rate, late-payment / NSF rate, and stable-employment percentage? A property-management company in the area should have these aggregated.
- How much new for-sale + rental construction is in the pipeline within 1–3 miles? Heavy new supply typically softens prices + rents 12–24 months out; constrained supply supports both.
Investment metrics
- 1% rule
- 0.80% ✗
- Cap rate
- 6.46%
- Cash-on-cash
- 0.60%
- DSCR
- 1.03
- GRM
- 10.4
CMA / ARV
- ARV (on-the-fly)
- $108,864
- Comps found
- 12
Show comp detail 12 sales within ~0.75 mi
| Address | Dist | Beds/Ba | Sqft | Sold | Price | $/sf | Match |
|---|---|---|---|---|---|---|---|
| 1016 S 19th St | 0.04mi | 2/1.0 | 1,008 (0%) | 6mo | $114,900 | $114 | 93 |
| 2128 Grand Ave | 0.13mi | 2/1.0 | 861 (-15%) | 0mo | $93,000 | $108 | 70 |
| 1610 Roosevelt Ave | 0.54mi | 2/1.0 | 1,000 (-1%) | 6mo | $145,000 | $145 | 68 |
| 1725 Hunter Ave | 0.67mi | 3/1.0 (+1) | 1,007 (-0%) | 1mo | $110,000 | $109 | 63 |
| 2102 S 18th St | 0.66mi | 2/1.0 | 988 (-2%) | 9mo | $99,900 | $101 | 59 |
| 1007 S 24th St | 0.30mi | 2/1.0 | 1,150 (+14%) | 6mo | $30,000 | $26 | 57 |
| 311 Park Ave | 0.49mi | 2/1.0 | 915 (-9%) | 7mo | $72,000 | $79 | 56 |
| 1909 Cherrywood Ave | 0.63mi | 2/1.0 | 922 (-8%) | 6mo | $147,500 | $160 | 52 |
| 2114 S 18th St | 0.67mi | 2/1.0 | 912 (-10%) | 3mo | $50,000 | $55 | 50 |
| 2105 Cherrywood Ave | 0.73mi | 2/1.0 | 1,080 (+7%) | 8mo | $145,000 | $134 | 47 |
| 1929 N Ave | 0.66mi | 3/1.5 (+1) | 936 (-7%) | 4mo | $89,900 | $96 | 47 |
| 2134 Vine St | 0.74mi | 2/1.0 | 1,140 (+13%) | 7mo | $99,900 | $88 | 38 |
Match score weights: distance 35% · size 25% · config 20% · recency 20%. Top-matched comps best support the ARV.
Projected returns pro-forma
-3.0% appreciation · 4.59% rent growth · sell at horizon
- IRR
- -13.8%
- Equity multiple
- 0.50×
- Total profit
- $-16,835
- Equity at exit
- $17,877
- IRR
- -2.9%
- Equity multiple
- 0.80×
- Total profit
- $-6,838
- Equity at exit
- $10,367
Cash invested: $33,572 (down + closing). Projections, not guarantees.
Landlord ↔ Tenant lean methodology
- Overall (STATE)
- 90 Strongly Landlord-Friendly
- State Indiana
- 90 Strongly Landlord-Friendly · R+11
- County
- — inherits STATE
- City
- — inherits STATE
ZIP-level market 47362
- Home prices YoY
- -16.0%
- Rents YoY
- 4.6%
- Active inventory
- 217
- Price-to-rent
- 10.4×
Monthly cashflow live
- Estimated rent
- $958 medium interval (Pro) →
- Mortgage (P&I)
- −$629
- Tax from tax record
- −$61 /mo · $732/yr
- Insurance
- −$50
- HOA
- −$0
- Vacancy / Maint / Mgmt
- −$201
- Net cashflow
- $17
Break-even live
Sensitivity live
| Price | -10% $85 | -5% $51 | +0% $17 | +5% $-17 | +10% $-51 |
|---|---|---|---|---|---|
| Rent | -10% $-59 | -5% $-21 | +0% $17 | +5% $55 | +10% $93 |
| Rate | -1.0pp $77 | -0.5pp $47 | base $17 | +0.5pp $-14 | +1.0pp $-46 |
UW: 25.0% down · 7.5% · 30yr · 1.5% tax · 5.0% vac · 8.0% maint · 8.0% mgmt
Financing live
Cash to close
- Down payment
- $29,975
- Closing costs
- $3,597
- Reserves months
- —
- Total cash needed
- —
Loan-product check · same deal, 3 products live
Conventional
25% down · 7.5% · 30yr
- Down + closing
- —
- Monthly P&I
- —
- Monthly cashflow
- —
- DSCR
- —
- Eligible?
- —
Personal DTI + credit; lowest rate.
DSCR
20% down · 8.5% · 30yr
- Down + closing
- —
- Monthly P&I
- —
- Monthly cashflow
- —
- DSCR
- —
- Eligible?
- —
No personal income docs; deal must DSCR.
Hard money
10% down · 12.0% · 12mo
- Down + closing
- —
- Monthly P&I
- —
- Monthly cashflow
- —
- DSCR
- —
- Eligible?
- —
Short-term bridge; refi at stabilization.
Rent comps 3 comps
| Address | Beds | Baths | Sqft | Rent | $/sqft | DOM | Units | Dist |
|---|---|---|---|---|---|---|---|---|
| 1216 S 19th St New Castle, IN | 2.0 | 1.0 | 824 | $1,000 | $1.21 | 25d | 1 | 0.15mi |
| 940 S 15th St New Castle, IN | 1.0–2.0 | 1.0–1.5 | 816 | $950 | $1.16 | 0d | 2 | 0.30mi |
| 1618 P Ave New Castle, IN | 3.0 | 1.5 | 1064 | $950 | $0.89 | 3d | 1 | 0.81mi |
Listing history 4 events
-
2026-06-22days on market $119,900 Active 4 DOM
-
2026-06-21days on market $119,900 Active 3 DOM
-
2026-06-18remarks 648-char remark
-
2026-06-18$119,900 Active 1 DOM
ⓘ Source: listings_history table (triggers on properties + properties_extension) + one-shot
backfill from property_details.listing_events for pre-trigger history.
Tax reassessment forecast IN · Partial reset (capped growth)
- Current annual tax
- $732 · $61/mo
- Projected year-2 tax
- $876 · $73/mo
- Expected delta
- +$143/yr (+$12/mo · 19.6%)
ⓘ Screening estimate from a state-policy table — verify with the county assessor before closing.
Climate risk First Street
- Flood 1/10 Low FEMA zone X (unshaded) · 0% chance over 30 yrs
- Wildfire 1/10 Low
- Heat 3/10 Moderate 7 d/yr ≥99°F today · 18 d/yr by 30 yrs out
- Wind 2/10 Low 100% chance of damaging wind over 30 yrs
- Air quality 2/10 Low 1 unhealthy d/yr today · 2 by 30 yrs out
Nearby sold comps map
Loading sold comps map…
Walkable amenities ~0.75 mi
Loading nearby amenities…
Taxation est. · year 1
- Rental income
- $11,494
- − Mortgage interest
- −$6,716
- − Property taxes
- −$732
- − Insurance
- −$600
- − Repairs & maintenance
- −$920
- − Management
- −$920
- − Depreciation
- −$3,488
- Taxable loss
- −$1,881
- Est. tax savings @ 24.0%
- +$452
- After-tax cash flow
- $654/yr
For passive investors: Depreciation is non-cash, so a rental often shows a tax loss while cash-flowing — sheltering income. Rental losses are passive: they offset passive income freely, and up to $25,000/yr can offset ordinary (W-2) income if you actively participate and your MAGI is under $100k (phasing out to $0 by $150k); unused losses carry forward. On sale, claimed depreciation is recaptured at up to 25%, and gains may owe capital-gains tax (a 1031 exchange can defer both). Figures are a year-1 estimate at your 24.0% rate — not tax advice; consult a CPA.
Schools (NCES district)
- District
- New Castle Community School Corporation
- NCES district ID
- 1807440
- Math proficiency
- 30% ▼ -13.00%
- Reading proficiency
- 35% ▼ -9.00%
- Median HH income
- $36,717
- Composite
- 26.99/100
- National rank
- #7067
- State rank
- #229 of 301 in IN
Livability — New Castle
- Score
- 75/100
- State rank
- #64
- US rank
- #4219
Category grades
Schools grade is shown separately in the Schools card above.
Census & demographics
- Census place
- New Castle, IN
- County
- Henry County · 29,337 people
- City population
- 29,337
- Metro
- New Castle, IN
- Population (ZIP)
- 29,337
- Household income
- $60,258
- Rent vs Own
- Severe rent burden
- 545.0
Population outlook (Henry County) Hauer SSP2
- Today (2025)
- 48,028 people
- By 2030
- 47,125 · -1.9%
- By 2040
- 44,820 · -6.7%
- By 2050
- 42,207 · -12.1%
- By 2075
- 35,814 · -25.4%
- By 2100
- 26,779 · -44.2%
Race, ethnicity, and origin ACS 2023
- Neighborhood character
- Predominantly White (90%)
- Race & ethnicity
- White 90% Two or more races 3% Black 3% Hispanic / Latino 3%
- Common ancestry
- Italian 2% Slovak 1% Lithuanian 1%
- Foreign-born
- 2% · Canada
- Languages at home
- 97% English-only · Spanish 2%
Political lean MEDSL · Henry
- 2024 margin
- Solid R (+47.7) · D 25.3% · R 73.0% · Other 1.7%
- 2008→2024 swing
- -43.8pp toward R · 2008: -3.9pp · 2024: -47.7pp
- All cycles
- 2024: R+47.7 2020: R+45.2 2016: R+43.7 2012: R+17.0 2008: R+3.9
Not yet ingested
- Civics
- —
Market trends
- HPI YoY
- ▼ -43.70%
- Current HPI
- 228.8885
- Rent YoY
- ▲ 4.59%
- Metro
- New Castle, IN
- State GDP YoY
- ▲ 2.90%
- F500 in state
- 18
Industry mix (Fortune 500 HQ in IN)
| Industry | F500 HQs | Revenue |
|---|---|---|
| Industrial Machinery | 2 | $37B |
|
||
| Healthcare | 1 | $177B |
|
||
| Pharmaceuticals | 1 | $45B |
|
||
| Metals / Steel | 1 | $18B |
|
||
| Agriculture | 1 | $17B |
|
||
| Packaging | 1 | $12B |
|
||
Price history
+71.5% since first listed14 events — show timeline
- 2026-06-18 Listed $119,900 MIBOR as Distributed by MLS Grid
- 2019-06-10 Sold (MLS) $62,000 RRELMS
- 2019-06-10 Sold (MLS) $62,000 IRMLS
- 2019-06-10 Sold (MLS) $62,000 MIBOR as Distributed by MLS Grid
- 2019-04-11 Listed $59,000 RRELMS
- 2019-04-11 Listed $59,000 MIBOR as Distributed by MLS Grid
- 2019-04-11 Listed $59,000 IRMLS
- 2018-08-31 Listed $61,900 IRMLS
- 2017-12-06 Listing Removed — MIBOR as Distributed by MLS Grid
- 2017-09-06 Listed $54,900 IRMLS
- 2017-09-05 Listed $54,900 MIBOR as Distributed by MLS Grid
- 2017-06-01 Listed $62,000 IRMLS
- 2006-05-31 Listing Removed — MIBOR as Distributed by MLS Grid
- 2005-08-29 Listed $69,900 MIBOR as Distributed by MLS Grid
Property tax history
+41.6%/yrLatest (2024): $732 · +12.7% YoY. Source: county tax records.
Cash-flow waterfall
monthlySold comps — $/sqft
last 12 mo · ≤1 miLoading sold comps…