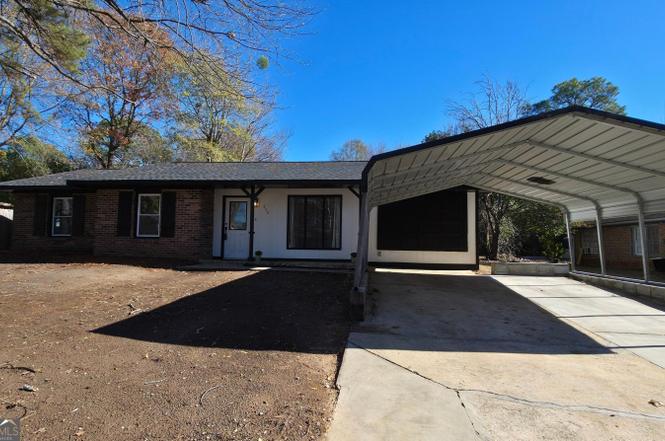
213 Stratford Dr · Warner Robins, GA
Flood risk 1/10 · Minimal
- FEMA flood zone
- X (unshaded)
- Chance of flooding over 30 yrs
- 0.0%
- Est. flood insurance / yr
- $507 – $1,088
Fire risk 2/10 · Minimal
- Est. fire insurance / yr
- $963 – $1,789
Heat risk 7/10 · Major
- Hot days now (above 108°F)
- 7 days/yr
- Hot days in 30 yrs
- 18 days/yr
Wind risk 7/10 · Major
- Chance of severe wind over 30 yrs
- 77.0%
Air-quality risk 3/10 · Minor
- Unhealthy air days now
- 2 days/yr
- Unhealthy air days in 30 yrs
- 4 days/yr
Risk factors via First Street. Map © Google.
Why this score? — see what drove the D- grade
The composite is a weighted blend of 9 inputs, each scored 0–100. Each bar is that input's sub-score; the figure is the points it added to the 100-point composite (weight × sub-score).
- Cash flow +14.7/30.0
- DSCR +4.5/10.0
- Schools +3.9/10.0
- Livability +3.2/5.0
- 1% rule +3.0/10.0
- Rent growth +2.9/5.0
- Condition / age +2.5/5.0
- ARV discount +0.6/15.0
- Appreciation +0.0/10.0
$172,500
🖨 Deal sheet (PDF) 📄 Offer letter ✓ Due diligence
Listing remarks
Looking for a move-in-ready home that feels fresh and modern? This standout 3-bedroom, 2-bath beauty has been thoughtfully updated to offer style, comfort, and peace of mind. The heavy lifting has been handled for you with a brand-new roof, HVAC system, windows, stainless steel appliances, light fixtures, doors, and so much more! The kitchen and bathrooms have been revitalized with refreshed cabinetry, new toilets, and updated sinks and fixtures. This home is ready for you to simply move in and enjoy. Schedule your tour today! Disclosure: One of the sellers is a licensed real estate brokerage in the State of Georgia.
Key facts
- 2-car carport
- Fully remodeled
- Turnkey
Tags
Neighborhood map
What this means for you Summary
Snapshot
- This is a 3-bed/1.5-bath single-family listed at $172k.
Deal economics
- At list price, monthly cash flow is $44 ($531/yr) — positive.
- The deal already cash-flows at list — no discount required.
- To meet the 1% rule (rent ≥ 1% of price), the offer needs to be $137k (20.4% below list).
- Recommended offer: $137k (20.4% below list) — sets the bar for 1% rule.
- Cap rate 6.6% vs local median 4.9% in Warner Robins — top-decile yield for the area; either an underpriced asset or a hidden risk that comps aren't pricing in. Stress-test before assuming the spread holds.
Location & tenants
- Location reads 65/100 on livability (#227 in GA) — a middle-class / working-renter tenant base. Strengths: cost of living A+, housing A+, health & safety A+; Watch: employment D+, crime F, amenities F.
- Houston County (urban): math 43% / reading 46% proficiency, ranked #23 of 174 in GA (top 13%) — families likely to look elsewhere, expect single-tenant / working-renter base with shorter leases.
- Zoned schools: Miller Elementary School (math 22% / reading 22%, grade F, #810 of 1,228 statewide, top 69%, 538 students, 84% FRL); Warner Robins Middle School (math 25% / reading 37%, grade F, #237 of 470 statewide, top 51%, 813 students, 84% FRL); Warner Robins High School (math 7% / reading 21%, grade F, #322 of 424 statewide, top 76%, 1,816 students, 84% FRL) — zoned schools average 84% FRL vs 46% district-wide (38 pts higher); higher-poverty schools than district average — tighter screening recommended.
- Zoned-school proficiency averages 22% at this address vs 44% district-wide (-22 pts) — the specific schools serving this property underperform the Houston County average; the district grade overstates school quality for this exact location.
- Market conditions: Rents rising (+1.7%/yr); 295 active listings in the ZIP; 21 comparable units currently listed for rent nearby; rentals lingering (median 46d on market — plan ~5-8 weeks vacancy on turnover, expect pricing pressure); 67% of comp listings sitting > 30 days — soft ceiling on asking rent; solid renter incomes; 1,545 units permitted in Houston County in 2024 (336 in 5+ unit buildings).
Forward outlook
- Local home prices are declining (-3.0%/yr); year-one equity from $1k of loan paydown is wiped out by about $5k of value loss. Plan a longer hold.
- Houston County population projected at +22% by 2050 — long-run rental-demand tailwind backs the buy-and-hold thesis.
Negotiation context
- It's been on market 45 days — a 3% lower offer ($167k) is reasonable based on typical stale-listing flexibility.
- 4 sale attempts; this cycle's ask has dropped $22k (12%) from the opening price — seller is motivated, your offer sets the floor, not the list.
- Current owner paid $78k; list at $172k implies a 122% gain — meaningful room to come down on a strong offer.
Risks & watch-outs
- Climate carrying-cost: major wind risk, 77% chance of damaging wind over 30y; extreme-heat days projected 7→18/yr by 2055 (HVAC capex compounding) — expect insurance premiums to compound above CPI over the hold.
Questions for the listing agent
- It's been on market 45 days. Have you received any prior offers? Is the seller open to a 20% concession, seller financing, or rate buy-down credit?
- Built in 1971 — when were the roof, HVAC, electrical panel, plumbing, and water heater last replaced?
- Is there a deadline driving the sale (1031 exchange, divorce, estate, relocation)? That informs how much negotiation room exists.
- Schools are D-rated, which usually means shorter tenancies and higher turnover. Who's the typical renter profile here, and what's been the actual vacancy rate?
- Crime grade is F in this area — have there been break-ins, vandalism, or insurance claims at this property in the last 3 years? What carrier currently insures it and at what premium?
- The area grade is low — what's the realistic commute time and amenity access for the typical tenant pool here? Any planned neighborhood developments (good or bad) we should know about?
- What's the average days-on-market for RENTAL listings here right now (not sales)? A rising rental-DOM trend means longer vacancies and softer asking-rent achievability than the comps imply.
- What's the recent tenant-quality profile in this submarket — average credit score on applications, eviction rate, late-payment / NSF rate, and stable-employment percentage? A property-management company in the area should have these aggregated.
- How much new for-sale + rental construction is in the pipeline within 1–3 miles? Heavy new supply typically softens prices + rents 12–24 months out; constrained supply supports both.
Investment metrics
- 1% rule
- 0.80% ✗
- Cap rate
- 6.60%
- Cash-on-cash
- 1.10%
- DSCR
- 1.05
- GRM
- 10.5
CMA / ARV
- ARV (on-the-fly)
- $149,632
- Comps found
- 12
Show comp detail 12 sales within ~0.75 mi
| Address | Dist | Beds/Ba | Sqft | Sold | Price | $/sf | Match |
|---|---|---|---|---|---|---|---|
| 213 Stratford Dr | 0.00mi | 3/2.0 | 1,336 (0%) | 1mo | $172,500 | $129 | 98 |
| 104 Oxford Ln | 0.09mi | 3/2.0 | 1,262 (-6%) | 2mo | $145,000 | $115 | 83 |
| 610 Cornelia Dr | 0.42mi | 3/2.0 | 1,340 (+0%) | 1mo | $209,000 | $156 | 77 |
| 113 Sandra Ave | 0.33mi | 3/2.0 | 1,390 (+4%) | 6mo | $136,000 | $98 | 71 |
| 310 Orchard Way | 0.48mi | 3/2.0 | 1,326 (-1%) | 6mo | $142,400 | $107 | 70 |
| 207 Kingsway Dr | 0.64mi | 2/2.0 (-1) | 1,339 (+0%) | 2mo | $134,500 | $100 | 61 |
| 329 Orchard Way | 0.56mi | 3/2.0 | 1,294 (-3%) | 8mo | $120,000 | $93 | 60 |
| 122 Driftwood Ter | 0.57mi | 3/2.0 | 1,413 (+6%) | 8mo | $158,900 | $112 | 56 |
| 344 Orchard Way | 0.58mi | 3/2.0 | 1,214 (-9%) | 4mo | $140,000 | $115 | 52 |
| 111 Forrester Dr | 0.63mi | 3/2.0 | 1,438 (+8%) | 5mo | $145,000 | $101 | 52 |
| 139 Vernon Dr | 0.46mi | 2/1.0 (-1) | 1,476 (+10%) | 3mo | $130,000 | $88 | 52 |
| 208 Southview Ave | 0.70mi | 3/2.0 | 1,136 (-15%) | 1mo | $142,000 | $125 | 39 |
Match score weights: distance 35% · size 25% · config 20% · recency 20%. Top-matched comps best support the ARV.
Projected returns pro-forma
-3.0% appreciation · 1.67% rent growth · sell at horizon
- IRR
- -15.9%
- Equity multiple
- 0.44×
- Total profit
- $-27,019
- Equity at exit
- $25,720
- IRR
- -9.8%
- Equity multiple
- 0.43×
- Total profit
- $-27,437
- Equity at exit
- $14,915
Cash invested: $48,300 (down + closing). Projections, not guarantees.
Landlord ↔ Tenant lean methodology
- Overall (STATE)
- 90 Strongly Landlord-Friendly
- State Georgia
- 90 Strongly Landlord-Friendly · R+3
- County
- — inherits STATE
- City
- — inherits STATE
ZIP-level market 31088
- Rents YoY
- 1.7%
- Active inventory
- 295
- Price-to-rent
- 10.5×
Monthly cashflow live
- Estimated rent
- $1,373 high interval (Pro) →
- Mortgage (P&I)
- −$905
- Tax from tax record
- −$64 /mo · $769/yr
- Insurance
- −$72
- HOA
- −$0
- Vacancy / Maint / Mgmt
- −$288
- Net cashflow
- $44
Break-even live
Sensitivity live
| Price | -10% $142 | -5% $93 | +0% $44 | +5% $-5 | +10% $-53 |
|---|---|---|---|---|---|
| Rent | -10% $-64 | -5% $-10 | +0% $44 | +5% $99 | +10% $153 |
| Rate | -1.0pp $131 | -0.5pp $88 | base $44 | +0.5pp $0 | +1.0pp $-46 |
UW: 25.0% down · 7.5% · 30yr · 1.5% tax · 5.0% vac · 8.0% maint · 8.0% mgmt
Financing live
Cash to close
- Down payment
- $43,125
- Closing costs
- $5,175
- Reserves months
- —
- Total cash needed
- —
Loan-product check · same deal, 3 products live
Conventional
25% down · 7.5% · 30yr
- Down + closing
- —
- Monthly P&I
- —
- Monthly cashflow
- —
- DSCR
- —
- Eligible?
- —
Personal DTI + credit; lowest rate.
DSCR
20% down · 8.5% · 30yr
- Down + closing
- —
- Monthly P&I
- —
- Monthly cashflow
- —
- DSCR
- —
- Eligible?
- —
No personal income docs; deal must DSCR.
Hard money
10% down · 12.0% · 12mo
- Down + closing
- —
- Monthly P&I
- —
- Monthly cashflow
- —
- DSCR
- —
- Eligible?
- —
Short-term bridge; refi at stabilization.
Rent comps 21 comps
| Address | Beds | Baths | Sqft | Rent | $/sqft | DOM | Units | Dist |
|---|---|---|---|---|---|---|---|---|
| 103 Dellwood Cir Warner Robins, GA | 2.0 | 1.0 | 1000 | $1,050 | $1.05 | 23d | 1 | 0.24mi |
| 1311 Alma Ave Warner Robins, GA | 3.0 | 1.0 | 1073 | $1,150 | $1.07 | 45d | 1 | 0.39mi |
| 342 Orchard Way Warner Robins, GA | 3.0 | 2.0 | 1186 | $1,349 | $1.14 | 45d | 1 | 0.56mi |
| 125 Orchard Pass Warner Robins, GA | 3.0 | 2.0 | 1165 | $1,395 | $1.20 | 45d | 1 | 0.59mi |
| 125 Briarcliff Rd Warner Robins, GA | 3.0 | 1.5 | 1242 | $1,325 | $1.07 | 45d | 1 | 0.62mi |
| 125 Briarcliff Rd Warner Robins, GA | 3.0 | 1.5 | 1242 | $1,325 | $1.07 | 23d | 1 | 0.62mi |
| 605 S Pleasant Hill Rd Warner Robins, GA | 3.0 | 1.0 | 1326 | $1,150 | $0.87 | 23d | 1 | 0.64mi |
| 605 S Pleasant Hill Rd Warner Robins, GA | 3.0 | 1.0 | 1326 | $1,150 | $0.87 | 45d | 1 | 0.64mi |
| 1436 Watson Blvd Warner Robins, GA | 2.0 | 1.5 | 1044 | $1,042 | $1.00 | 15d | 8 | 0.72mi |
| 1436 Watson Blvd Warner Robins, GA | 2.0 | 1.5 | 1044 | $1,070 | $1.02 | 45d | 6 | 0.72mi |
| 142 Stoneridge Dr Warner Robins, GA | 3.0 | 1.5 | 1321 | $1,450 | $1.10 | 45d | 1 | 1.02mi |
| 105 Marvin Blvd Warner Robins, GA | 4.0 | 2.0 | 1352 | $1,495 | $1.11 | 45d | 1 | 1.04mi |
| 115 Arnold Blvd Warner Robins, GA | 3.0 | 2.0 | 1037 | $1,300 | $1.25 | 45d | 1 | 1.14mi |
| 314 McArthur Blvd Warner Robins, GA | 3.0 | 1.0 | 1100 | $1,400 | $1.27 | 45d | 1 | 1.18mi |
| 305 Sparta St Warner Robins, GA | 3.0 | 1.0 | 1198 | $1,200 | $1.00 | 45d | 1 | 1.20mi |
| 204 Ashby Way Warner Robins, GA | 3.0 | 2.0 | 1251 | $1,395 | $1.12 | 45d | 1 | 1.32mi |
| 210 Southland Station Dr Warner Robins, GA | 1.0–3.0 | 1.0–2.0 | 1135 | $1,413 | $1.24 | 15d | 15 | 1.36mi |
| 108 Corinth St Warner Robins, GA | 3.0 | 1.0 | 1200 | $1,400 | $1.17 | 45d | 1 | 1.46mi |
| 202 Wendan Way Warner Robins, GA | 4.0 | 1.0 | 1036 | $1,075 | $1.04 | 15d | 1 | 1.48mi |
| 111 Marilyn Dr Warner Robins, GA | 3.0 | 1.0 | 912 | $1,175 | $1.29 | 23d | 1 | 1.49mi |
| 111 Marilyn Dr Warner Robins, GA | 3.0 | 1.0 | 912 | $1,250 | $1.37 | 45d | 1 | 1.49mi |
Listing history 17 events
-
2026-04-18status Under Contract
-
2026-04-16price $172,500
-
2026-03-15price $175,000
-
2026-03-12price $178,900
-
2026-02-28historical
-
2026-02-23price $185,000
-
2026-02-12price $190,000
-
2026-01-28price $192,000
-
2026-01-11price $192,500
-
2026-01-01$195,000 New
-
2025-12-31historical
-
2025-12-13$179,900 New
-
2025-12-13$192,500 New
-
2025-09-04soldstatus $77,700
-
2025-08-15soldstatus $77,660 Sold
-
2025-06-05status Under Contract
-
2025-06-04$80,000 New
ⓘ Source: listings_history table (triggers on properties + properties_extension) + one-shot
backfill from property_details.listing_events for pre-trigger history.
Tax reassessment forecast GA · Resets to sale price
- Current annual tax
- $769 · $64/mo
- Projected year-2 tax
- $1,587 · $132/mo
- Expected delta
- +$818/yr (+$68/mo · 106.4%)
ⓘ Screening estimate from a state-policy table — verify with the county assessor before closing.
Climate risk First Street
- Flood 1/10 Low FEMA zone X (unshaded) · 0% chance over 30 yrs
- Wildfire 2/10 Low
- Heat 7/10 Severe 7 d/yr ≥108°F today · 18 d/yr by 30 yrs out
- Wind 7/10 Severe 77% chance of damaging wind over 30 yrs
- Air quality 3/10 Moderate 2 unhealthy d/yr today · 4 by 30 yrs out
Nearby sold comps map
Loading sold comps map…
Walkable amenities ~0.75 mi
Loading nearby amenities…
Taxation est. · year 1
- Rental income
- $16,478
- − Mortgage interest
- −$9,663
- − Property taxes
- −$769
- − Insurance
- −$862
- − Repairs & maintenance
- −$1,318
- − Management
- −$1,318
- − Depreciation
- −$5,018
- Taxable loss
- −$2,470
- Est. tax savings @ 24.0%
- +$593
- After-tax cash flow
- $1,124/yr
For passive investors: Depreciation is non-cash, so a rental often shows a tax loss while cash-flowing — sheltering income. Rental losses are passive: they offset passive income freely, and up to $25,000/yr can offset ordinary (W-2) income if you actively participate and your MAGI is under $100k (phasing out to $0 by $150k); unused losses carry forward. On sale, claimed depreciation is recaptured at up to 25%, and gains may owe capital-gains tax (a 1031 exchange can defer both). Figures are a year-1 estimate at your 24.0% rate — not tax advice; consult a CPA.
Schools (NCES district)
- District
- Houston County
- NCES district ID
- 1302880
- Math proficiency
- 43% ▼ -7.00%
- Reading proficiency
- 46% ▼ -2.00%
- Median HH income
- $54,823
- Composite
- 38.68/100
- National rank
- #4144
- State rank
- #23 of 174 in GA
Livability — Warner Robins
- Score
- 65/100
- State rank
- #227
- US rank
- #13290
Category grades
Schools grade is shown separately in the Schools card above.
Census & demographics
- Census place
- Warner Robins, GA
- County
- Houston County · 157,321 people
- City population
- 92,102
- Metro
- Warner Robins, GA
- Population (ZIP)
- 58,585
- Household income
- $83,082
- Rent vs Own
- Severe rent burden
- 1668.0
Population outlook (Houston County) Hauer SSP2
- Today (2025)
- 169,502 people
- By 2030
- 178,486 · +5.3%
- By 2040
- 194,642 · +14.8%
- By 2050
- 207,119 · +22.2%
- By 2075
- 231,480 · +36.6%
- By 2100
- 235,034 · +38.7%
Race, ethnicity, and origin ACS 2023
- Neighborhood character
- Diverse neighborhood (Simpson 0.63)
- Race & ethnicity
- White 51% Black 32% Two or more races 9% Hispanic / Latino 7% Asian 4%
- Hispanic origin (detail)
- Mexican 4%
- Common ancestry
- Romanian 2% Slovak 2% Lithuanian 2%
- Foreign-born
- 9% · Canada, Vietnam, Jamaica
- Languages at home
- 90% English-only · Spanish 5% Other Asian/Pacific 2% Vietnamese 2%
Political lean MEDSL · Houston
- 2024 margin
- R (+11.3) · D 44.0% · R 55.3%
- 2008→2024 swing
- +8.9pp toward D · 2008: -20.2pp · 2024: -11.3pp
- All cycles
- 2024: R+11.3 2020: R+12.4 2016: R+21.6 2012: R+20.7 2008: R+20.2
Not yet ingested
- Civics
- —
Market trends
- HPI YoY
- ▼ -135.75%
- Current HPI
- 219.8261
- Rent YoY
- ▲ 1.67%
- Metro
- Warner Robins, GA
- State GDP YoY
- ▲ 2.66%
- F500 in state
- 28
Industry mix (Fortune 500 HQ in GA)
| Industry | F500 HQs | Revenue |
|---|---|---|
| Paper / Packaging | 2 | $29B |
|
||
| Retail | 1 | $160B |
|
||
| Transportation / Logistics | 1 | $91B |
|
||
| Airlines | 1 | $62B |
|
||
| Consumer Goods | 1 | $47B |
|
||
| Utilities | 1 | $25B |
|
||
Price history
+115.6% since first listed17 events — show timeline
- 2026-04-18 Pending — GAMLS
- 2026-04-16 Price Changed $172,500 GAMLS
- 2026-03-15 Price Changed $175,000 GAMLS
- 2026-03-12 Price Changed $178,900 GAMLS
- 2026-02-28 Listing Removed — GAMLS
- 2026-02-23 Price Changed $185,000 GAMLS
- 2026-02-12 Price Changed $190,000 GAMLS
- 2026-01-28 Price Changed $192,000 GAMLS
- 2026-01-11 Price Changed $192,500 GAMLS
- 2026-01-01 Listed $195,000 GAMLS
- 2025-12-31 Listing Removed — GAMLS
- 2025-12-13 Listed $192,500 GAMLS
- 2025-12-13 Listed $179,900 GAMLS
- 2025-09-04 Sold (Public Records) $77,700 Public Records
- 2025-08-15 Sold (MLS) $77,660 GAMLS
- 2025-06-05 Pending — GAMLS
- 2025-06-04 Listed $80,000 GAMLS
Property tax history
+3.3%/yrLatest (2025): $769 · +11.6% YoY. Source: county tax records.
Cash-flow waterfall
monthlySold comps — $/sqft
last 12 mo · ≤1 miLoading sold comps…