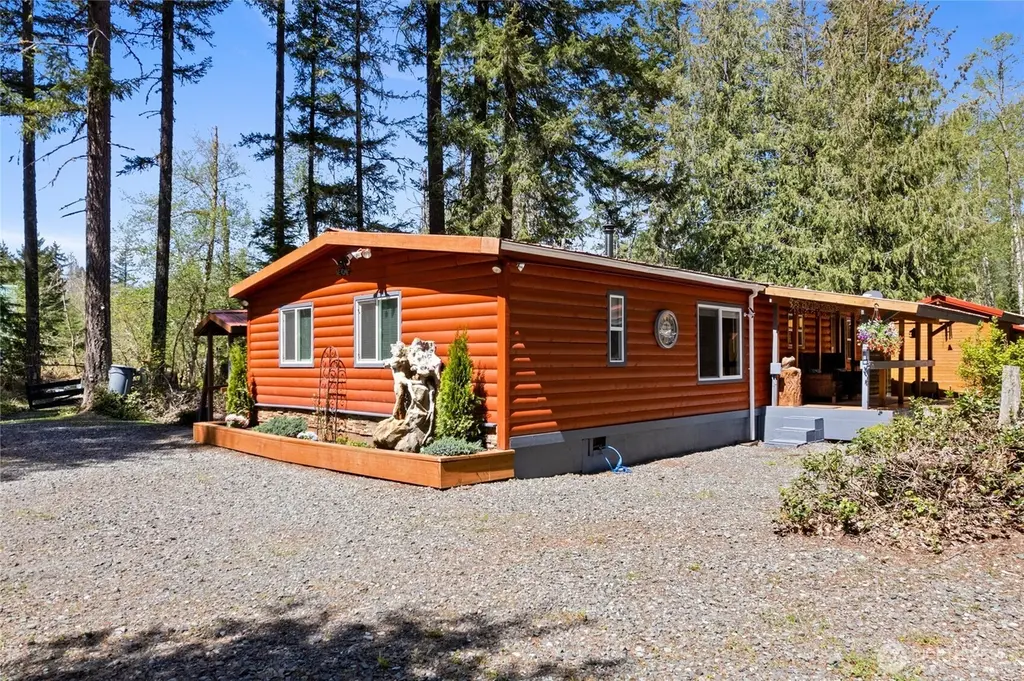
271 Skate Creek Rd · Ashford, WA
Flood risk 1/10 · Minimal
- FEMA flood zone
- X (unshaded)
- Chance of flooding over 30 yrs
- 0.0%
- Est. flood insurance / yr
- $507 – $1,088
Fire risk 3/10 · Minor
- Est. fire insurance / yr
- $604 – $1,122
Heat risk 1/10 · Minimal
- Hot days now (above 84°F)
- 10 days/yr
- Hot days in 30 yrs
- 21 days/yr
Wind risk 1/10 · Minimal
- Chance of severe wind over 30 yrs
- —
Air-quality risk 6/10 · Moderate
- Unhealthy air days now
- 8 days/yr
- Unhealthy air days in 30 yrs
- 8 days/yr
Risk factors via First Street. Map © Google.
Why this score? — see what drove the C- grade
The composite is a weighted blend of 9 inputs, each scored 0–100. Each bar is that input's sub-score; the figure is the points it added to the 100-point composite (weight × sub-score).
- Cash flow +16.2/30.0
- ARV discount +7.5/15.0
- Appreciation +6.0/10.0
- DSCR +5.0/10.0
- Schools +4.8/10.0
- 1% rule +3.5/10.0
- Livability +2.8/5.0
- Rent growth +2.5/5.0
- Condition / age +2.5/5.0
$465,000
🖨 Deal sheet (PDF) 📄 Offer letter ✓ Due diligence
Listing remarks
Near Mt. Rainier • Furnished • Guest space • Hot tubs • 1+ acre Active vacation rental that is a turn-key property located near the base of Mt. Rainier offering a fully furnished setup designed for personal use or potential short-term rental. The main home features 3 bedrooms and 2 baths, plus a den. It has a spacious layout that accommodates multiple guests. Additional sleeping space is provided by a detached bunkhouse, creating flexibility for extended stays or group use. A Pavilion enhances outdoor living with an indoor kitchen and an indoor hot tub, plus an additional outdoor wood-fired hot tub, supporting year-round enjoyment. Property includes two storage/shop area
Key facts
- Indoor hot tub
- Detached bunkhouse
- Fruit trees
Tags
Property features AI
Finance
- Other: Offers review date: Monday, May 18, 2026; On market date: Tuesday, May 5, 2026
- Financial info: Listing terms: Cash or Conventional
Exterior
- Parking: Driveway; RV parking
- Security: Fully fenced; Security gate; Security system
- Utilities: Water from community/shared well (well); Septic tank; Power by Lewis County PUD; Electric water heater located in well house; Cable (Dish); Internet (CenturyLink); Energy sources: Electric and wood
- Home design: Manufactured home (double wide); Manufactured on land; One story; Main entry; Has view; Very good condition
- Construction: Wood construction; Metal roof
- Exterior features: Wood exterior; Fenced (fully); Gated entry; Outbuildings; Outdoor fireplace; Patio; Shop; RV parking; Hot tub/Spa on site; Garden space; Wooded areas; Brush
Interior
- Kitchen: Refrigerator; Stove/Range; Microwave
- Bedrooms: 3 bedrooms (all on main level); Second living quarters / ADU with 1 bedroom
- Flooring: Ceramic tile; Concrete; Hardwood; Laminate; Carpet
- Bathrooms: 1 full bath; 1 three-quarter bath; 2 showers; 1 bathtub; 2 main-level bathrooms (1 full and 1 three-quarter)
- Heating & cooling: Baseboard heating; Wood stove / free-standing stove; Wall furnace; No central air
- Interior features: Dining room; Fireplace (wood burning); Hot tub/Spa; Sauna; Security system; Walk-in closet(s); Water heater; Wired for generator
- Laundry & utility: Washer; Dryer
Neighborhood map
What this means for you Summary
Snapshot
- This is a 3-bed/2.0-bath other listed at $465k.
Deal economics
- At list price, monthly cash flow is $245 ($3k/yr) — positive.
- The deal already cash-flows at list — no discount required.
- To meet the 1% rule (rent ≥ 1% of price), the offer needs to be $395k (15.1% below list).
- Recommended offer: $395k (15.1% below list) — sets the bar for 1% rule.
Location & tenants
- Location reads 56/100 on livability (#543 in WA) — a working-class tenant base; expect higher turnover. Strengths: crime A, cost of living A-, housing B; Watch: employment C-, health & safety C-, amenities F.
- Eatonville School District (rural): math 45% / reading 60% proficiency, ranked #116 of 291 in WA (top 40%) — acceptable for families but not a draw, mixed tenant base, ~2y average lease.
- Zoned schools: Columbia Crest A-Stem Academy (143 students, 66% FRL); Eatonville Middle School (411 students, 45% FRL); Eatonville High School (560 students, 41% FRL) — zoned schools average 51% FRL vs 32% district-wide (19 pts higher); higher-poverty schools than district average — tighter screening recommended.
- Market conditions: 43 active listings in the ZIP; 265 units permitted in Lewis County in 2024 (44 in 5+ unit buildings).
Forward outlook
- In year one you build about $13k of equity ($3k loan paydown + $9k appreciation (2.0% local appreciation)).
- Lewis County population projected at -11% by 2050 — secular population decline; favor cash flow + early exit over multi-decade hold.
- At projected returns (2.0% appreciation + 3.0% rent growth), your $130k cash investment doubles in ~7 years — after that, you're playing with house money.
- By year 3, paydown + projected appreciation supports a ~$32k cash-out refi (75% LTV) — recoverable capital for the next deal without selling this one.
Negotiation context
- It's been on market 47 days — a 3% lower offer ($451k) is reasonable based on typical stale-listing flexibility.
Questions for the listing agent
- It's been on market 47 days. Have you received any prior offers? Is the seller open to a 15% concession, seller financing, or rate buy-down credit?
- Built in 1976 — when were the roof, HVAC, electrical panel, plumbing, and water heater last replaced?
- Is there a deadline driving the sale (1031 exchange, divorce, estate, relocation)? That informs how much negotiation room exists.
- Schools are F-rated, which usually means shorter tenancies and higher turnover. Who's the typical renter profile here, and what's been the actual vacancy rate?
- What's the average days-on-market for RENTAL listings here right now (not sales)? A rising rental-DOM trend means longer vacancies and softer asking-rent achievability than the comps imply.
- What's the recent tenant-quality profile in this submarket — average credit score on applications, eviction rate, late-payment / NSF rate, and stable-employment percentage? A property-management company in the area should have these aggregated.
- How much new for-sale + rental construction is in the pipeline within 1–3 miles? Heavy new supply typically softens prices + rents 12–24 months out; constrained supply supports both.
Investment metrics
- 1% rule
- 0.85% ✗
- Cap rate
- 6.92%
- Cash-on-cash
- 2.26%
- DSCR
- 1.10
- GRM
- 9.8
CMA / ARV
No comps found within radius.
Projected returns pro-forma
2.02% appreciation · 3.0% rent growth · sell at horizon
- IRR
- 6.8%
- Equity multiple
- 1.37×
- Total profit
- $47,743
- Equity at exit
- $183,852
- IRR
- 10.1%
- Equity multiple
- 2.37×
- Total profit
- $178,706
- Equity at exit
- $265,091
Cash invested: $130,200 (down + closing). Projections, not guarantees.
Landlord ↔ Tenant lean methodology
- Overall (STATE)
- 28 Tenant-Leaning
- State Washington
- 28 Tenant-Leaning · D+8
- County
- — inherits STATE
- City
- — inherits STATE
ZIP-level market 98304
- Home prices YoY
- 0.7%
- Active inventory
- 43
- Price-to-rent
- 9.8×
Monthly cashflow live
- Estimated rent
- $3,949 medium interval (Pro) →
- Mortgage (P&I)
- −$2,439
- Tax from tax record
- −$243 /mo · $2,913/yr
- Insurance
- −$194
- HOA
- −$0
- Vacancy / Maint / Mgmt
- −$829
- Net cashflow
- $245
Break-even live
Sensitivity live
| Price | -10% $508 | -5% $376 | +0% $245 | +5% $113 | +10% $-18 |
|---|---|---|---|---|---|
| Rent | -10% $-67 | -5% $89 | +0% $245 | +5% $401 | +10% $557 |
| Rate | -1.0pp $479 | -0.5pp $363 | base $245 | +0.5pp $124 | +1.0pp $2 |
UW: 25.0% down · 7.5% · 30yr · 1.5% tax · 5.0% vac · 8.0% maint · 8.0% mgmt
Financing live
Cash to close
- Down payment
- $116,250
- Closing costs
- $13,950
- Reserves months
- —
- Total cash needed
- —
Loan-product check · same deal, 3 products live
Conventional
25% down · 7.5% · 30yr
- Down + closing
- —
- Monthly P&I
- —
- Monthly cashflow
- —
- DSCR
- —
- Eligible?
- —
Personal DTI + credit; lowest rate.
DSCR
20% down · 8.5% · 30yr
- Down + closing
- —
- Monthly P&I
- —
- Monthly cashflow
- —
- DSCR
- —
- Eligible?
- —
No personal income docs; deal must DSCR.
Hard money
10% down · 12.0% · 12mo
- Down + closing
- —
- Monthly P&I
- —
- Monthly cashflow
- —
- DSCR
- —
- Eligible?
- —
Short-term bridge; refi at stabilization.
Listing history 15 events
-
2026-06-21days on market $465,000 Active 47 DOM
-
2026-06-18days on market $465,000 Active 44 DOM
-
2026-06-17days on market $465,000 Active 43 DOM
-
2026-06-16days on market $465,000 Active 42 DOM
-
2026-06-15days on market $465,000 Active 41 DOM
-
2026-06-13days on market $465,000 Active 39 DOM
-
2026-06-09days on market $465,000 Active 35 DOM
-
2026-06-08days on market $465,000 Active 34 DOM
-
2026-06-07pricedays on market $465,000 Active 33 DOM
-
2026-06-04days on market $480,000 Active 30 DOM
-
2026-06-03days on market $480,000 Active 29 DOM
-
2026-06-02days on market $480,000 Active 28 DOM
-
2026-06-01days on market $480,000 Active 27 DOM
-
2026-05-31days on market $480,000 Active 26 DOM
-
2026-05-05$480,000 Active
ⓘ Source: listings_history table (triggers on properties + properties_extension) + one-shot
backfill from property_details.listing_events for pre-trigger history.
Tax reassessment forecast WA · Resets to sale price
- Current annual tax
- $2,913 · $243/mo
- Projected year-2 tax
- $4,557 · $380/mo
- Expected delta
- +$1,644/yr (+$137/mo · 56.4%)
ⓘ Screening estimate from a state-policy table — verify with the county assessor before closing.
Climate risk First Street
- Flood 1/10 Low FEMA zone X (unshaded) · 0% chance over 30 yrs
- Wildfire 3/10 Moderate
- Heat 1/10 Low 10 d/yr ≥84°F today · 21 d/yr by 30 yrs out
- Wind 1/10 Low
- Air quality 6/10 Major 8 unhealthy d/yr today · 8 by 30 yrs out
Nearby sold comps map
Loading sold comps map…
Walkable amenities ~0.75 mi
Loading nearby amenities…
Taxation est. · year 1
- Rental income
- $47,391
- − Mortgage interest
- −$26,047
- − Property taxes
- −$2,913
- − Insurance
- −$2,325
- − Repairs & maintenance
- −$3,791
- − Management
- −$3,791
- − Depreciation
- −$13,527
- Taxable loss
- −$5,005
- Est. tax savings @ 24.0%
- +$1,201
- After-tax cash flow
- $4,139/yr
For passive investors: Depreciation is non-cash, so a rental often shows a tax loss while cash-flowing — sheltering income. Rental losses are passive: they offset passive income freely, and up to $25,000/yr can offset ordinary (W-2) income if you actively participate and your MAGI is under $100k (phasing out to $0 by $150k); unused losses carry forward. On sale, claimed depreciation is recaptured at up to 25%, and gains may owe capital-gains tax (a 1031 exchange can defer both). Figures are a year-1 estimate at your 24.0% rate — not tax advice; consult a CPA.
Schools (NCES district)
- District
- Eatonville School District
- NCES district ID
- 5302370
- Math proficiency
- 45% ▼ -1.00%
- Reading proficiency
- 60% ▲ 1.00%
- Median HH income
- $58,370
- Composite
- 47.54/100
- National rank
- #4971
- State rank
- #116 of 291 in WA
Livability — Ashford
- Score
- 56/100
- State rank
- #543
- US rank
- #22815
Category grades
Schools grade is shown separately in the Schools card above.
Census & demographics
- Population (ZIP)
- 867
Population outlook (Lewis County) Hauer SSP2
- Today (2025)
- 75,749 people
- By 2030
- 74,647 · -1.5%
- By 2040
- 71,310 · -5.9%
- By 2050
- 67,748 · -10.6%
- By 2075
- 59,829 · -21.0%
- By 2100
- 52,293 · -31.0%
Race, ethnicity, and origin ACS 2023
- Neighborhood character
- Predominantly White (82%)
- Race & ethnicity
- White 82% Hispanic / Latino 12% Two or more races 9% Asian 2%
- Hispanic origin (detail)
- Mexican 5%
- Common ancestry
- Portuguese 11% Italian 7% English 6%
- Foreign-born
- 3%
- Languages at home
- 92% English-only · Spanish 5% Other Asian/Pacific 4%
Political lean MEDSL · Lewis
- 2024 margin
- Solid R (+33.0) · D 32.0% · R 65.0% · Other 3.0%
- 2008→2024 swing
- -13.8pp toward R · 2008: -19.2pp · 2024: -33.0pp
- All cycles
- 2024: R+33.0 2020: R+32.8 2016: R+36.2 2012: R+23.5 2008: R+19.2
Not yet ingested
- Civics
- —
Market trends
- HPI YoY
- ▲ 2.02%
- Current HPI
- 289.5128
- Rent YoY
- —
- Metro
- —
- State GDP YoY
- ▲ 4.65%
- F500 in state
- 22
Industry mix (Fortune 500 HQ in WA)
| Industry | F500 HQs | Revenue |
|---|---|---|
| Retail | 2 | $269B |
|
||
| Technology / Retail | 1 | $638B |
|
||
| Technology | 1 | $245B |
|
||
| Telecommunications | 1 | $38B |
|
||
| Food / Beverage | 1 | $36B |
|
||
| Automotive / Trucks | 1 | $34B |
|
||
Price history
-3.1% since first listed2 events — show timeline
- 2026-06-05 Price Changed $465,000 NWMLS as Distributed by MLS Grid
- 2026-05-05 Listed $480,000 NWMLS as Distributed by MLS Grid
Property tax history
+9.3%/yrLatest (2026): $2,913 · -28.6% YoY. Source: county tax records.
Cash-flow waterfall
monthlySold comps — $/sqft
last 12 mo · ≤1 miLoading sold comps…