 🏗️ New Construction
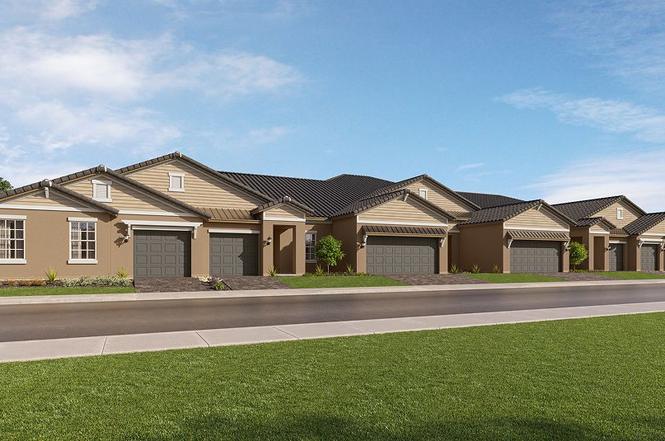
Sunrise II* Plan · Quail Ridge, FL
Flood risk 1/10 · Minimal
- FEMA flood zone
- X (unshaded)
- Chance of flooding over 30 yrs
- 0.0%
- Est. flood insurance / yr
- $507 – $1,088
Fire risk 5/10 · Moderate
- Est. fire insurance / yr
- $947 – $1,759
Heat risk 10/10 · Severe
- Hot days now (above 108°F)
- 7 days/yr
- Hot days in 30 yrs
- 25 days/yr
Wind risk 9/10 · Severe
- Chance of severe wind over 30 yrs
- 99.0%
Air-quality risk 2/10 · Minimal
- Unhealthy air days now
- 1 days/yr
- Unhealthy air days in 30 yrs
- 1 days/yr
Risk factors via First Street. Map © Google.
Why this score? — see what drove the D grade
The composite is a weighted blend of 9 inputs, each scored 0–100. Each bar is that input's sub-score; the figure is the points it added to the 100-point composite (weight × sub-score).
- Cash flow +13.6/30.0
- ARV discount +7.5/15.0
- Schools +4.3/10.0
- DSCR +4.1/10.0
- 1% rule +3.8/10.0
- Livability +3.2/5.0
- Condition / age +2.5/5.0
- Rent growth +1.6/5.0
- Appreciation +0.0/10.0
$233,400
🖨 Deal sheet (PDF) 📄 Offer letter ✓ Due diligence
Key facts
- <cozy covered patio>
- Garage
- Listed 778 days
Tags
Property features AI
Finance
- Other: Property listed as Plan inventory (new construction)
- Financial info: List price: $251,015
- HOA & community: HOA/community details not provided
Exterior
- Parking: Parking details not provided
- Security: Security details not provided
- Utilities: Utility details not provided
- Home design: New construction plan: Sunrise II*; Single-story (story count not specified)
- Construction: Living area approximately 1398; Construction details not provided
- Exterior features: Exterior details not provided
Interior
- Kitchen: Standard kitchen (details not provided)
- Bedrooms: 2 bedrooms
- Flooring: Flooring details not provided
- Bathrooms: 2 full bathrooms
- Heating & cooling: HVAC details not provided
- Interior features: Open plan living space
- Laundry & utility: Laundry details not provided
Neighborhood map
What this means for you Summary
Snapshot
- This is a 2-bed/2.0-bath townhouse listed at $233k.
Deal economics
- At list price, monthly cash flow is $12 ($150/yr) — positive.
- The deal already cash-flows at list — no discount required.
- To meet the 1% rule (rent ≥ 1% of price), the offer needs to be $216k (7.6% below list).
- Recommended offer: $205k (12.0% below list) — sets the bar for market timing.
- Cap rate 6.4% vs local median 3.9% in Quail Ridge — top-decile yield for the area; either an underpriced asset or a hidden risk that comps aren't pricing in. Stress-test before assuming the spread holds.
Location & tenants
- Location reads 63/100 on livability (#715 in FL) — a middle-class / working-renter tenant base. Strengths: crime A+, employment A+, cost of living A+; Watch: amenities F, commute F, health & safety F.
- Pasco (suburban): math 50% / reading 52% proficiency, ranked #32 of 73 in FL (top 44%) — acceptable for families but not a draw, mixed tenant base, ~2y average lease.
- Zoned schools: Connerton Elementary School (math 48% / reading 57%, grade C-, #976 of 2,144 statewide, top 46%, 958 students, 39% FRL); Pine View Middle School (math 63% / reading 52%, grade B, #157 of 571 statewide, top 28%, 1,170 students, 32% FRL); Land O' Lakes High School (math 56% / reading 64%, grade C+, #106 of 667 statewide, top 16%, 2,248 students, 27% FRL) — zoned schools average 33% FRL vs 48% district-wide (16 pts lower); this property's tenant base skews higher-income than the district average.
- Market conditions: Rents falling (-3.8%/yr); 723 active listings in the ZIP; 21 comparable units currently listed for rent nearby; rentals at typical pace (median 26d on market — plan ~3-4 weeks tenant-placement turnaround); high-income renter base; 6,765 units permitted in Pasco County in 2024 (1,250 in 5+ unit buildings).
Forward outlook
- Local home prices are declining (-3.0%/yr); year-one equity from $2k of loan paydown is wiped out by about $7k of value loss. Plan a longer hold.
- Pasco County population projected at +29% by 2050 — long-run rental-demand tailwind backs the buy-and-hold thesis.
Negotiation context
- It's been on market 778 days — a 12% lower offer ($205k) is reasonable based on typical stale-listing flexibility.
Risks & watch-outs
- Climate carrying-cost: severe wind risk, 99% chance of damaging wind over 30y; moderate wildfire risk; extreme-heat days projected 7→25/yr by 2055 (HVAC capex compounding) — expect insurance premiums to compound above CPI over the hold.
Questions for the listing agent
- It's been on market 778 days. Have you received any prior offers? Is the seller open to a 12% concession, seller financing, or rate buy-down credit?
- Why hasn't it sold? Are there any deal-killer items the seller is aware of (foundation, flood, title, zoning, code violations)?
- Is there a deadline driving the sale (1031 exchange, divorce, estate, relocation)? That informs how much negotiation room exists.
- Schools are F-rated, which usually means shorter tenancies and higher turnover. Who's the typical renter profile here, and what's been the actual vacancy rate?
- The area grade is low — what's the realistic commute time and amenity access for the typical tenant pool here? Any planned neighborhood developments (good or bad) we should know about?
- What's the average days-on-market for RENTAL listings here right now (not sales)? A rising rental-DOM trend means longer vacancies and softer asking-rent achievability than the comps imply.
- What's the recent tenant-quality profile in this submarket — average credit score on applications, eviction rate, late-payment / NSF rate, and stable-employment percentage? A property-management company in the area should have these aggregated.
- How much new for-sale + rental construction is in the pipeline within 1–3 miles? Heavy new supply typically softens prices + rents 12–24 months out; constrained supply supports both.
Investment metrics
- 1% rule
- 0.88% ✗
- Cap rate
- 6.35%
- Cash-on-cash
- 0.22%
- DSCR
- 1.01
- GRM
- 9.5
CMA / ARV
- ARV (on-the-fly)
- $244,650
- Comps found
- 1
Show comp detail 1 sale within ~0.75 mi
| Address | Dist | Beds/Ba | Sqft | Sold | Price | $/sf | Match |
|---|---|---|---|---|---|---|---|
| 17592 Nectar Flume Dr | 0.53mi | 2/2.5 | 1,541 (+10%) | 7mo | $269,900 | $175 | 50 |
Match score weights: distance 35% · size 25% · config 20% · recency 20%. Top-matched comps best support the ARV.
Projected returns pro-forma
-3.0% appreciation · 0.0% rent growth · sell at horizon
- IRR
- -19.4%
- Equity multiple
- 0.34×
- Total profit
- $-45,135
- Equity at exit
- $36,478
- IRR
- -20.0%
- Equity multiple
- 0.09×
- Total profit
- $-62,564
- Equity at exit
- $21,153
Cash invested: $68,502 (down + closing). Projections, not guarantees.
Landlord ↔ Tenant lean methodology
- Overall (STATE)
- 87 Strongly Landlord-Friendly
- State Florida
- 87 Strongly Landlord-Friendly · R+3
- County
- — inherits STATE
- City
- — inherits STATE
ZIP-level market 34638
- Home prices YoY
- -16.0%
- Rents YoY
- -3.8%
- Active inventory
- 723
- Price-to-rent
- 9.0×
Monthly cashflow live
- Estimated rent
- $2,156 high interval (Pro) →
- Mortgage (P&I)
- −$1,283
- Tax est. 1.5%
- −$306 /mo · $3,670/yr
- Insurance
- −$102
- HOA
- −$0
- Vacancy / Maint / Mgmt
- −$453
- Net cashflow
- $12
Break-even live
Sensitivity live
| Price | -10% $182 | -5% $97 | +0% $12 | +5% $-72 | +10% $-157 |
|---|---|---|---|---|---|
| Rent | -10% $-158 | -5% $-73 | +0% $12 | +5% $98 | +10% $183 |
| Rate | -1.0pp $136 | -0.5pp $75 | base $12 | +0.5pp $-51 | +1.0pp $-115 |
UW: 25.0% down · 7.5% · 30yr · 1.5% tax · 5.0% vac · 8.0% maint · 8.0% mgmt
Financing live
Cash to close
- Down payment
- $61,162
- Closing costs
- $7,340
- Reserves months
- —
- Total cash needed
- —
Loan-product check · same deal, 3 products live
Conventional
25% down · 7.5% · 30yr
- Down + closing
- —
- Monthly P&I
- —
- Monthly cashflow
- —
- DSCR
- —
- Eligible?
- —
Personal DTI + credit; lowest rate.
DSCR
20% down · 8.5% · 30yr
- Down + closing
- —
- Monthly P&I
- —
- Monthly cashflow
- —
- DSCR
- —
- Eligible?
- —
No personal income docs; deal must DSCR.
Hard money
10% down · 12.0% · 12mo
- Down + closing
- —
- Monthly P&I
- —
- Monthly cashflow
- —
- DSCR
- —
- Eligible?
- —
Short-term bridge; refi at stabilization.
Rent comps 21 comps
| Address | Beds | Baths | Sqft | Rent | $/sqft | DOM | Units | Dist |
|---|---|---|---|---|---|---|---|---|
| 11028 Crescent Deer Dr Land O Lakes, FL | 3.0 | 2.5 | 1673 | $2,075 | $1.24 | 26d | 1 | 0.37mi |
| 11028 Crescent Deer Dr Land O Lakes, FL | 3.0 | 2.5 | 1673 | $2,075 | $1.24 | 16d | 1 | 0.37mi |
| 11071 Crescent Deer Dr Land O Lakes, FL | 3.0 | 2.5 | 1673 | $2,100 | $1.26 | 25d | 1 | 0.40mi |
| 11070 Crescent Deer Dr Land O Lakes, FL | 3.0 | 2.5 | 1673 | $1,950 | $1.17 | 26d | 1 | 0.42mi |
| 11147 Crescent Deer Dr Land O Lakes, FL | 3.0 | 2.5 | 1673 | $1,995 | $1.19 | 26d | 1 | 0.45mi |
| 11236 Crescent Deer Dr Land O Lakes, FL | 3.0 | 2.5 | 1673 | $2,000 | $1.20 | 16d | 1 | 0.53mi |
| 11262 Crescent Deer Dr Land O Lakes, FL | 3.0 | 2.5 | 1673 | $2,195 | $1.31 | 6d | 1 | 0.55mi |
| 17608 Nectar Flume Dr Land O Lakes, FL | 3.0 | 2.5 | 1634 | $2,100 | $1.29 | 26d | 1 | 0.56mi |
| 17425 Nectar Flume Dr Land O Lakes, FL | 3.0 | 2.5 | 1666 | $1,900 | $1.14 | 26d | 1 | 0.70mi |
| 11450 Crescent Deer Dr Land O Lakes, FL | 3.0 | 2.5 | 1673 | $1,995 | $1.19 | 19d | 1 | 0.71mi |
| 10981 Wishing Cloud Rd Land O Lakes, FL | 3.0 | 2.5 | 1787 | $2,000 | $1.12 | 22d | 1 | 0.75mi |
| 17512 Shirewood Way Land O Lakes, FL | 3.0 | 2.0 | 1448 | $2,200 | $1.52 | 25d | 1 | 0.77mi |
| 11103 Wishing Cloud Rd Land O Lakes, FL | 3.0 | 2.5 | 1787 | $2,350 | $1.32 | 26d | 1 | 0.80mi |
| 11115 Wishing Cloud Rd Land O Lakes, FL | 3.0 | 2.5 | 1666 | $2,250 | $1.35 | 26d | 1 | 0.81mi |
| 18039 Turning Leaf Cir Land O Lakes, FL | 3.0 | 2.0 | 1516 | $2,895 | $1.91 | 26d | 1 | 0.98mi |
| 17784 Turning Leaf Cir Land O Lakes, FL | 3.0 | 2.0 | 1532 | $2,450 | $1.60 | 26d | 1 | 1.11mi |
| 18267 Turning Leaf Cir Land O Lakes, FL | 3.0 | 2.0 | 1516 | $2,095 | $1.38 | 26d | 1 | 1.19mi |
| 18276 Turning Leaf Cir Land O Lakes, FL | 3.0 | 2.0 | 1532 | $2,250 | $1.47 | 26d | 1 | 1.19mi |
| 10735 Hawks Landing Dr Land O Lakes, FL | 3.0 | 3.0 | 1848 | $2,495 | $1.35 | 16d | 1 | 1.27mi |
| 10179 Gliding Eagle Way Land O Lakes, FL | 3.0 | 2.0 | 1829 | $2,800 | $1.53 | 19d | 1 | 1.35mi |
| 9896 Dancing Goat Pl Land O' Lakes, FL | 3.0 | 2.0 | 1486 | $2,175 | $1.46 | 26d | 1 | 1.38mi |
Listing history 13 events
-
2026-06-18days on market $233,400 Active 778 DOM
-
2026-06-18price $233,400 Active 777 DOM
-
2026-06-17pricedays on market $233,200 Active 777 DOM
-
2026-06-16days on market $233,100 Active 776 DOM
-
2026-06-15days on market $233,100 Active 775 DOM
-
2026-06-13days on market $233,100 Active 773 DOM
-
2026-06-08days on market $233,100 Active 768 DOM
-
2026-06-07pricedays on market $233,100 Active 767 DOM
-
2026-06-04days on market $233,000 Active 764 DOM
-
2026-06-03days on market $233,000 Active 763 DOM
-
2026-06-02pricedays on market $233,000 Active 762 DOM
-
2026-06-01days on market $235,000 Active 761 DOM
-
2026-05-31days on market $235,000 Active 760 DOM
ⓘ Source: listings_history table (triggers on properties + properties_extension) + one-shot
backfill from property_details.listing_events for pre-trigger history.
Climate risk First Street
- Flood 1/10 Low FEMA zone X (unshaded) · 0% chance over 30 yrs
- Wildfire 5/10 Major
- Heat 10/10 Extreme 7 d/yr ≥108°F today · 25 d/yr by 30 yrs out
- Wind 9/10 Extreme 99% chance of damaging wind over 30 yrs
- Air quality 2/10 Low 1 unhealthy d/yr today · 1 by 30 yrs out
Nearby sold comps map
Loading sold comps map…
Walkable amenities ~0.75 mi
Loading nearby amenities…
Taxation est. · year 1
- Rental income
- $25,871
- − Mortgage interest
- −$13,704
- − Property taxes
- −$3,670
- − Insurance
- −$1,223
- − Repairs & maintenance
- −$2,070
- − Management
- −$2,070
- − Depreciation
- −$7,117
- Taxable loss
- −$3,982
- Est. tax savings @ 24.0%
- +$956
- After-tax cash flow
- $1,106/yr
For passive investors: Depreciation is non-cash, so a rental often shows a tax loss while cash-flowing — sheltering income. Rental losses are passive: they offset passive income freely, and up to $25,000/yr can offset ordinary (W-2) income if you actively participate and your MAGI is under $100k (phasing out to $0 by $150k); unused losses carry forward. On sale, claimed depreciation is recaptured at up to 25%, and gains may owe capital-gains tax (a 1031 exchange can defer both). Figures are a year-1 estimate at your 24.0% rate — not tax advice; consult a CPA.
Schools (NCES district)
- District
- Pasco
- NCES district ID
- 1201530
- Math proficiency
- 50% ▼ -10.00%
- Reading proficiency
- 52% ▼ -5.00%
- Median HH income
- $45,039
- Composite
- 43.14/100
- National rank
- #3074
- State rank
- #32 of 73 in FL
Livability — Quail Ridge
- Score
- 63/100
- State rank
- #715
- US rank
- #15264
Category grades
Schools grade is shown separately in the Schools card above.
Census & demographics
- County
- Pasco County · 524,098 people
- Metro
- Tampa-St. Petersburg-Clearwater, FL
- Population (ZIP)
- 37,644
- Household income
- $123,899
- Rent vs Own
- Severe rent burden
- 354.0
Population outlook (Pasco County) Hauer SSP2
- Today (2025)
- 570,045 people
- By 2030
- 605,844 · +6.3%
- By 2040
- 674,806 · +18.4%
- By 2050
- 736,022 · +29.1%
- By 2075
- 862,900 · +51.4%
- By 2100
- 906,364 · +59.0%
Race, ethnicity, and origin ACS 2023
- Neighborhood character
- Diverse neighborhood (Simpson 0.59)
- Race & ethnicity
- White 58% Hispanic / Latino 25% Two or more races 16% Black 6% Asian 4%
- Hispanic origin (detail)
- Mexican 1% Puerto Rican 6% Cuban 4% Dominican 3%
- Common ancestry
- Lithuanian 3% Romanian 3% Slovak 2%
- Foreign-born
- 17% · Canada, Jamaica
- Languages at home
- 76% English-only · Spanish 16% Other Indo-European 2% Arabic 2%
Political lean MEDSL · Pasco
- 2024 margin
- Strong R (+25.2) · D 36.9% · R 62.1% · Other 1.0%
- 2008→2024 swing
- -21.6pp toward R · 2008: -3.6pp · 2024: -25.2pp
- All cycles
- 2024: R+25.2 2020: R+20.1 2016: R+21.6 2012: R+6.7 2008: R+3.6
Not yet ingested
- Civics
- —
Market trends
- HPI YoY
- ▼ -57.02%
- Current HPI
- 299.2018
- Rent YoY
- ▼ -3.78%
- Metro
- Tampa-St. Petersburg-Clearwater, FL
- State GDP YoY
- ▲ 3.28%
- F500 in state
- 36
Industry mix (Fortune 500 HQ in FL)
| Industry | F500 HQs | Revenue |
|---|---|---|
| Industrial Technology | 2 | $29B |
|
||
| Insurance | 2 | $17B |
|
||
| Retail | 1 | $60B |
|
||
| Technology Distribution | 1 | $58B |
|
||
| Homebuilding | 1 | $35B |
|
||
| Technology Manufacturing | 1 | $35B |
|
||
Cash-flow waterfall
monthlySold comps — $/sqft
last 12 mo · ≤1 miLoading sold comps…