1607 Klauke St · Rosenberg, TX
Flood risk 6/10 · Moderate
- FEMA flood zone
- X (unshaded)
- Chance of flooding over 30 yrs
- 0.7%
- Est. flood insurance / yr
- $507 – $1,088
Fire risk 1/10 · Minimal
- Est. fire insurance / yr
- $1,222 – $2,270
Heat risk 9/10 · Severe
- Hot days now (above 110°F)
- 7 days/yr
- Hot days in 30 yrs
- 22 days/yr
Wind risk 9/10 · Severe
- Chance of severe wind over 30 yrs
- 99.0%
Air-quality risk 2/10 · Minimal
- Unhealthy air days now
- 1 days/yr
- Unhealthy air days in 30 yrs
- 1 days/yr
Risk factors via First Street. Map © Google.
Why this score? — see what drove the C+ grade
The composite is a weighted blend of 9 inputs, each scored 0–100. Each bar is that input's sub-score; the figure is the points it added to the 100-point composite (weight × sub-score).
- Cash flow +21.2/30.0
- ARV discount +15.0/15.0
- DSCR +6.8/10.0
- 1% rule +6.0/10.0
- Schools +4.6/10.0
- Livability +3.1/5.0
- Condition / age +2.5/5.0
- Rent growth +2.3/5.0
- Appreciation +0.0/10.0
$158,999
🖨 Deal sheet 📄 Offer letter ✓ Due diligence
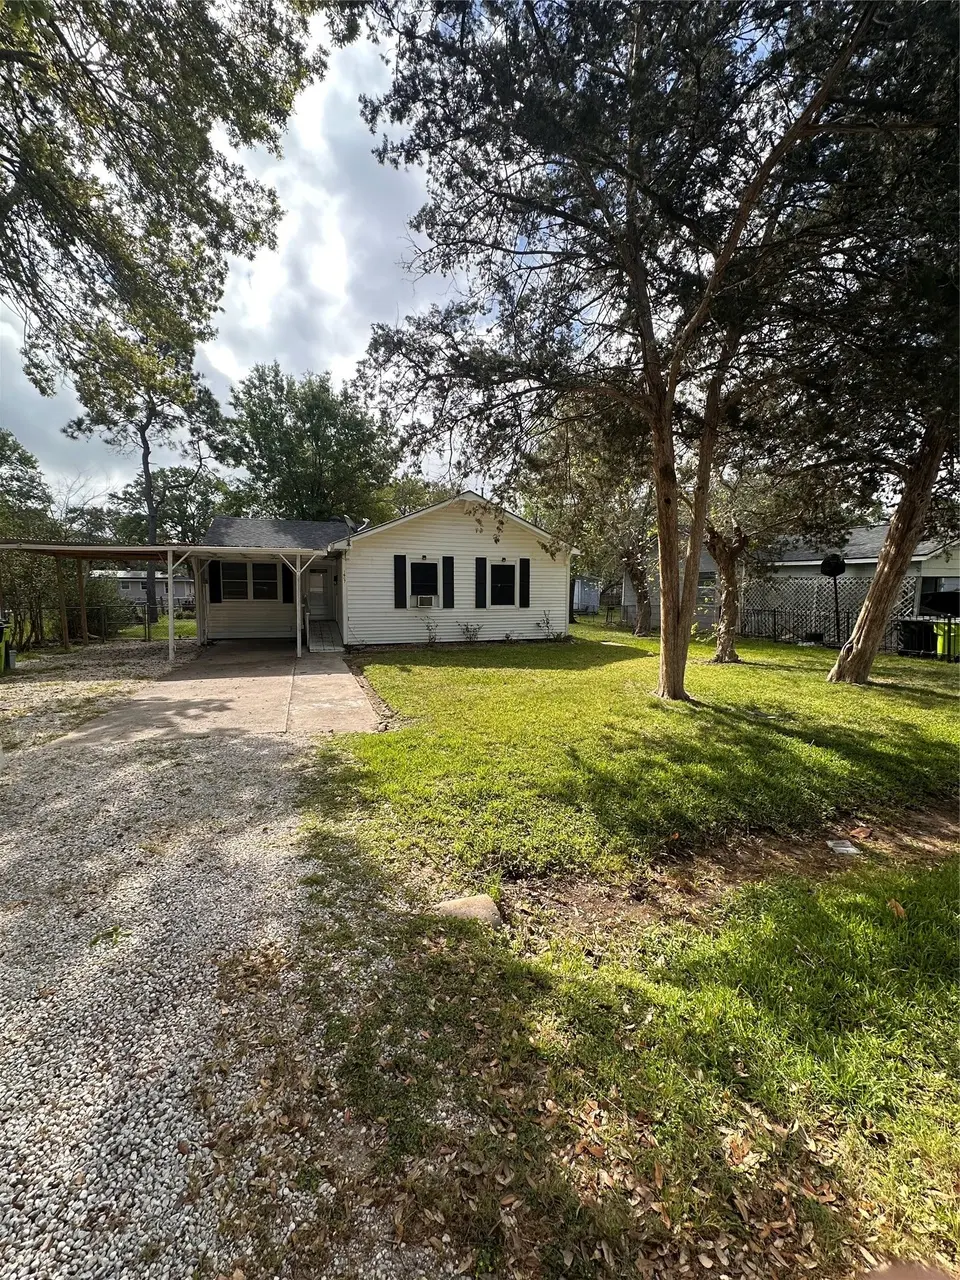
Listing remarks MLS
Three bedrooms and two full baths in this great home! Perfect for a first-time homebuyer or a family with kids to enjoy the spacious yard. This home has an extra room at the back of the house that could be used as a game room or office. While there is no garage, there is a two-car carport and a large storage shed in the backyard for all your storage needs. Lots of beautiful trees for shade in the summertime. This home is being sold "as is". The buyer will purchase a new survey.
Key facts
- Spacious yard
- Office space
- Extra room
Tags
Neighborhood map
What this means for you Summary
Snapshot
- This is a 3-bed/2.0-bath single-family listed at $159k.
Deal economics
- At list price, monthly cash flow is $231 ($3k/yr) — positive.
- The deal already cash-flows at list — no discount required.
- Meets the 1% rule at list price ($2k rent vs $159k).
- Recommended offer: $149k (6.0% below list) — sets the bar for market timing.
- Cap rate 8.0% vs local median 3.4% in Rosenberg — top-decile yield for the area; either an underpriced asset or a hidden risk that comps aren't pricing in. Stress-test before assuming the spread holds.
Location & tenants
- Location reads 62/100 on livability (#922 in TX) — a middle-class / working-renter tenant base. Strengths: cost of living A+, housing A+, crime B; Watch: schools D-, amenities F, commute F.
- Lamar CISD (suburban): math 50% / reading 53% proficiency, ranked #116 of 826 in TX (top 14%) — acceptable for families but not a draw, mixed tenant base, ~2y average lease.
- Market conditions: Rents soft (-1.0%/yr); 716 active listings in the ZIP; 13 comparable units currently listed for rent nearby; rentals at typical pace (median 24d on market — plan ~3-4 weeks tenant-placement turnaround); 46% of comp listings sitting > 30 days — soft ceiling on asking rent; 12,093 units permitted in Fort Bend County in 2024 (815 in 5+ unit buildings).
Forward outlook
- Local home prices are declining (-3.0%/yr); year-one equity from $1k of loan paydown is wiped out by about $5k of value loss. Plan a longer hold.
- Fort Bend County population projected at +75% by 2050 — long-run rental-demand tailwind backs the buy-and-hold thesis.
Negotiation context
- It's been on market 73 days — a 6% lower offer ($149k) is reasonable based on typical stale-listing flexibility.
Risks & watch-outs
- Watch-outs: built in 1952 — expect roof / HVAC / electrical / plumbing capex.
- Climate carrying-cost: major flood risk; severe wind risk, 99% chance of damaging wind over 30y; extreme-heat days projected 7→22/yr by 2055 (HVAC capex compounding) — expect insurance premiums to compound above CPI over the hold.
Questions for the listing agent
- It's been on market 73 days. Have you received any prior offers? Is the seller open to a 6% concession, seller financing, or rate buy-down credit?
- Built in 1952 — when were the roof, HVAC, electrical panel, plumbing, and water heater last replaced?
- Why hasn't it sold? Are there any deal-killer items the seller is aware of (foundation, flood, title, zoning, code violations)?
- Is there a deadline driving the sale (1031 exchange, divorce, estate, relocation)? That informs how much negotiation room exists.
- Schools are D-rated, which usually means shorter tenancies and higher turnover. Who's the typical renter profile here, and what's been the actual vacancy rate?
- What's the average days-on-market for RENTAL listings here right now (not sales)? A rising rental-DOM trend means longer vacancies and softer asking-rent achievability than the comps imply.
- What's the recent tenant-quality profile in this submarket — average credit score on applications, eviction rate, late-payment / NSF rate, and stable-employment percentage? A property-management company in the area should have these aggregated.
- How much new for-sale + rental construction is in the pipeline within 1–3 miles? Heavy new supply typically softens prices + rents 12–24 months out; constrained supply supports both.
Investment metrics
- 1% rule
- 1.10% ✓
- Cap rate
- 8.03%
- Cash-on-cash
- 6.22%
- DSCR
- 1.28
- GRM
- 7.6
CMA / ARV
- ARV (median comp)
- $216,684
- List price
- $158,999
- Delta
- -26.62%
- Verdict
- UNDERPRICED
- Comps
- 20 within 1.0 mi
Show comp detail 12 sales within ~0.75 mi
| Address | Dist | Beds/Ba | Sqft | Sold | Price | $/sf | Match |
|---|---|---|---|---|---|---|---|
| 1815 Brumbelow St | 0.22mi | 3/2.0 | 1,511 (-3%) | 1mo | $162,900 | $108 | 84 |
| 1633 Jones St | 0.07mi | 4/2.0 (+1) | 1,632 (+5%) | 4mo | $214,900 | $132 | 80 |
| 3825 Avenue R | 0.24mi | 3/2.0 | 1,483 (-4%) | 2mo | $180,000 | $121 | 80 |
| 2014 Briar Ridge Dr | 0.25mi | 4/2.0 (+1) | 1,454 (-6%) | 1mo | $189,000 | $130 | 72 |
| 3027 Turtle Creek Dr | 0.57mi | 3/2.0 | 1,536 (-1%) | 0mo | $265,000 | $173 | 72 |
| 1926 Klauke Ct | 0.29mi | 4/2.0 (+1) | 1,484 (-4%) | 4mo | $249,000 | $168 | 70 |
| 2103 Briar Ridge Dr | 0.22mi | 3/2.0 | 1,388 (-11%) | 2mo | $235,000 | $169 | 70 |
| 3608 Avenue R | 0.36mi | 3/2.0 | 1,401 (-10%) | 3mo | $230,000 | $164 | 65 |
| 1310 Village Court Blvd | 0.31mi | 3/2.0 | 1,760 (+13%) | 5mo | $214,900 | $122 | 59 |
| 3603 Glenmeadow Dr | 0.36mi | 3/2.0 | 1,762 (+14%) | 3mo | $290,000 | $165 | 58 |
| 1210 Hannover Blvd | 0.42mi | 3/2.0 | 1,784 (+15%) | 4mo | $285,000 | $160 | 52 |
| 4901 E Columbary Dr | 0.47mi | 3/2.0 | 1,778 (+15%) | 2mo | $280,000 | $157 | 52 |
Match score weights: distance 35% · size 25% · config 20% · recency 20%. Top-matched comps best support the ARV.
Projected returns pro-forma
-3.0% appreciation · 0.0% rent growth · sell at horizon
- IRR
- -10.3%
- Equity multiple
- 0.64×
- Total profit
- $-16,152
- Equity at exit
- $23,707
- IRR
- -6.0%
- Equity multiple
- 0.67×
- Total profit
- $-14,764
- Equity at exit
- $13,747
Cash invested: $44,520 (down + closing). Projections, not guarantees.
Landlord ↔ Tenant lean methodology
- Overall (STATE)
- 87 Strongly Landlord-Friendly
- State Texas
- 87 Strongly Landlord-Friendly · R+5
- County
- — inherits STATE
- City
- — inherits STATE
ZIP-level market 77471
- Home prices YoY
- -19.3%
- Rents YoY
- -1.0%
- Active inventory
- 716
- Price-to-rent
- 7.6×
Monthly cashflow live
- Estimated rent
- $1,754 high interval (Pro) →
- Mortgage (P&I)
- −$834
- Tax from tax record
- −$255 /mo · $3,059/yr
- Insurance
- −$66
- HOA
- −$0
- Vacancy / Maint / Mgmt
- −$368
- Net cashflow
- $231
Break-even live
UW: 25.0% down · 7.5% · 30yr · 1.5% tax · 5.0% vac · 8.0% maint · 8.0% mgmt
Financing live
Cash to close
- Down payment
- $39,750
- Closing costs
- $4,770
- Reserves months
- —
- Total cash needed
- —
Loan-product check · same deal, 3 products live
Conventional
25% down · 7.5% · 30yr
- Down + closing
- —
- Monthly P&I
- —
- Monthly cashflow
- —
- DSCR
- —
- Eligible?
- —
Personal DTI + credit; lowest rate.
DSCR
20% down · 8.5% · 30yr
- Down + closing
- —
- Monthly P&I
- —
- Monthly cashflow
- —
- DSCR
- —
- Eligible?
- —
No personal income docs; deal must DSCR.
Hard money
10% down · 12.0% · 12mo
- Down + closing
- —
- Monthly P&I
- —
- Monthly cashflow
- —
- DSCR
- —
- Eligible?
- —
Short-term bridge; refi at stabilization.
Rent comps 13 comps
| Address | Beds | Baths | Sqft | Rent | $/sqft | DOM | Units | Dist |
|---|---|---|---|---|---|---|---|---|
| 1615 Junker St Rosenberg, TX | 3.0 | 2.0 | 1174 | $1,750 | $1.49 | 43d | 1 | 0.20mi |
| 3828 Avenue N Rosenberg, TX | 3.0 | 2.0 | 1238 | $1,650 | $1.33 | 43d | 1 | 0.20mi |
| 4114 Brumbelow St Rosenberg, TX | 3.0 | 2.0 | 1234 | $1,700 | $1.38 | 5d | 1 | 0.27mi |
| 3412 Avenue R Unit R Rosenberg, TX | 3.0 | 2.0 | 1467 | $1,775 | $1.21 | 43d | 1 | 0.46mi |
| 2122 Hackberry Bank Ln Rosenberg, TX | 3.0 | 2.0 | 1620 | $1,799 | $1.11 | 3d | 1 | 0.60mi |
| 2020 Ward St Rosenberg, TX | 3.0 | 2.0 | 1748 | $1,850 | $1.06 | 43d | 1 | 0.87mi |
| 4720 Reading Rd Rosenberg, TX | 2.0–3.0 | 1.0–2.0 | 930 | $1,422 | $1.53 | 1d | 15 | 1.04mi |
| 4726 Reading Rd Rosenberg, TX | 3.0 | 2.0 | 1060 | $1,275 | $1.20 | 43d | 1 | 1.04mi |
| 2009 Tremont Ct Rosenberg, TX | 3.0 | 1.5 | 1425 | $1,701 | $1.19 | 21d | 1 | 1.06mi |
| 1806 Mustang Dr Richmond, TX | 3.0 | 2.0 | 1296 | $1,100 | $0.85 | 43d | 1 | 1.25mi |
| 1803 Cypress Dr Richmond, TX | 3.0 | 2.0 | 1601 | $1,875 | $1.17 | 24d | 1 | 1.31mi |
| 1202 3rd St Rosenberg, TX | 3.0 | 2.0 | 1400 | $1,575 | $1.12 | 24d | 1 | 1.44mi |
| 4932 Vancouver Blvd Richmond, TX | 3.0 | 2.0 | 1321 | $3,500 | $2.65 | 12d | 1 | 1.49mi |
Listing history 15 events
-
2026-06-18days on market $158,999 Active 73 DOM
-
2026-06-17days on market $158,999 Active 72 DOM
-
2026-06-16days on market $158,999 Active 71 DOM
-
2026-06-15days on market $158,999 Active 70 DOM
-
2026-06-13pricedays on market $158,999 Active 68 DOM
-
2026-06-10days on market $185,000 Active 64 DOM
-
2026-06-08days on market $185,000 Active 63 DOM
-
2026-06-07days on market $185,000 Active 62 DOM
-
2026-06-04days on market $185,000 Active 59 DOM
-
2026-06-03days on market $185,000 Active 58 DOM
-
2026-06-02days on market $185,000 Active 57 DOM
-
2026-06-01days on market $185,000 Active 56 DOM
-
2026-05-31days on market $185,000 Active 55 DOM
-
2026-04-27price $193,500 492-char remark
Show marketing remark (492 chars)
Three bedrooms and two full baths in this great home! Perfect for a first-time homebuyer or a family with kids to enjoy the spacious yard. This home has an extra room at the back of the house that could be used as a game room or office. While there is no garage, there is a two-car carport and a large storage shed in the backyard for all your storage needs. Lots of beautiful trees for shade in the summertime. This home is being sold "as is". The buyer will purchase a new survey.
-
2026-04-06$205,000 Active 492-char remark
Show marketing remark (492 chars)
Three bedrooms and two full baths in this great home! Perfect for a first-time homebuyer or a family with kids to enjoy the spacious yard. This home has an extra room at the back of the house that could be used as a game room or office. While there is no garage, there is a two-car carport and a large storage shed in the backyard for all your storage needs. Lots of beautiful trees for shade in the summertime. This home is being sold "as is". The buyer will purchase a new survey.
ⓘ Source: listings_history table (triggers on properties + properties_extension) + one-shot
backfill from property_details.listing_events for pre-trigger history.
Tax reassessment forecast TX · Resets to sale price
- Current annual tax
- $3,059 · $255/mo
- Projected year-2 tax
- $3,059 · $255/mo
- Expected delta
- $0/yr ($0/mo · 0.0%)
ⓘ Screening estimate from a state-policy table — verify with the county assessor before closing.
Climate risk First Street
- Flood 6/10 Major FEMA zone X (unshaded) · 70% chance over 30 yrs
- Wildfire 1/10 Low
- Heat 9/10 Extreme 7 d/yr ≥110°F today · 22 d/yr by 30 yrs out
- Wind 9/10 Extreme 99% chance of damaging wind over 30 yrs
- Air quality 2/10 Low 1 unhealthy d/yr today · 1 by 30 yrs out
Nearby sold comps map
Loading sold comps map…
Walkable amenities ~0.75 mi
Loading nearby amenities…
Taxation est. · year 1
- Rental income
- $21,047
- − Mortgage interest
- −$8,906
- − Property taxes
- −$3,059
- − Insurance
- −$795
- − Repairs & maintenance
- −$1,684
- − Management
- −$1,684
- − Depreciation
- −$4,625
- Taxable income
- $294
- Est. tax owed @ 24.0%
- −$71
- After-tax cash flow
- $2,697/yr
For passive investors: Depreciation is non-cash, so a rental often shows a tax loss while cash-flowing — sheltering income. Rental losses are passive: they offset passive income freely, and up to $25,000/yr can offset ordinary (W-2) income if you actively participate and your MAGI is under $100k (phasing out to $0 by $150k); unused losses carry forward. On sale, claimed depreciation is recaptured at up to 25%, and gains may owe capital-gains tax (a 1031 exchange can defer both). Figures are a year-1 estimate at your 24.0% rate — not tax advice; consult a CPA.
Schools (NCES district)
- District
- Lamar CISD
- NCES district ID
- 4826580
- Math proficiency
- 50% ▼ -12.00%
- Reading proficiency
- 53% ▼ -4.00%
- Median HH income
- $75,213
- Composite
- 46.43/100
- National rank
- #2452
- State rank
- #116 of 826 in TX
Livability — Rosenberg
- Score
- 62/100
- State rank
- #922
- US rank
- #16414
Category grades
Schools grade is shown separately in the Schools card above.
Census & demographics
- Census place
- Rosenberg, TX
- County
- Fort Bend County · 836,777 people
- City population
- 115,151
- Metro
- Houston-The Woodlands-Sugar Land, TX
- Population (ZIP)
- 45,325
- Household income
- $73,186
- Rent vs Own
- Severe rent burden
- 1688.0
Population outlook (Fort Bend County) Hauer SSP2
- Today (2025)
- 1,004,526 people
- By 2030
- 1,153,104 · +14.8%
- By 2040
- 1,453,718 · +44.7%
- By 2050
- 1,753,781 · +74.6%
- By 2075
- 2,455,772 · +144.5%
- By 2100
- 2,930,528 · +191.7%
Race, ethnicity, and origin ACS 2023
- Neighborhood character
- Diverse neighborhood (Simpson 0.61)
- Race & ethnicity
- Hispanic / Latino 56% White 23% Two or more races 21% Black 12% Asian 7%
- Hispanic origin (detail)
- Mexican 46%
- Common ancestry
- Romanian 1% Lithuanian 1% Slovak 1%
- Foreign-born
- 18% · Canada, China, Vietnam
- Languages at home
- 57% English-only · Spanish 35% Tagalog/Filipino 2% Other Indo-European 1%
Political lean MEDSL · Fort Bend
- 2024 margin
- Toss-up / Even · D 49.5% · R 47.9% · Other 2.6%
- 2008→2024 swing
- +4.0pp toward D · 2008: -2.4pp · 2024: 1.6pp
- All cycles
- 2024: D+1.6 2020: D+10.6 2016: D+6.6 2012: R+6.8 2008: R+2.4
Not yet ingested
- Civics
- —
Market trends
- HPI YoY
- ▼ -74.06%
- Current HPI
- 309.5425
- Rent YoY
- ▼ -0.97%
- Metro
- Houston-The Woodlands-Sugar Land, TX
- State GDP YoY
- ▲ 3.95%
- F500 in state
- 110
Industry mix (Fortune 500 HQ in TX)
| Industry | F500 HQs | Revenue |
|---|---|---|
| Energy | 16 | $1,198B |
|
||
| Technology | 5 | $198B |
|
||
| Engineering / Construction | 4 | $72B |
|
||
| Energy Services | 3 | $60B |
|
||
| Utilities | 3 | $41B |
|
||
| Healthcare | 2 | $330B |
|
||
Price history
-5.6% since first listed2 events — show timeline
- 2026-04-27 Price Changed $193,500 HARMLS
- 2026-04-06 Listed $205,000 HARMLS
Property tax history
+3.2%/yrLatest (2025): $3,059 · -7.8% YoY. Source: county tax records.
Cash-flow waterfall
monthlySold comps — $/sqft
last 12 mo · ≤1 miLoading sold comps…