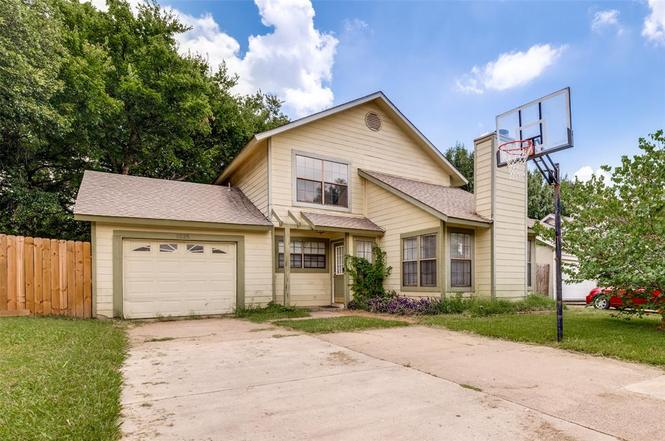
5525 Safari Trl · Arlington, TX
Flood risk 1/10 · Minimal
- FEMA flood zone
- X (unshaded)
- Chance of flooding over 30 yrs
- 0.0%
- Est. flood insurance / yr
- $507 – $1,088
Fire risk 3/10 · Minor
- Est. fire insurance / yr
- $1,222 – $2,270
Heat risk 7/10 · Major
- Hot days now (above 110°F)
- 7 days/yr
- Hot days in 30 yrs
- 23 days/yr
Wind risk 6/10 · Moderate
- Chance of severe wind over 30 yrs
- 27.0%
Air-quality risk 3/10 · Minor
- Unhealthy air days now
- 2 days/yr
- Unhealthy air days in 30 yrs
- 4 days/yr
Risk factors via First Street. Map © Google.
Why this score? — see what drove the C grade
The composite is a weighted blend of 9 inputs, each scored 0–100. Each bar is that input's sub-score; the figure is the points it added to the 100-point composite (weight × sub-score).
- Cash flow +17.3/30.0
- ARV discount +15.0/15.0
- DSCR +5.4/10.0
- 1% rule +5.1/10.0
- Livability +3.9/5.0
- Rent growth +2.8/5.0
- Schools +2.5/10.0
- Condition / age +2.5/5.0
- Appreciation +0.7/10.0
$240,000
🖨 Deal sheet 📄 Offer letter ✓ Due diligence
Listing remarks
An investor’s dream property or the perfect multi-generational home! This versatile 1,803 sq. ft. property boasts major high-ticket updates, including a hot water heater, a dishwasher, along with a complete roof replacement in 2016. The highly functional layout features two primary bedrooms, each equipped with its own spacious walk-in closet and dedicated dressing areas in the full bathrooms for maximum privacy and convenience. Natural light floods the home through two skylights, creating a bright and welcoming atmosphere. The main living space flows effortlessly into a charming breakfast nook for casual dining. Situated in a prime Southeast Arlington location, you will enjoy unbeata
Key facts
- 5,053 sq ft lot
- Garage
- Built 1985
Property features AI
Finance
- Financial info: Listing accepts cash and conventional financing
- HOA & community: No association
Exterior
- Parking: Attached garage (1 car); Covered parking space (1); On-street parking
- Utilities: City sewer; City water; Not in a municipal utility district
- Home design: Single family residence; Two levels; Residential property
- Construction: Built in 1985; Frame construction; Composition/shingle roof
- Exterior features: Interior lot; Less than 0.5 acre lot
Interior
- Kitchen: Dishwasher; Electric cooktop; Electric oven; Microwave
- Bedrooms: Four bedrooms total; Primary bedroom located on level 2; One bedroom on level 1; additional bedrooms on level 2
- Flooring: Carpet; Wood
- Bathrooms: Two full bathrooms
- Heating & cooling: Central heating; Central air conditioning
- Interior features: Walk-in closet(s); Seven total rooms; One living area; One dining area; Decorative fireplace
Neighborhood map
What this means for you Summary
Snapshot
- This is a 4-bed/2.0-bath single-family listed at $240k.
Deal economics
- At list price, monthly cash flow is $175 ($2k/yr) — positive.
- The deal already cash-flows at list — no discount required.
- Meets the 1% rule at list price ($2k rent vs $240k).
- Cap rate 7.2% vs local median 3.7% in Arlington — top-decile yield for the area; either an underpriced asset or a hidden risk that comps aren't pricing in. Stress-test before assuming the spread holds.
Location & tenants
- Location reads 78/100 on livability (#75 in TX, #2,697 nationally) — a middle-class / working-renter tenant base. Strengths: amenities A+, cost of living A+, housing A+; Watch: crime F, commute F.
- Arlington ISD (urban): math 24% / reading 34% proficiency, ranked #629 of 826 in TX (top 76%) — low school quality limits family demand, transient renter base, plan for 1-2y turnover.
- Zoned schools: Fitzgerald El (math 36% / reading 37%, grade F, #1,883 of 4,322 statewide, top 44%, 531 students, 86% FRL) — zoned schools average 86% FRL vs 60% district-wide (26 pts higher); higher-poverty schools than district average — tighter screening recommended.
- Market conditions: Rents rising (+1.4%/yr); 76 active listings in the ZIP; 40 comparable units currently listed for rent nearby; rentals at typical pace (median 25d on market — plan ~3-4 weeks tenant-placement turnaround); 42% of comp listings sitting > 30 days — soft ceiling on asking rent; solid renter incomes; 18,938 units permitted in Tarrant County in 2024 (8,336 in 5+ unit buildings).
- This rent runs 33% of the median local income ($88k/yr) — at the standard rent-burdened threshold; future hikes will face affordability resistance.
Forward outlook
- Local home prices are declining (-3.0%/yr); year-one equity from $2k of loan paydown is wiped out by about $7k of value loss. Plan a longer hold.
- Tarrant County population projected at +41% by 2050 — long-run rental-demand tailwind backs the buy-and-hold thesis.
Negotiation context
- Only 1 days on market — expect competitive offers; lowballing is unlikely to land.
Risks & watch-outs
- Climate carrying-cost: major wind risk, 27% chance of damaging wind over 30y; extreme-heat days projected 7→23/yr by 2055 (HVAC capex compounding) — expect insurance premiums to compound above CPI over the hold.
Questions for the listing agent
- Is there a deadline driving the sale (1031 exchange, divorce, estate, relocation)? That informs how much negotiation room exists.
- Schools are D-rated, which usually means shorter tenancies and higher turnover. Who's the typical renter profile here, and what's been the actual vacancy rate?
- Crime grade is F in this area — have there been break-ins, vandalism, or insurance claims at this property in the last 3 years? What carrier currently insures it and at what premium?
- What's the average days-on-market for RENTAL listings here right now (not sales)? A rising rental-DOM trend means longer vacancies and softer asking-rent achievability than the comps imply.
- What's the recent tenant-quality profile in this submarket — average credit score on applications, eviction rate, late-payment / NSF rate, and stable-employment percentage? A property-management company in the area should have these aggregated.
- How much new for-sale + rental construction is in the pipeline within 1–3 miles? Heavy new supply typically softens prices + rents 12–24 months out; constrained supply supports both.
Investment metrics
- 1% rule
- 1.01% ✓
- Cap rate
- 7.17%
- Cash-on-cash
- 3.12%
- DSCR
- 1.14
- GRM
- 8.3
CMA / ARV
- ARV (on-the-fly)
- $306,173
- Comps found
- 12
Show comp detail 12 sales within ~0.75 mi
| Address | Dist | Beds/Ba | Sqft | Sold | Price | $/sf | Match |
|---|---|---|---|---|---|---|---|
| 2018 Cliffside Dr | 0.52mi | 3/2.0 (-1) | 1,629 (+2%) | 6mo | $285,000 | $175 | 63 |
| 5615 Wellston Dr | 0.27mi | 3/2.0 (-1) | 1,499 (-6%) | 11mo | $299,999 | $200 | 62 |
| 5537 Four Winds Dr | 0.24mi | 3/2.0 (-1) | 1,393 (-13%) | 5mo | $257,000 | $184 | 57 |
| 1808 Wolf Creek Dr | 0.59mi | 3/2.0 (-1) | 1,722 (+7%) | 3mo | $348,888 | $203 | 52 |
| 1621 Loveland Dr | 0.66mi | 3/2.0 (-1) | 1,621 (+1%) | 12mo | $320,000 | $197 | 52 |
| 5536 Creekridge Dr | 0.29mi | 3/2.0 (-1) | 1,364 (-15%) | 7mo | $279,900 | $205 | 51 |
| 1507 Endicott Dr | 0.53mi | 3/2.0 (-1) | 1,725 (+8%) | 11mo | $310,000 | $180 | 48 |
| 1416 Garrison St | 0.57mi | 3/2.0 (-1) | 1,729 (+8%) | 10mo | $329,900 | $191 | 47 |
| 2200 Belton Dr | 0.62mi | 3/2.0 (-1) | 1,761 (+10%) | 5mo | $320,000 | $182 | 46 |
| 1514 Sayles Ave | 0.59mi | 3/2.0 (-1) | 1,832 (+14%) | 0mo | $340,000 | $186 | 43 |
| 4950 Highbank Dr | 0.62mi | 3/2.0 (-1) | 1,405 (-12%) | 2mo | $295,000 | $210 | 43 |
| 5703 Prescott Dr | 0.66mi | 3/2.0 (-1) | 1,800 (+12%) | 4mo | $300,000 | $167 | 40 |
Match score weights: distance 35% · size 25% · config 20% · recency 20%. Top-matched comps best support the ARV.
Projected returns pro-forma
-3.0% appreciation · 1.39% rent growth · sell at horizon
- IRR
- -13.3%
- Equity multiple
- 0.53×
- Total profit
- $-31,532
- Equity at exit
- $35,785
- IRR
- -7.1%
- Equity multiple
- 0.58×
- Total profit
- $-28,117
- Equity at exit
- $20,751
Cash invested: $67,200 (down + closing). Projections, not guarantees.
Landlord ↔ Tenant lean methodology
- Overall (STATE)
- 87 Strongly Landlord-Friendly
- State Texas
- 87 Strongly Landlord-Friendly · R+5
- County
- — inherits STATE
- City
- — inherits STATE
ZIP-level market 76018
- Home prices YoY
- -2.8%
- Rents YoY
- 1.4%
- Active inventory
- 76
- Price-to-rent
- 8.3×
Monthly cashflow live
- Estimated rent
- $2,423 high interval (Pro) →
- Mortgage (P&I)
- −$1,259
- Tax from tax record
- −$381 /mo · $4,569/yr
- Insurance
- −$100
- HOA
- −$0
- Vacancy / Maint / Mgmt
- −$509
- Net cashflow
- $175
Break-even live
UW: 25.0% down · 7.5% · 30yr · 1.5% tax · 5.0% vac · 8.0% maint · 8.0% mgmt
Financing live
Cash to close
- Down payment
- $60,000
- Closing costs
- $7,200
- Reserves months
- —
- Total cash needed
- —
Loan-product check · same deal, 3 products live
Conventional
25% down · 7.5% · 30yr
- Down + closing
- —
- Monthly P&I
- —
- Monthly cashflow
- —
- DSCR
- —
- Eligible?
- —
Personal DTI + credit; lowest rate.
DSCR
20% down · 8.5% · 30yr
- Down + closing
- —
- Monthly P&I
- —
- Monthly cashflow
- —
- DSCR
- —
- Eligible?
- —
No personal income docs; deal must DSCR.
Hard money
10% down · 12.0% · 12mo
- Down + closing
- —
- Monthly P&I
- —
- Monthly cashflow
- —
- DSCR
- —
- Eligible?
- —
Short-term bridge; refi at stabilization.
Rent comps 40 comps
| Address | Beds | Baths | Sqft | Rent | $/sqft | DOM | Units | Dist |
|---|---|---|---|---|---|---|---|---|
| 5416 Spring Willow Dr Arlington, TX | 4.0 | 2.0 | 1441 | $1,899 | $1.32 | 11d | 1 | 0.18mi |
| 1404 Ardmore Dr Arlington, TX | 4.0 | 2.5 | 1915 | $2,473 | $1.29 | 43d | 1 | 0.21mi |
| 1505 Gentle Wind Dr Arlington, TX | 3.0 | 1.0 | 1191 | $2,000 | $1.68 | 18d | 1 | 0.21mi |
| 5532 Four Winds Dr Arlington, TX | 3.0 | 2.0 | 1285 | $1,930 | $1.50 | 1d | 1 | 0.24mi |
| 1502 Barbara Ln Arlington, TX | 4.0 | 2.0 | 1847 | $2,071 | $1.12 | 43d | 1 | 0.40mi |
| 1733 Duster Cir Arlington, TX | 3.0 | 2.0 | 1650 | $2,125 | $1.29 | 43d | 1 | 0.62mi |
| 6014 Parkmeadow Dr Arlington, TX | 3.0 | 2.5 | 1940 | $2,450 | $1.26 | 13d | 1 | 0.64mi |
| 1408 Seely St Arlington, TX | 3.0 | 2.0 | 2125 | $2,350 | $1.11 | 4d | 1 | 0.70mi |
| 2131 Post Wood Ln Arlington, TX | 4.0 | 2.0 | 1955 | $2,700 | $1.38 | 10d | 1 | 0.73mi |
| 2222 Edinburgh St Arlington, TX | 3.0 | 2.0 | 1812 | $2,290 | $1.26 | 3d | 1 | 0.81mi |
| 2222 Edinburgh St Arlington, TX | 3.0 | 2.0 | 1812 | $2,290 | $1.26 | 19d | 1 | 0.81mi |
| 1521 Brookleaf Dr Arlington, TX | 3.0 | 2.0 | 1625 | $2,449 | $1.51 | 43d | 1 | 0.84mi |
| 6015 Harwood Crossing Dr Arlington, TX | 3.0 | 2.0 | 1643 | $2,200 | $1.34 | 14d | 1 | 0.86mi |
| 1805 Crimson Ct Arlington, TX | 3.0 | 2.0 | 1314 | $1,925 | $1.46 | 43d | 1 | 0.89mi |
| 6323 Brookbriar Ct Arlington, TX | 3.0 | 2.0 | 1575 | $2,727 | $1.73 | 44d | 1 | 0.92mi |
| 6323 Brookbriar Ct Arlington, TX | 3.0 | 2.0 | 1575 | $3,312 | $2.10 | 22d | 1 | 0.92mi |
| 5305 Manhassett Dr Arlington, TX | 3.0 | 2.0 | 1576 | $2,100 | $1.33 | 24d | 1 | 0.93mi |
| 2334 Belton Dr Arlington, TX | 3.0 | 2.0 | 1707 | $2,950 | $1.73 | 43d | 1 | 0.95mi |
| 2318 Bennington Dr Arlington, TX | 3.0 | 2.5 | 1615 | $2,295 | $1.42 | 24d | 1 | 0.96mi |
| 706 Langford Dr Arlington, TX | 3.0 | 2.0 | 1651 | $2,200 | $1.33 | 1d | 1 | 0.97mi |
| 4806 Shadyway Dr Arlington, TX | 3.0 | 2.0 | 1357 | $2,300 | $1.69 | 24d | 1 | 0.99mi |
| 2402 Bennington Dr Arlington, TX | 3.0 | 2.5 | 1909 | $2,145 | $1.12 | 43d | 1 | 0.99mi |
| 6406 Brookglen Dr Arlington, TX | 3.0 | 2.0 | 1320 | $2,185 | $1.66 | 43d | 1 | 1.01mi |
| 1100 Mapleview Dr Arlington, TX | 3.0 | 2.0 | 1580 | $2,098 | $1.33 | 43d | 1 | 1.01mi |
| 2411 Bennington Dr Arlington, TX | 3.0 | 2.5 | 1738 | $2,490 | $1.43 | 43d | 1 | 1.04mi |
| 6002 Rising Meadow Dr Arlington, TX | 3.0 | 2.0 | 1864 | $2,750 | $1.48 | 43d | 1 | 1.07mi |
| 2425 Bennington Dr Arlington, TX | 3.0 | 2.5 | 1738 | $2,325 | $1.34 | 4d | 1 | 1.09mi |
| 6101 Summerfield Dr Arlington, TX | 3.0 | 2.0 | 1575 | $2,440 | $1.55 | 7d | 1 | 1.12mi |
| 5809 Coldsworth Ct Arlington, TX | 3.0 | 2.0 | 1990 | $2,450 | $1.23 | 43d | 1 | 1.15mi |
| 6320 Merritt Way Ct Arlington, TX | 3.0 | 2.0 | 2142 | $2,650 | $1.24 | 24d | 1 | 1.18mi |
| 734 Port Richmond Way Arlington, TX | 3.0 | 2.0 | 1424 | $2,050 | $1.44 | 43d | 1 | 1.22mi |
| 4836 Gloucester Dr Grand Prairie, TX | 4.0 | 2.0 | 2074 | $2,450 | $1.18 | 16d | 1 | 1.26mi |
| 6002 Cohoke Dr Arlington, TX | 3.0 | 2.0 | 1575 | $2,050 | $1.30 | 43d | 1 | 1.26mi |
| 529 Nightshade Dr Arlington, TX | 3.0 | 2.0 | 1208 | $1,950 | $1.61 | 43d | 1 | 1.31mi |
| 708 Port Richmond Way Arlington, TX | 3.0 | 2.0 | 1180 | $1,900 | $1.61 | 10d | 1 | 1.32mi |
| 4450 S State Highway 360 Grand Prairie, TX | 2.0–4.0 | 2.0–3.0 | 1477 | $3,076 | $2.08 | 2d | 11 | 1.35mi |
| 6202 Tidewater Dr Arlington, TX | 3.0 | 2.0 | 1424 | $2,100 | $1.47 | 19d | 1 | 1.36mi |
| 6403 Jennie Ln Arlington, TX | 3.0 | 2.0 | 1491 | $2,400 | $1.61 | 43d | 1 | 1.39mi |
| 6410 Juliette Run Arlington, TX | 3.0 | 2.0 | 1563 | $2,009 | $1.29 | 11d | 1 | 1.40mi |
| 6703 Dusty Ridge Trl Arlington, TX | 3.0 | 2.0 | 1441 | $2,000 | $1.39 | 3d | 1 | 1.44mi |
Listing history 2 events
-
2026-06-18remarks 693-char remark
-
2026-06-18$240,000 Active 1 DOM
ⓘ Source: listings_history table (triggers on properties + properties_extension) + one-shot
backfill from property_details.listing_events for pre-trigger history.
Tax reassessment forecast TX · Resets to sale price
- Current annual tax
- $4,569 · $381/mo
- Projected year-2 tax
- $4,569 · $381/mo
- Expected delta
- $0/yr ($0/mo · 0.0%)
ⓘ Screening estimate from a state-policy table — verify with the county assessor before closing.
Climate risk First Street
- Flood 1/10 Low FEMA zone X (unshaded) · 0% chance over 30 yrs
- Wildfire 3/10 Moderate
- Heat 7/10 Severe 7 d/yr ≥110°F today · 23 d/yr by 30 yrs out
- Wind 6/10 Major 27% chance of damaging wind over 30 yrs
- Air quality 3/10 Moderate 2 unhealthy d/yr today · 4 by 30 yrs out
Nearby sold comps map
Loading sold comps map…
Walkable amenities ~0.75 mi
Loading nearby amenities…
Taxation est. · year 1
- Rental income
- $29,076
- − Mortgage interest
- −$13,444
- − Property taxes
- −$4,569
- − Insurance
- −$1,200
- − Repairs & maintenance
- −$2,326
- − Management
- −$2,326
- − Depreciation
- −$6,982
- Taxable loss
- −$1,771
- Est. tax savings @ 24.0%
- +$425
- After-tax cash flow
- $2,523/yr
For passive investors: Depreciation is non-cash, so a rental often shows a tax loss while cash-flowing — sheltering income. Rental losses are passive: they offset passive income freely, and up to $25,000/yr can offset ordinary (W-2) income if you actively participate and your MAGI is under $100k (phasing out to $0 by $150k); unused losses carry forward. On sale, claimed depreciation is recaptured at up to 25%, and gains may owe capital-gains tax (a 1031 exchange can defer both). Figures are a year-1 estimate at your 24.0% rate — not tax advice; consult a CPA.
Schools (NCES district)
- District
- Arlington ISD
- NCES district ID
- 4808700
- Math proficiency
- 24% ▼ -21.00%
- Reading proficiency
- 34% ▼ -8.00%
- Median HH income
- $50,873
- Composite
- 25.42/100
- National rank
- #7458
- State rank
- #629 of 826 in TX
Livability — Arlington
- Score
- 78/100
- State rank
- #75
- US rank
- #2697
Category grades
Schools grade is shown separately in the Schools card above.
Census & demographics
- Census place
- Arlington, TX
- County
- Tarrant County · 2,033,669 people
- City population
- 366,588
- Metro
- Dallas-Fort Worth-Arlington, TX
- Population (ZIP)
- 26,834
- Household income
- $88,288
- Rent vs Own
- Severe rent burden
- 598.0
Population outlook (Tarrant County) Hauer SSP2
- Today (2025)
- 2,380,417 people
- By 2030
- 2,578,900 · +8.3%
- By 2040
- 2,974,995 · +25.0%
- By 2050
- 3,350,489 · +40.8%
- By 2075
- 4,216,909 · +77.2%
- By 2100
- 4,741,527 · +99.2%
Race, ethnicity, and origin ACS 2023
- Neighborhood character
- Highly diverse neighborhood (Simpson 0.76)
- Race & ethnicity
- Hispanic / Latino 34% Black 24% White 23% Asian 14% Two or more races 14% Native American 2%
- Hispanic origin (detail)
- Mexican 26%
- Common ancestry
- Slovak 1% Romanian 1% Lithuanian 0%
- Foreign-born
- 20% · Canada, Vietnam
- Languages at home
- 62% English-only · Spanish 22% Vietnamese 11% French/Haitian/Cajun 1%
Political lean MEDSL · Tarrant
- 2024 margin
- Lean R (+5.1) · D 46.7% · R 51.9% · Other 1.4%
- 2008→2024 swing
- +6.6pp toward D · 2008: -11.7pp · 2024: -5.1pp
- All cycles
- 2024: R+5.1 2020: D+0.2 2016: R+8.7 2012: R+15.7 2008: R+11.7
Not yet ingested
- Civics
- —
Market trends
- HPI YoY
- ▼ -8.64%
- Current HPI
- 296.8765
- Rent YoY
- ▲ 1.39%
- Metro
- Dallas-Fort Worth-Arlington, TX
- State GDP YoY
- ▲ 3.95%
- F500 in state
- 110
Industry mix (Fortune 500 HQ in TX)
| Industry | F500 HQs | Revenue |
|---|---|---|
| Energy | 16 | $1,198B |
|
||
| Technology | 5 | $198B |
|
||
| Engineering / Construction | 4 | $72B |
|
||
| Energy Services | 3 | $60B |
|
||
| Utilities | 3 | $41B |
|
||
| Healthcare | 2 | $330B |
|
||
Price history
5 events — show timeline
- 2026-06-17 Listed $240,000 NTREIS
- 1999-04-05 Sold (Public Records) — Public Records
- 1995-09-07 Sold (Public Records) — Public Records
- 1995-09-07 Sold (Public Records) — Public Records
- 1986-03-19 Sold (Public Records) — Public Records
Property tax history
+4.3%/yrLatest (2025): $4,569 · -7.1% YoY. Source: county tax records.
Cash-flow waterfall
monthlySold comps — $/sqft
last 12 mo · ≤1 miLoading sold comps…