 🏗️ New Construction
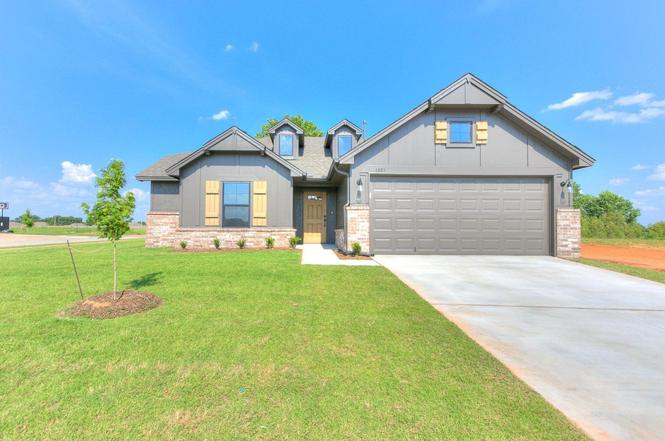
Phoenix Plan · Bixby, OK
Flood risk 1/10 · Minimal
- FEMA flood zone
- X (unshaded)
- Chance of flooding over 30 yrs
- 0.0%
- Est. flood insurance / yr
- $473 – $860
Fire risk 7/10 · Major
- Est. fire insurance / yr
- $2,463 – $4,575
Heat risk 6/10 · Moderate
- Hot days now (above 111°F)
- 7 days/yr
- Hot days in 30 yrs
- 18 days/yr
Wind risk 3/10 · Minor
- Chance of severe wind over 30 yrs
- 6.0%
Air-quality risk 2/10 · Minimal
- Unhealthy air days now
- 0 days/yr
- Unhealthy air days in 30 yrs
- 1 days/yr
Risk factors via First Street. Map © Google.
Why this score? — see what drove the F grade
The composite is a weighted blend of 9 inputs, each scored 0–100. Each bar is that input's sub-score; the figure is the points it added to the 100-point composite (weight × sub-score).
- ARV discount +7.5/15.0
- Cash flow +7.3/30.0
- Livability +3.6/5.0
- Schools +3.5/10.0
- Rent growth +3.3/5.0
- Condition / age +2.5/5.0
- 1% rule +2.0/10.0
- DSCR +1.4/10.0
- Appreciation +0.0/10.0
$299,490
🖨 Deal sheet 📄 Offer letter ✓ Due diligence
Key facts
- Walk-in closet
- Brick exteriors
- Open kitchen
Tags
Property features AI
Finance
- Other: Address: 15250 S 37th East Ave, Bixby OK 74008; Listing provided by Zillow (information deemed reliable but not guaranteed)
- Financial info: List price $299,490
Exterior
- Home design: Phoenix plan single-family home; Model/plan inventory: Plan; Active listing
- Construction: Living area approximately 1,535 square feet
- Exterior features: Located in Bixby, south-facing street prefix (S)
Interior
- Kitchen: Included in open living area (plan-specific)
- Bedrooms: 3 bedrooms
- Bathrooms: 2 full bathrooms
- Interior features: Open floor plan (Phoenix plan)
Neighborhood map
What this means for you Summary
Snapshot
- This is a 3-bed/2.0-bath single-family listed at $299k.
Deal economics
- At list price, monthly cash flow is $-497 ($-6k/yr) — negative.
- To cash-flow at today's rent, offer at most $295k (1.5% below list).
- To meet the 1% rule (rent ≥ 1% of price), the offer needs to be $258k (13.8% below list).
- Recommended offer: $258k (13.8% below list) — sets the bar for 1% rule.
- Cap rate 4.7% vs local median 3.6% in Bixby — meaningfully above typical; check what's discounted (condition, days-on-market, listing class) to confirm the premium yield is real.
Location & tenants
- Location reads 72/100 on livability (#24 in OK) — a middle-class / working-renter tenant base. Strengths: crime A+, employment A+, housing A+; Watch: amenities F, commute F, health & safety F.
- Bixby (suburban): math 39% / reading 36% proficiency, ranked #15 of 270 in OK (top 6%) — families likely to look elsewhere, expect single-tenant / working-renter base with shorter leases; only 19% free/reduced lunch — higher-income household profile.
- Market conditions: Rents rising (+3.3%/yr); 789 active listings in the ZIP; 3 comparable units currently listed for rent nearby; rentals at typical pace (median 16d on market — plan ~3-4 weeks tenant-placement turnaround); solid renter incomes; 2,818 units permitted in Tulsa County in 2024 (518 in 5+ unit buildings).
Forward outlook
- Local home prices are declining (-3.0%/yr); year-one equity from $3k of loan paydown is wiped out by about $11k of value loss. Plan a longer hold.
- Tulsa County population projected at +30% by 2050 — long-run rental-demand tailwind backs the buy-and-hold thesis.
Negotiation context
- It's been on market 348 days — a 12% lower offer ($264k) is reasonable based on typical stale-listing flexibility.
Risks & watch-outs
- Climate carrying-cost: major wildfire risk; extreme-heat days projected 7→18/yr by 2055 (HVAC capex compounding) — expect insurance premiums to compound above CPI over the hold.
Questions for the listing agent
- What do current leases actually rent for vs. the listed asking? Can we see a recent rent roll and the last 12 months of T-12 income?
- It's been on market 348 days. Have you received any prior offers? Is the seller open to a 14% concession, seller financing, or rate buy-down credit?
- Why hasn't it sold? Are there any deal-killer items the seller is aware of (foundation, flood, title, zoning, code violations)?
- Is there a deadline driving the sale (1031 exchange, divorce, estate, relocation)? That informs how much negotiation room exists.
- Schools are B-rated — typically a magnet for longer-tenancy family renters. What's the average tenant stay here, and is there a school-zone premium baked into asking?
- The area grade is low — what's the realistic commute time and amenity access for the typical tenant pool here? Any planned neighborhood developments (good or bad) we should know about?
- What's the average days-on-market for RENTAL listings here right now (not sales)? A rising rental-DOM trend means longer vacancies and softer asking-rent achievability than the comps imply.
- What's the recent tenant-quality profile in this submarket — average credit score on applications, eviction rate, late-payment / NSF rate, and stable-employment percentage? A property-management company in the area should have these aggregated.
- How much new for-sale + rental construction is in the pipeline within 1–3 miles? Heavy new supply typically softens prices + rents 12–24 months out; constrained supply supports both.
Investment metrics
- 1% rule
- 0.70% ✗
- Cap rate
- 4.67%
- Cash-on-cash
- -5.80%
- DSCR
- 0.74
- GRM
- 11.8
CMA / ARV
- ARV (on-the-fly)
- $366,865
- Comps found
- 4
Show comp detail 4 sales within ~0.75 mi
| Address | Dist | Beds/Ba | Sqft | Sold | Price | $/sf | Match |
|---|---|---|---|---|---|---|---|
| 3402 E 153rd St S | 0.13mi | 3/2.0 | 1,535 (0%) | 6mo | $336,229 | $219 | 89 |
| 3422 E 153rd Pl S | 0.12mi | 3/2.0 | 1,410 (-8%) | 3mo | $336,485 | $239 | 78 |
| 3555 E 156th St S | 0.27mi | 3/2.0 | 1,735 (+13%) | 13mo | $378,900 | $218 | 55 |
| 2606 E 151st St S | 0.42mi | 2/3.0 (-1) | 1,707 (+11%) | 8mo | $625,000 | $366 | 46 |
Match score weights: distance 35% · size 25% · config 20% · recency 20%. Top-matched comps best support the ARV.
Projected returns pro-forma
-3.0% appreciation · 3.34% rent growth · sell at horizon
- IRR
- -25.9%
- Equity multiple
- 0.12×
- Total profit
- $-90,167
- Equity at exit
- $54,701
- IRR
- -21.4%
- Equity multiple
- -0.12×
- Total profit
- $-115,443
- Equity at exit
- $31,720
Cash invested: $102,722 (down + closing). Projections, not guarantees.
Landlord ↔ Tenant lean methodology
- Overall (STATE)
- 83 Strongly Landlord-Friendly
- State Oklahoma
- 83 Strongly Landlord-Friendly · R+20
- County
- — inherits STATE
- City
- — inherits STATE
ZIP-level market 74008
- Rents YoY
- 3.3%
- Active inventory
- 789
- Price-to-rent
- 9.7×
Monthly cashflow live
- Estimated rent
- $2,580 medium interval (Pro) →
- Mortgage (P&I)
- −$1,924
- Tax est. 1.5%
- −$459 /mo · $5,503/yr
- Insurance
- −$153
- HOA
- −$0
- Vacancy / Maint / Mgmt
- −$542
- Net cashflow
- $-497
Break-even live
UW: 25.0% down · 7.5% · 30yr · 1.5% tax · 5.0% vac · 8.0% maint · 8.0% mgmt
Financing live
Cash to close
- Down payment
- $91,716
- Closing costs
- $11,006
- Reserves months
- —
- Total cash needed
- —
Loan-product check · same deal, 3 products live
Conventional
25% down · 7.5% · 30yr
- Down + closing
- —
- Monthly P&I
- —
- Monthly cashflow
- —
- DSCR
- —
- Eligible?
- —
Personal DTI + credit; lowest rate.
DSCR
20% down · 8.5% · 30yr
- Down + closing
- —
- Monthly P&I
- —
- Monthly cashflow
- —
- DSCR
- —
- Eligible?
- —
No personal income docs; deal must DSCR.
Hard money
10% down · 12.0% · 12mo
- Down + closing
- —
- Monthly P&I
- —
- Monthly cashflow
- —
- DSCR
- —
- Eligible?
- —
Short-term bridge; refi at stabilization.
Rent comps 3 comps
| Address | Beds | Baths | Sqft | Rent | $/sqft | DOM | Units | Dist |
|---|---|---|---|---|---|---|---|---|
| 14734 S Urbana Ave Bixby, OK | 4.0 | 2.0 | 2020 | $2,500 | $1.24 | 3d | 1 | 1.07mi |
| 14727 S Urbana Ave Bixby, OK | 3.0 | 2.0 | 2145 | $3,000 | $1.40 | 23d | 1 | 1.10mi |
| 14727 S Urbana Ave Bixby, OK | 3.0 | 2.0 | 2145 | $2,500 | $1.17 | 16d | 1 | 1.10mi |
Listing history 14 events
-
2026-06-18days on market $299,490 Active 348 DOM
-
2026-06-17days on market $299,490 Active 347 DOM
-
2026-06-16days on market $299,490 Active 346 DOM
-
2026-06-15days on market $299,490 Active 345 DOM
-
2026-06-13days on market $299,490 Active 343 DOM
-
2026-06-13days on market $299,490 Active 342 DOM
-
2026-06-10days on market $299,490 Active 340 DOM
-
2026-06-09days on market $299,490 Active 339 DOM
-
2026-06-08days on market $299,490 Active 338 DOM
-
2026-06-07days on market $299,490 Active 337 DOM
-
2026-06-03days on market $299,490 Active 333 DOM
-
2026-06-02days on market $299,490 Active 332 DOM
-
2026-06-01days on market $299,490 Active 331 DOM
-
2026-05-31days on market $299,490 Active 330 DOM
ⓘ Source: listings_history table (triggers on properties + properties_extension) + one-shot
backfill from property_details.listing_events for pre-trigger history.
Climate risk First Street
- Flood 1/10 Low FEMA zone X (unshaded) · 0% chance over 30 yrs
- Wildfire 7/10 Severe
- Heat 6/10 Major 7 d/yr ≥111°F today · 18 d/yr by 30 yrs out
- Wind 3/10 Moderate 6% chance of damaging wind over 30 yrs
- Air quality 2/10 Low 0 unhealthy d/yr today · 1 by 30 yrs out
Nearby sold comps map
Loading sold comps map…
Walkable amenities ~0.75 mi
Loading nearby amenities…
Taxation est. · year 1
- Rental income
- $30,964
- − Mortgage interest
- −$20,550
- − Property taxes
- −$5,503
- − Insurance
- −$1,834
- − Repairs & maintenance
- −$2,477
- − Management
- −$2,477
- − Depreciation
- −$10,672
- Taxable loss
- −$12,550
- Est. tax savings @ 24.0%
- +$3,012
- After-tax cash flow
- $-2,950/yr
For passive investors: Depreciation is non-cash, so a rental often shows a tax loss while cash-flowing — sheltering income. Rental losses are passive: they offset passive income freely, and up to $25,000/yr can offset ordinary (W-2) income if you actively participate and your MAGI is under $100k (phasing out to $0 by $150k); unused losses carry forward. On sale, claimed depreciation is recaptured at up to 25%, and gains may owe capital-gains tax (a 1031 exchange can defer both). Figures are a year-1 estimate at your 24.0% rate — not tax advice; consult a CPA.
Schools (NCES district)
- District
- Bixby
- NCES district ID
- 4004500
- Math proficiency
- 39% ▼ -13.00%
- Reading proficiency
- 36% ▼ -14.00%
- Median HH income
- $75,727
- Composite
- 34.9/100
- National rank
- #5081
- State rank
- #15 of 270 in OK
Livability — Bixby
- Score
- 72/100
- State rank
- #24
- US rank
- #6029
Category grades
Schools grade is shown separately in the Schools card above.
Census & demographics
- Census place
- Bixby, OK
- County
- Tulsa County · 640,811 people
- City population
- 34,006
- Metro
- Tulsa, OK
- Population (ZIP)
- 34,006
- Household income
- $104,000
- Rent vs Own
- Severe rent burden
- 525.0
Population outlook (Tulsa County) Hauer SSP2
- Today (2025)
- 723,846 people
- By 2030
- 766,033 · +5.8%
- By 2040
- 851,386 · +17.6%
- By 2050
- 938,389 · +29.6%
- By 2075
- 1,166,011 · +61.1%
- By 2100
- 1,350,277 · +86.5%
Race, ethnicity, and origin ACS 2023
- Neighborhood character
- Predominantly White (73%)
- Race & ethnicity
- White 73% Two or more races 15% Hispanic / Latino 9% Native American 5% Asian 2% Black 2%
- Hispanic origin (detail)
- Mexican 5%
- Common ancestry
- Italian 4% Slovak 2% Lithuanian 2%
- Foreign-born
- 5% · Canada
- Languages at home
- 92% English-only · Spanish 5% Other Indo-European 1%
Political lean MEDSL · Tulsa
- 2024 margin
- R (+15.2) · D 41.3% · R 56.5% · Other 2.2%
- 2008→2024 swing
- +9.2pp toward D · 2008: -24.5pp · 2024: -15.2pp
- All cycles
- 2024: R+15.2 2020: R+15.6 2016: R+22.9 2012: R+27.4 2008: R+24.5
Not yet ingested
- Civics
- —
Market trends
- HPI YoY
- ▼ -127.20%
- Current HPI
- 195.2538
- Rent YoY
- ▲ 3.34%
- Metro
- Tulsa, OK
- State GDP YoY
- ▲ 1.55%
- F500 in state
- 6
Industry mix (Fortune 500 HQ in OK)
| Industry | F500 HQs | Revenue |
|---|---|---|
| Energy | 3 | $48B |
|
||
Cash-flow waterfall
monthlySold comps — $/sqft
last 12 mo · ≤1 miLoading sold comps…