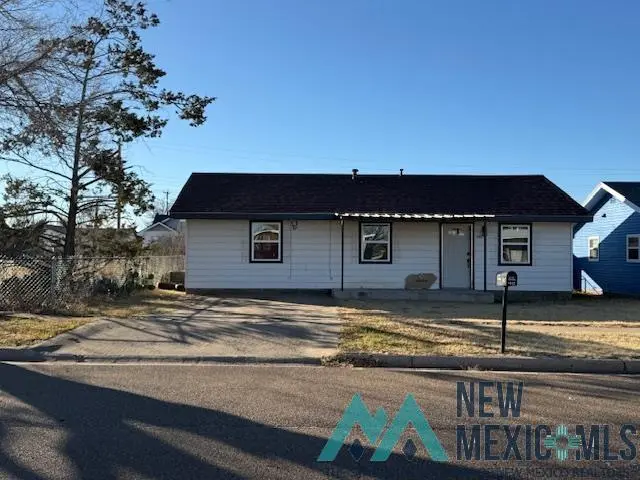
1415 S 6th St · Tucumcari, NM
Flood risk No data
- FEMA flood zone
- —
- Chance of flooding over 30 yrs
- —
- Est. flood insurance / yr
- —
Fire risk No data
- Est. fire insurance / yr
- —
Heat risk No data
- Hot days now (above threshold)
- —
- Hot days in 30 yrs
- —
Wind risk No data
- Chance of severe wind over 30 yrs
- —
Air-quality risk No data
- Unhealthy air days now
- —
- Unhealthy air days in 30 yrs
- —
Risk factors via First Street. Map © Google.
Why this score? — see what drove the D+ grade
The composite is a weighted blend of 9 inputs, each scored 0–100. Each bar is that input's sub-score; the figure is the points it added to the 100-point composite (weight × sub-score).
- Cash flow +17.9/30.0
- ARV discount +7.5/15.0
- DSCR +5.6/10.0
- 1% rule +3.6/10.0
- Appreciation +3.4/10.0
- Livability +2.9/5.0
- Rent growth +2.5/5.0
- Condition / age +2.5/5.0
- Schools +2.4/10.0
$110,000
🖨 Deal sheet (PDF) 📄 Offer letter ✓ Due diligence
Listing remarks MLS
3 bedroom 1 1/2 completely remodeled - - newer flooring, bathrooms, kitchen, vinyl windows & roof. Fenced backyard with a covered patio. This home is ready to move in!
Key facts
- Vinyl windows
- Newer flooring
- Remodeled kitchen
Tags
Neighborhood map
What this means for you Summary
Snapshot
- This is a 2-bed/1.0-bath single-family listed at $110k.
Deal economics
- At list price, monthly cash flow is $92 ($1k/yr) — positive.
- The deal already cash-flows at list — no discount required.
- To meet the 1% rule (rent ≥ 1% of price), the offer needs to be $95k (14.0% below list).
- Recommended offer: $95k (14.0% below list) — sets the bar for 1% rule.
Location & tenants
- Location reads 57/100 on livability (#166 in NM) — a working-class tenant base; expect higher turnover. Strengths: cost of living A+, housing B; Watch: crime F, amenities F, commute F.
- Tucumcari Public Schools (town): math 17% / reading 35% proficiency, ranked #47 of 95 in NM (top 50%) — low school quality limits family demand, transient renter base, plan for 1-2y turnover; 97% free/reduced lunch — lower-income household profile, screen leases tightly.
- Zoned schools: Tucumcari Elementary (450 students, 100% FRL); Tucumcari Middle (214 students, 100% FRL); Tucumcari High (math 15% / reading 44%, grade F, #75 of 110 statewide, top 70%, 243 students, 100% FRL) — zoned schools at 100% FRL track the district average.
- Market conditions: 26 active listings in the ZIP.
Forward outlook
- Local home prices are declining (-3.0%/yr); year-one equity from $761 of loan paydown is wiped out by about $3k of value loss. Plan a longer hold.
- Quay County population projected at -35% by 2050 — secular population decline; favor cash flow + early exit over multi-decade hold.
Negotiation context
- It's been on market 167 days — a 12% lower offer ($97k) is reasonable based on typical stale-listing flexibility.
Risks & watch-outs
- Watch-outs: built in 1955 — expect roof / HVAC / electrical / plumbing capex.
Questions for the listing agent
- It's been on market 167 days. Have you received any prior offers? Is the seller open to a 14% concession, seller financing, or rate buy-down credit?
- Built in 1955 — when were the roof, HVAC, electrical panel, plumbing, and water heater last replaced?
- Why hasn't it sold? Are there any deal-killer items the seller is aware of (foundation, flood, title, zoning, code violations)?
- Is there a deadline driving the sale (1031 exchange, divorce, estate, relocation)? That informs how much negotiation room exists.
- Schools are F-rated, which usually means shorter tenancies and higher turnover. Who's the typical renter profile here, and what's been the actual vacancy rate?
- Crime grade is F in this area — have there been break-ins, vandalism, or insurance claims at this property in the last 3 years? What carrier currently insures it and at what premium?
- The area grade is low — what's the realistic commute time and amenity access for the typical tenant pool here? Any planned neighborhood developments (good or bad) we should know about?
- What's the average days-on-market for RENTAL listings here right now (not sales)? A rising rental-DOM trend means longer vacancies and softer asking-rent achievability than the comps imply.
- What's the recent tenant-quality profile in this submarket — average credit score on applications, eviction rate, late-payment / NSF rate, and stable-employment percentage? A property-management company in the area should have these aggregated.
- How much new for-sale + rental construction is in the pipeline within 1–3 miles? Heavy new supply typically softens prices + rents 12–24 months out; constrained supply supports both.
Investment metrics
- 1% rule
- 0.86% ✗
- Cap rate
- 7.29%
- Cash-on-cash
- 3.57%
- DSCR
- 1.16
- GRM
- 9.7
CMA / ARV
- ARV (median comp)
- $35,000
- List price
- $110,000
- Delta
- 214.29%
- Verdict
- OVERPRICED
- Comps
- 1 within 2.0 mi
Projected returns pro-forma
-3.0% appreciation · 3.0% rent growth · sell at horizon
- IRR
- -10.7%
- Equity multiple
- 0.61×
- Total profit
- $-12,037
- Equity at exit
- $16,401
- IRR
- -1.5%
- Equity multiple
- 0.90×
- Total profit
- $-3,166
- Equity at exit
- $9,511
Cash invested: $30,800 (down + closing). Projections, not guarantees.
Landlord ↔ Tenant lean methodology
- Overall (STATE)
- 55 Moderately Landlord-Leaning
- State New Mexico
- 55 Moderately Landlord-Leaning · D+3
- County
- — inherits STATE
- City
- — inherits STATE
ZIP-level market 88401
- Home prices YoY
- -2.7%
- Active inventory
- 26
- Price-to-rent
- 9.7×
Monthly cashflow live
- Estimated rent
- $946 medium interval (Pro) →
- Mortgage (P&I)
- −$577
- Tax from tax record
- −$33 /mo · $400/yr
- Insurance
- −$46
- HOA
- −$0
- Vacancy / Maint / Mgmt
- −$199
- Net cashflow
- $92
Break-even live
Sensitivity live
| Price | -10% $154 | -5% $123 | +0% $92 | +5% $61 | +10% $29 |
|---|---|---|---|---|---|
| Rent | -10% $17 | -5% $54 | +0% $92 | +5% $129 | +10% $166 |
| Rate | -1.0pp $147 | -0.5pp $120 | base $92 | +0.5pp $63 | +1.0pp $34 |
UW: 25.0% down · 7.5% · 30yr · 1.5% tax · 5.0% vac · 8.0% maint · 8.0% mgmt
Financing live
Cash to close
- Down payment
- $27,500
- Closing costs
- $3,300
- Reserves months
- —
- Total cash needed
- —
Loan-product check · same deal, 3 products live
Conventional
25% down · 7.5% · 30yr
- Down + closing
- —
- Monthly P&I
- —
- Monthly cashflow
- —
- DSCR
- —
- Eligible?
- —
Personal DTI + credit; lowest rate.
DSCR
20% down · 8.5% · 30yr
- Down + closing
- —
- Monthly P&I
- —
- Monthly cashflow
- —
- DSCR
- —
- Eligible?
- —
No personal income docs; deal must DSCR.
Hard money
10% down · 12.0% · 12mo
- Down + closing
- —
- Monthly P&I
- —
- Monthly cashflow
- —
- DSCR
- —
- Eligible?
- —
Short-term bridge; refi at stabilization.
Listing history 18 events
-
2026-06-21days on market $110,000 Active 167 DOM
-
2026-06-21days on market $110,000 Active 166 DOM
-
2026-06-18days on market $110,000 Active 164 DOM
-
2026-06-17days on market $110,000 Active 163 DOM
-
2026-06-16days on market $110,000 Active 162 DOM
-
2026-06-15days on market $110,000 Active 161 DOM
-
2026-06-13days on market $110,000 Active 159 DOM
-
2026-06-12days on market $110,000 Active 158 DOM
-
2026-06-09days on market $110,000 Active 155 DOM
-
2026-06-08days on market $110,000 Active 154 DOM
-
2026-06-07days on market $110,000 Active 153 DOM
-
2026-06-05days on market $110,000 Active 151 DOM
-
2026-06-04days on market $110,000 Active 149 DOM
-
2026-06-02days on market $110,000 Active 148 DOM
-
2026-06-01days on market $110,000 Active 147 DOM
-
2026-05-31days on market $110,000 Active 146 DOM
-
2026-05-08price $110,000 173-char remark
Show marketing remark (173 chars)
3 bedroom 1 1/2 completely remodeled - - newer flooring, bathrooms, kitchen, vinyl windows & roof. Fenced backyard with a covered patio. This home is ready to move in!
-
2026-01-04$115,000 Active 173-char remark
Show marketing remark (173 chars)
3 bedroom 1 1/2 completely remodeled - - newer flooring, bathrooms, kitchen, vinyl windows & roof. Fenced backyard with a covered patio. This home is ready to move in!
ⓘ Source: listings_history table (triggers on properties + properties_extension) + one-shot
backfill from property_details.listing_events for pre-trigger history.
Tax reassessment forecast NM · Resets to sale price
- Current annual tax
- $400 · $33/mo
- Projected year-2 tax
- $880 · $73/mo
- Expected delta
- +$480/yr (+$40/mo · 120.2%)
ⓘ Screening estimate from a state-policy table — verify with the county assessor before closing.
Nearby sold comps map
Loading sold comps map…
Walkable amenities ~0.75 mi
Loading nearby amenities…
Taxation est. · year 1
- Rental income
- $11,357
- − Mortgage interest
- −$6,162
- − Property taxes
- −$400
- − Insurance
- −$550
- − Repairs & maintenance
- −$909
- − Management
- −$909
- − Depreciation
- −$3,200
- Taxable loss
- −$772
- Est. tax savings @ 24.0%
- +$185
- After-tax cash flow
- $1,285/yr
For passive investors: Depreciation is non-cash, so a rental often shows a tax loss while cash-flowing — sheltering income. Rental losses are passive: they offset passive income freely, and up to $25,000/yr can offset ordinary (W-2) income if you actively participate and your MAGI is under $100k (phasing out to $0 by $150k); unused losses carry forward. On sale, claimed depreciation is recaptured at up to 25%, and gains may owe capital-gains tax (a 1031 exchange can defer both). Figures are a year-1 estimate at your 24.0% rate — not tax advice; consult a CPA.
Schools (NCES district)
- District
- Tucumcari Public Schools
- NCES district ID
- 3502640
- Math proficiency
- 17% —
- Reading proficiency
- 35% —
- Median HH income
- $27,627
- Composite
- 23.71/100
- National rank
- #13236
- State rank
- #47 of 95 in NM
Livability — Tucumcari
- Score
- 57/100
- State rank
- #166
- US rank
- #22140
Category grades
Schools grade is shown separately in the Schools card above.
Census & demographics
- Census place
- Tucumcari, NM
- Population (ZIP)
- 6,689
Population outlook (Quay County) Hauer SSP2
- Today (2025)
- 7,255 people
- By 2030
- 6,656 · -8.3%
- By 2040
- 5,560 · -23.4%
- By 2050
- 4,702 · -35.2%
- By 2075
- 3,404 · -53.1%
- By 2100
- 2,593 · -64.3%
Race, ethnicity, and origin ACS 2023
- Neighborhood character
- Diverse neighborhood (Simpson 0.56)
- Race & ethnicity
- Hispanic / Latino 53% White 40% Two or more races 23% Native American 2% Black 1%
- Hispanic origin (detail)
- Mexican 30% Puerto Rican 1%
- Common ancestry
- Iranian 2% Serbian 1% Lithuanian 1%
- Foreign-born
- 1% · Canada
- Languages at home
- 77% English-only · Spanish 23%
Political lean MEDSL · Quay
- 2024 margin
- Solid R (+40.9) · D 28.5% · R 69.4% · Other 2.1%
- 2008→2024 swing
- -20.4pp toward R · 2008: -20.5pp · 2024: -40.9pp
- All cycles
- 2024: R+40.9 2020: R+37.8 2016: R+33.6 2012: R+22.0 2008: R+20.5
Not yet ingested
- Civics
- —
Market trends
- HPI YoY
- ▼ -3.16%
- Current HPI
- 115.4103
- Rent YoY
- —
- Metro
- —
- State GDP YoY
- —
- F500 in state
- 0
Price history
-4.3% since first listed2 events — show timeline
- 2026-05-08 Price Changed $110,000 NMMLS
- 2026-01-04 Listed $115,000 NMMLS
Property tax history
+3.0%/yrLatest (2025): $400 · +2.9% YoY. Source: county tax records.
Cash-flow waterfall
monthlySold comps — $/sqft
last 12 mo · ≤1 miLoading sold comps…