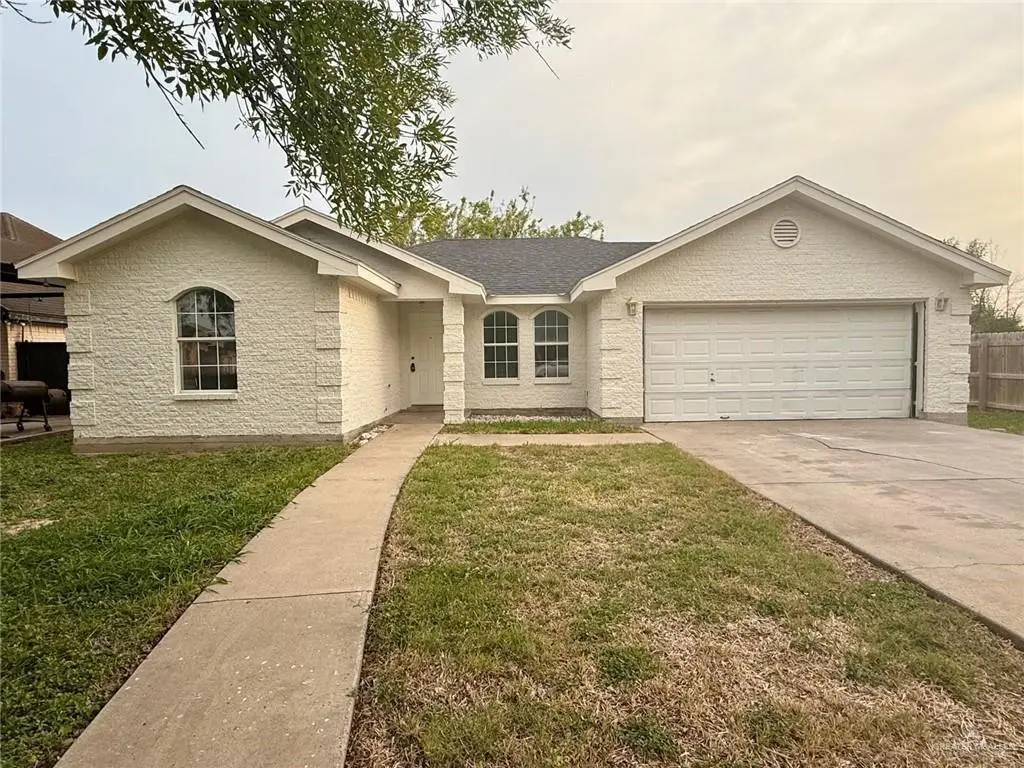
2208 Victoria St · Hidalgo, TX
Flood risk 1/10 · Minimal
- FEMA flood zone
- X (shaded)
- Chance of flooding over 30 yrs
- 0.0%
- Est. flood insurance / yr
- $507 – $1,088
Fire risk 5/10 · Moderate
- Est. fire insurance / yr
- $1,222 – $2,270
Heat risk 9/10 · Severe
- Hot days now (above 111°F)
- 7 days/yr
- Hot days in 30 yrs
- 22 days/yr
Wind risk 8/10 · Major
- Chance of severe wind over 30 yrs
- 96.0%
Air-quality risk 1/10 · Minimal
- Unhealthy air days now
- 0 days/yr
- Unhealthy air days in 30 yrs
- 0 days/yr
Risk factors via First Street. Map © Google.
Why this score? — see what drove the D grade
The composite is a weighted blend of 9 inputs, each scored 0–100. Each bar is that input's sub-score; the figure is the points it added to the 100-point composite (weight × sub-score).
- Appreciation +10.0/10.0
- Cash flow +8.0/30.0
- ARV discount +7.9/15.0
- Livability +3.4/5.0
- 1% rule +2.9/10.0
- Rent growth +2.5/5.0
- Schools +2.5/10.0
- Condition / age +2.5/5.0
- DSCR +2.0/10.0
$205,000
🖨 Deal sheet (PDF) 📄 Offer letter ✓ Due diligence
Listing remarks
This charming 3-bedroom, 2-bathroom home, spanning 1,270 square feet, is located in the heart of Hidalgo, Texas, and falls within the highly regarded Hidalgo Independent School District (Hidalgo ISD). Ideal for both families and investors, this property boasts spacious bedrooms, modern bathrooms with updated fixtures, and an efficiently designed layout that maximizes space and functionality. Situated in a thriving community, it offers easy access to schools, shopping, and local amenities. This home presents a fantastic investment opportunity, perfect for rental income or future resale in a growing market.
Key facts
- 7,940 sq ft lot
- 2 garage spots
- Built 1999
Property features AI
Finance
- HOA & community: No homeowners association
Exterior
- Parking: Attached 2-car garage; 2 covered parking spaces; Total of 2 parking spaces
- Utilities: Public water; City sewer
- Home design: Single-level residence
- Construction: Brick construction; Slab foundation; Composition shingle roof; Built area approximately 1,270
- Exterior features: Privacy fencing; Paved road access
Interior
- Kitchen: Electric cooktop; Refrigerator
- Flooring: Tile flooring
- Bathrooms: 2 full bathrooms
- Interior features: Entrance foyer; Countertops (other); Other interior features; No window coverings
- Laundry & utility: Laundry area; Electric water heater
Neighborhood map
What this means for you Summary
Snapshot
- This is a 3-bed/2.0-bath single-family listed at $205k.
Deal economics
- At list price, monthly cash flow is $-211 ($-3k/yr) — negative.
- To cash-flow at today's rent, offer at most $168k (18.2% below list).
- To meet the 1% rule (rent ≥ 1% of price), the offer needs to be $161k (21.3% below list).
- Recommended offer: $161k (21.3% below list) — sets the bar for 1% rule.
Location & tenants
- Location reads 68/100 on livability (#488 in TX) — a middle-class / working-renter tenant base. Strengths: cost of living A+, housing A+, crime A-; Watch: amenities F, commute F, employment F.
- Valley View ISD (suburban): math 24% / reading 38% proficiency, ranked #631 of 826 in TX (top 76%) — families likely to look elsewhere, expect single-tenant / working-renter base with shorter leases; 85% free/reduced lunch — lower-income household profile, screen leases tightly.
- Zoned schools: Valley View El (math 32% / reading 37%, grade F, #1,995 of 4,322 statewide, top 50%, 412 students, 96% FRL); Valley View J H (math 23% / reading 35%, grade F, #1,103 of 1,662 statewide, top 67%, 483 students, 95% FRL); Valley View H S (math 12% / reading 47%, grade F, #1,112 of 1,632 statewide, top 70%, 1,170 students, 96% FRL).
- Market conditions: 98 active listings in the ZIP; 6 comparable units currently listed for rent nearby; rentals at typical pace (median 25d on market — plan ~3-4 weeks tenant-placement turnaround); 7,378 units permitted in Hidalgo County in 2024 (641 in 5+ unit buildings).
Forward outlook
- In year one you build about $22k of equity ($1k loan paydown + $20k appreciation (10.0% local appreciation)).
- Hidalgo County population projected at +28% by 2050 — long-run rental-demand tailwind backs the buy-and-hold thesis.
- By year 2, paydown + projected appreciation supports a ~$35k cash-out refi (75% LTV) — recoverable capital for the next deal without selling this one.
Negotiation context
- It's been on market 52 days — a 3% lower offer ($199k) is reasonable based on typical stale-listing flexibility.
- 5 sale attempts since 2y ago with the ask held roughly flat each time — persistent listings suggest the price (not the market) is what's stuck; bring a comps-based counter.
Risks & watch-outs
- Climate carrying-cost: severe wind risk, 96% chance of damaging wind over 30y; moderate wildfire risk; extreme-heat days projected 7→22/yr by 2055 (HVAC capex compounding) — expect insurance premiums to compound above CPI over the hold.
Questions for the listing agent
- What do current leases actually rent for vs. the listed asking? Can we see a recent rent roll and the last 12 months of T-12 income?
- It's been on market 52 days. Have you received any prior offers? Is the seller open to a 21% concession, seller financing, or rate buy-down credit?
- Is there a deadline driving the sale (1031 exchange, divorce, estate, relocation)? That informs how much negotiation room exists.
- Schools are D-rated, which usually means shorter tenancies and higher turnover. Who's the typical renter profile here, and what's been the actual vacancy rate?
- The area grade is low — what's the realistic commute time and amenity access for the typical tenant pool here? Any planned neighborhood developments (good or bad) we should know about?
- What's the average days-on-market for RENTAL listings here right now (not sales)? A rising rental-DOM trend means longer vacancies and softer asking-rent achievability than the comps imply.
- What's the recent tenant-quality profile in this submarket — average credit score on applications, eviction rate, late-payment / NSF rate, and stable-employment percentage? A property-management company in the area should have these aggregated.
- How much new for-sale + rental construction is in the pipeline within 1–3 miles? Heavy new supply typically softens prices + rents 12–24 months out; constrained supply supports both.
Investment metrics
- 1% rule
- 0.79% ✗
- Cap rate
- 5.06%
- Cash-on-cash
- -4.42%
- DSCR
- 0.80
- GRM
- 10.6
CMA / ARV
- ARV (on-the-fly)
- $207,010
- Comps found
- 12
Show comp detail 12 sales within ~0.75 mi
| Address | Dist | Beds/Ba | Sqft | Sold | Price | $/sf | Match |
|---|---|---|---|---|---|---|---|
| 2406 Victoria St | 0.14mi | 3/1.5 | 1,275 (+0%) | 12mo | $208,000 | $163 | 81 |
| 2703 Torreon St | 0.29mi | 3/2.0 | 1,371 (+8%) | 2mo | $239,000 | $174 | 72 |
| 2908 Monterrey St | 0.41mi | 3/2.0 | 1,263 (-1%) | 11mo | $155,000 | $123 | 71 |
| 2114 Monterrey St | 0.13mi | 4/2.0 (+1) | 1,397 (+10%) | 2mo | $179,500 | $128 | 70 |
| 3009 Laurel St | 0.64mi | 3/2.0 | 1,250 (-2%) | 6mo | $234,000 | $187 | 63 |
| 405 S 23rd St | 0.53mi | 3/2.0 | 1,200 (-6%) | 7mo | $199,999 | $167 | 60 |
| 1502 Las Palmas Ave | 0.64mi | 3/2.0 | 1,277 (+1%) | 11mo | $237,000 | $186 | 60 |
| 2204 Gardenia Ave | 0.72mi | 3/2.0 | 1,325 (+4%) | 8mo | $140,000 | $106 | 52 |
| 2900 E Palo Blanco St | 0.70mi | 3/2.5 | 1,348 (+6%) | 6mo | $232,900 | $173 | 50 |
| 3000 Jarilla Ave | 0.54mi | 3/2.0 | 1,392 (+10%) | 14mo | $173,000 | $124 | 47 |
| 2513 Q St | 0.70mi | 3/2.0 | 1,347 (+6%) | 15mo | $215,000 | $160 | 45 |
| 3107 E Laurel St | 0.68mi | 3/2.0 | 1,438 (+13%) | 12mo | $189,000 | $131 | 36 |
Match score weights: distance 35% · size 25% · config 20% · recency 20%. Top-matched comps best support the ARV.
Projected returns pro-forma
10.0% appreciation · 3.0% rent growth · sell at horizon
- IRR
- 21.2%
- Equity multiple
- 2.71×
- Total profit
- $98,256
- Equity at exit
- $184,680
- IRR
- 19.2%
- Equity multiple
- 6.23×
- Total profit
- $300,065
- Equity at exit
- $398,270
Cash invested: $57,400 (down + closing). Projections, not guarantees.
Landlord ↔ Tenant lean methodology
- Overall (STATE)
- 87 Strongly Landlord-Friendly
- State Texas
- 87 Strongly Landlord-Friendly · R+5
- County
- — inherits STATE
- City
- — inherits STATE
ZIP-level market 78557
- Home prices YoY
- 17.9%
- Active inventory
- 98
- Price-to-rent
- 10.6×
Monthly cashflow live
- Estimated rent
- $1,613 high interval (Pro) →
- Mortgage (P&I)
- −$1,075
- Tax from tax record
- −$325 /mo · $3,905/yr
- Insurance
- −$85
- HOA
- −$0
- Vacancy / Maint / Mgmt
- −$339
- Net cashflow
- $-211
Break-even live
Sensitivity live
| Price | -10% $-95 | -5% $-153 | +0% $-211 | +5% $-269 | +10% $-327 |
|---|---|---|---|---|---|
| Rent | -10% $-339 | -5% $-275 | +0% $-211 | +5% $-148 | +10% $-84 |
| Rate | -1.0pp $-108 | -0.5pp $-159 | base $-211 | +0.5pp $-264 | +1.0pp $-318 |
UW: 25.0% down · 7.5% · 30yr · 1.5% tax · 5.0% vac · 8.0% maint · 8.0% mgmt
Financing live
Cash to close
- Down payment
- $51,250
- Closing costs
- $6,150
- Reserves months
- —
- Total cash needed
- —
Loan-product check · same deal, 3 products live
Conventional
25% down · 7.5% · 30yr
- Down + closing
- —
- Monthly P&I
- —
- Monthly cashflow
- —
- DSCR
- —
- Eligible?
- —
Personal DTI + credit; lowest rate.
DSCR
20% down · 8.5% · 30yr
- Down + closing
- —
- Monthly P&I
- —
- Monthly cashflow
- —
- DSCR
- —
- Eligible?
- —
No personal income docs; deal must DSCR.
Hard money
10% down · 12.0% · 12mo
- Down + closing
- —
- Monthly P&I
- —
- Monthly cashflow
- —
- DSCR
- —
- Eligible?
- —
Short-term bridge; refi at stabilization.
Rent comps 6 comps
| Address | Beds | Baths | Sqft | Rent | $/sqft | DOM | Units | Dist |
|---|---|---|---|---|---|---|---|---|
| 2509 Coma St Hidalgo, TX | 4.0 | 2.5 | 1804 | $1,750 | $0.97 | 25d | 1 | 0.33mi |
| 2304 E Tamarindo Ave Hidalgo, TX | 3.0 | 2.0 | 1442 | $1,950 | $1.35 | 25d | 1 | 0.86mi |
| 704 S 17th St Hidalgo, TX | 3.0 | 2.0 | 1666 | $1,650 | $0.99 | 25d | 1 | 0.93mi |
| 607 Buccaneer Dr Unit 4 Hidalgo, TX | 3.0 | 2.0 | 1068 | $1,600 | $1.50 | 45d | 1 | 0.96mi |
| 605 Buccaneer Dr Unit 3 Hidalgo, TX | 3.0 | 2.0 | 1068 | $1,400 | $1.31 | 25d | 1 | 0.99mi |
| 201 S 5th St Apt 15 Hidalgo, TX | 2.0 | 2.5 | 1172 | $895 | $0.76 | 45d | 1 | 1.41mi |
Listing history 33 events
-
2026-06-19days on market $205,000 Active 52 DOM
-
2026-06-18days on market $205,000 Active 51 DOM
-
2026-06-17days on market $205,000 Active 50 DOM
-
2026-06-16days on market $205,000 Active 49 DOM
-
2026-06-15days on market $205,000 Active 48 DOM
-
2026-06-14days on market $205,000 Active 46 DOM
-
2026-06-12days on market $205,000 Active 45 DOM
-
2026-06-09days on market $205,000 Active 42 DOM
-
2026-06-08days on market $205,000 Active 41 DOM
-
2026-06-07days on market $205,000 Active 40 DOM
-
2026-06-05days on market $205,000 Active 37 DOM
-
2026-06-03days on market $205,000 Active 36 DOM
-
2026-06-02days on market $205,000 Active 35 DOM
-
2026-06-01days on market $205,000 Active 34 DOM
-
2026-05-31days on market $205,000 Active 33 DOM
-
2026-05-30days on market $205,000 Active 32 DOM
-
2026-04-28$205,000 Active
-
2025-05-13price $209,000
-
2025-04-22$212,000 Active
-
2025-01-10soldstatus
-
2024-12-19soldstatus
-
2024-12-19soldstatus
-
2024-11-21status Pending
-
2024-11-13historical Option
-
2024-10-02status Active
-
2024-10-02price $180,000
-
2024-07-13status Active
-
2024-07-13price $170,000
-
2024-06-13status Pending
-
2024-06-04historical Option
-
2024-05-27$165,000 Active
-
2010-09-21soldstatus
-
1999-08-16soldstatus
ⓘ Source: listings_history table (triggers on properties + properties_extension) + one-shot
backfill from property_details.listing_events for pre-trigger history.
Tax reassessment forecast TX · Resets to sale price
- Current annual tax
- $3,905 · $325/mo
- Projected year-2 tax
- $3,905 · $325/mo
- Expected delta
- $0/yr ($0/mo · -0.0%)
ⓘ Screening estimate from a state-policy table — verify with the county assessor before closing.
Climate risk First Street
- Flood 1/10 Low FEMA zone X (shaded) · 0% chance over 30 yrs
- Wildfire 5/10 Major
- Heat 9/10 Extreme 7 d/yr ≥111°F today · 22 d/yr by 30 yrs out
- Wind 8/10 Severe 96% chance of damaging wind over 30 yrs
- Air quality 1/10 Low 0 unhealthy d/yr today · 0 by 30 yrs out
Nearby sold comps map
Loading sold comps map…
Walkable amenities ~0.75 mi
Loading nearby amenities…
Taxation est. · year 1
- Rental income
- $19,361
- − Mortgage interest
- −$11,483
- − Property taxes
- −$3,905
- − Insurance
- −$1,025
- − Repairs & maintenance
- −$1,549
- − Management
- −$1,549
- − Depreciation
- −$5,964
- Taxable loss
- −$6,114
- Est. tax savings @ 24.0%
- +$1,467
- After-tax cash flow
- $-1,068/yr
For passive investors: Depreciation is non-cash, so a rental often shows a tax loss while cash-flowing — sheltering income. Rental losses are passive: they offset passive income freely, and up to $25,000/yr can offset ordinary (W-2) income if you actively participate and your MAGI is under $100k (phasing out to $0 by $150k); unused losses carry forward. On sale, claimed depreciation is recaptured at up to 25%, and gains may owe capital-gains tax (a 1031 exchange can defer both). Figures are a year-1 estimate at your 24.0% rate — not tax advice; consult a CPA.
Schools (NCES district)
- District
- Valley View ISD
- NCES district ID
- 4843800
- Math proficiency
- 24% ▼ -42.00%
- Reading proficiency
- 38% ▼ -16.00%
- Median HH income
- $33,158
- Composite
- 25.37/100
- National rank
- #7473
- State rank
- #631 of 826 in TX
Livability — Hidalgo
- Score
- 68/100
- State rank
- #488
- US rank
- #9681
Category grades
Schools grade is shown separately in the Schools card above.
Census & demographics
- Census place
- Hidalgo, TX
- City population
- 14,250
- Population (ZIP)
- 14,250
Population outlook (Hidalgo County) Hauer SSP2
- Today (2025)
- 955,232 people
- By 2030
- 1,009,774 · +5.7%
- By 2040
- 1,120,332 · +17.3%
- By 2050
- 1,225,036 · +28.2%
- By 2075
- 1,439,189 · +50.7%
- By 2100
- 1,533,429 · +60.5%
Race, ethnicity, and origin ACS 2023
- Neighborhood character
- Predominantly Hispanic (99%)
- Race & ethnicity
- Hispanic / Latino 99% Two or more races 47%
- Hispanic origin (detail)
- Mexican 93%
- Foreign-born
- 39% · Canada
- Languages at home
- 6% English-only · Spanish 94%
Political lean MEDSL · Hidalgo
- 2024 margin
- Toss-up / Even · D 48.1% · R 51.0%
- 2008→2024 swing
- -41.6pp toward R · 2008: 38.7pp · 2024: -2.9pp
- All cycles
- 2024: R+2.9 2020: D+17.1 2016: D+40.5 2012: D+41.8 2008: D+38.7
Not yet ingested
- Civics
- —
Market trends
- HPI YoY
- ▲ 34.26%
- Current HPI
- 225.701
- Rent YoY
- —
- Metro
- —
- State GDP YoY
- ▲ 3.95%
- F500 in state
- 110
Industry mix (Fortune 500 HQ in TX)
| Industry | F500 HQs | Revenue |
|---|---|---|
| Energy | 16 | $1,198B |
|
||
| Technology | 5 | $198B |
|
||
| Engineering / Construction | 4 | $72B |
|
||
| Energy Services | 3 | $60B |
|
||
| Utilities | 3 | $41B |
|
||
| Healthcare | 2 | $330B |
|
||
Price history
+24.2% since first listed17 events — show timeline
- 2026-04-28 Listed $205,000 MCALLENMLS
- 2025-05-13 Price Changed $209,000 MCALLENMLS
- 2025-04-22 Listed $212,000 MCALLENMLS
- 2025-01-10 Sold (Public Records) — Public Records
- 2024-12-19 Sold (Public Records) — Public Records
- 2024-12-19 Sold (Public Records) — Public Records
- 2024-11-21 Pending — MCALLENMLS
- 2024-11-13 Contingent — MCALLENMLS
- 2024-10-02 Relisted — MCALLENMLS
- 2024-10-02 Price Changed $180,000 MCALLENMLS
- 2024-07-13 Relisted — MCALLENMLS
- 2024-07-13 Price Changed $170,000 MCALLENMLS
- 2024-06-13 Pending — MCALLENMLS
- 2024-06-04 Contingent — MCALLENMLS
- 2024-05-27 Listed $165,000 MCALLENMLS
- 2010-09-21 Sold (Public Records) — Public Records
- 1999-08-16 Sold (Public Records) — Public Records
Property tax history
+5.3%/yrLatest (2025): $3,905 · -4.9% YoY. Source: county tax records.
Cash-flow waterfall
monthlySold comps — $/sqft
last 12 mo · ≤1 miLoading sold comps…