10401 N Cave Creek Rd #158 · Phoenix, AZ
Flood risk 1/10 · Minimal
- FEMA flood zone
- X (shaded)
- Chance of flooding over 30 yrs
- 0.0%
- Est. flood insurance / yr
- $507 – $1,088
Fire risk 2/10 · Minimal
- Est. fire insurance / yr
- $610 – $1,132
Heat risk 8/10 · Major
- Hot days now (above 110°F)
- 6 days/yr
- Hot days in 30 yrs
- 15 days/yr
Wind risk 1/10 · Minimal
- Chance of severe wind over 30 yrs
- —
Air-quality risk 3/10 · Minor
- Unhealthy air days now
- 3 days/yr
- Unhealthy air days in 30 yrs
- 4 days/yr
Risk factors via First Street. Map © Google.
Why this score? — see what drove the C+ grade
The composite is a weighted blend of 9 inputs, each scored 0–100. Each bar is that input's sub-score; the figure is the points it added to the 100-point composite (weight × sub-score).
- Cash flow +30.0/30.0
- 1% rule +10.0/10.0
- DSCR +10.0/10.0
- Livability +3.8/5.0
- Schools +2.3/10.0
- Condition / age +2.2/5.0
- Rent growth +2.1/5.0
- ARV discount +0.0/15.0
- Appreciation +0.0/10.0
$37,500
🖨 Deal sheet 📄 Offer letter ✓ Due diligence
Listing remarks
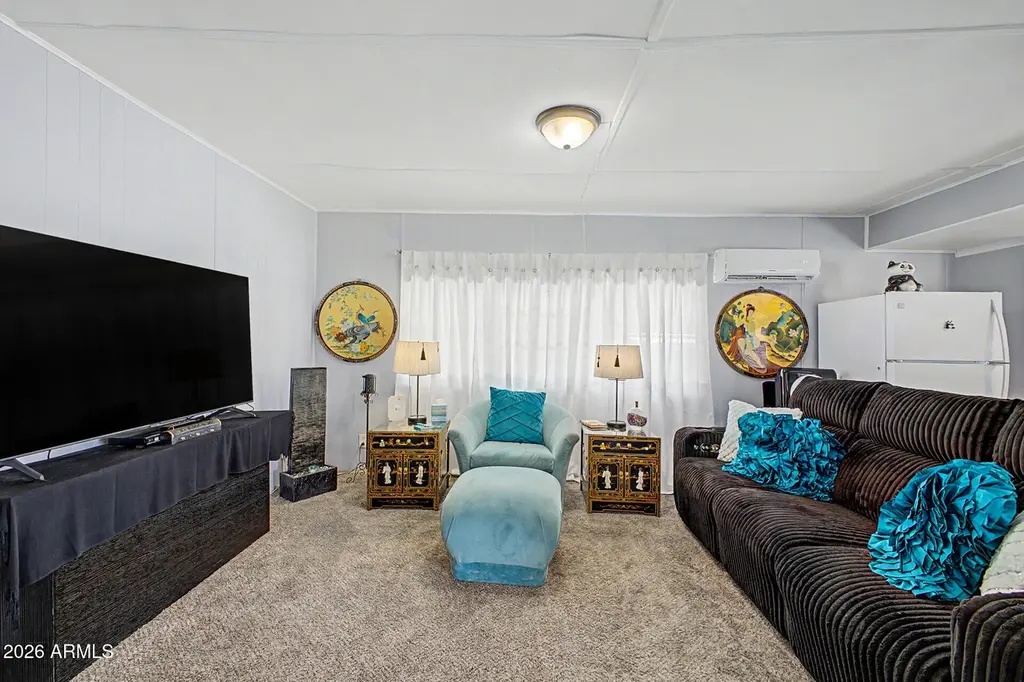
On Lease Land: Check out this adorable 2-bedroom, 1-bathroom mobile home in a 55+ community! Discover the bright living areas ready to bring you joy, showcasing soft carpeting underfoot, tile in select areas, a soothing palette that makes every space feel welcoming, and plenty of natural light. The kitchen boasts crisp white cabinetry for ample storage, shelves, spacious counters, and built-in appliances for a seamless cooking experience. The main bedroom promises a good night's sleep, complete with a private exit for added comfort and a bathroom. Convenient laundry room inside. Out back, you'll have a cozy covered patio perfect for morning coffee. What are you waiting for? Make it yours no
Key facts
- Spacious counters
- Soft carpeting
- Bright living areas
Tags
Property features AI
Finance
- HOA & community: Land lease with a monthly fee of $820; No association fees; Community pool
Exterior
- Parking: 1 covered parking space; 1 open parking space; 1 carport space
- Utilities: City water and private water company; Private sewer
- Home design: Manufactured/mobile housing; Leasehold ownership
- Construction: Vertical siding and painted wood frame construction; Metal roof
- Exterior features: Desert front and back landscaping; Storage; Chain-link and wood fencing; Private maintained road; Mountain view
Interior
- Kitchen: Laminate counters; Pantry; Refrigerator; Disposal
- Bedrooms: 2 possible bedrooms
- Flooring: Carpet; Tile
- Bathrooms: 1 full bathroom (total 1 bathroom)
- Heating & cooling: Heat pump heating (electric); Ceiling fan(s); Programmable thermostat; Has heating and cooling
- Interior features: High-speed internet; No interior steps; Pantry; 3/4 bath in master bedroom; Bath grab bars; Storage
- Laundry & utility: Laundry located inside
Neighborhood map
What this means for you Summary
Snapshot
- This is a 2-bed/1.0-bath manufactured listed at $38k. Condition is rated fair.
Deal economics
- At list price, monthly cash flow is $746 ($9k/yr) — positive.
- The deal already cash-flows at list — no discount required.
- Meets the 1% rule at list price ($1k rent vs $38k).
- Recommended offer: $37k (1.5% below list) — sets the bar for market timing.
- Cap rate 30.2% vs local median 3.3% in Phoenix — top-decile yield for the area; either an underpriced asset or a hidden risk that comps aren't pricing in. Stress-test before assuming the spread holds.
Location & tenants
- Location reads 75/100 on livability (#16 in AZ, #3,924 nationally) — a middle-class / working-renter tenant base. Strengths: amenities A+, commute A+, housing A+; Watch: health & safety C-, crime F.
- Glendale Union High School District (4285) (urban): math 23% / reading 31% proficiency, ranked #130 of 249 in AZ (top 52%) — low school quality limits family demand, transient renter base, plan for 1-2y turnover.
- Market conditions: Rents soft (-1.8%/yr); 288 active listings in the ZIP; 40 comparable units currently listed for rent nearby; rentals leasing fast (median 1d on market — plan ~1-2 weeks tenant-placement turnaround); solid renter incomes; 36,011 units permitted in Maricopa County in 2024 (12,801 in 5+ unit buildings).
Forward outlook
- Local home prices are declining (-3.0%/yr); year-one equity from $259 of loan paydown is wiped out by about $1k of value loss. Plan a longer hold.
- Maricopa County population projected at +38% by 2050 — long-run rental-demand tailwind backs the buy-and-hold thesis.
- At projected returns (-3.0% appreciation + 0.0% rent growth), your $10k cash investment doubles in ~2 years — after that, you're playing with house money.
Negotiation context
- It's been on market 16 days — a 2% lower offer ($37k) is reasonable based on typical stale-listing flexibility.
Risks & watch-outs
- Climate carrying-cost: extreme-heat days projected 6→15/yr by 2055 (HVAC capex compounding) — expect insurance premiums to compound above CPI over the hold.
Questions for the listing agent
- Have any recent inspections been done? Can we get a copy of the seller's disclosures and any deferred-maintenance estimates?
- Built in 1967 — when were the roof, HVAC, electrical panel, plumbing, and water heater last replaced?
- Is there a deadline driving the sale (1031 exchange, divorce, estate, relocation)? That informs how much negotiation room exists.
- Crime grade is F in this area — have there been break-ins, vandalism, or insurance claims at this property in the last 3 years? What carrier currently insures it and at what premium?
- What's the average days-on-market for RENTAL listings here right now (not sales)? A rising rental-DOM trend means longer vacancies and softer asking-rent achievability than the comps imply.
- What's the recent tenant-quality profile in this submarket — average credit score on applications, eviction rate, late-payment / NSF rate, and stable-employment percentage? A property-management company in the area should have these aggregated.
- How much new for-sale + rental construction is in the pipeline within 1–3 miles? Heavy new supply typically softens prices + rents 12–24 months out; constrained supply supports both.
Investment metrics
- 1% rule
- 3.39% ✓
- Cap rate
- 30.18%
- Cash-on-cash
- 85.30%
- DSCR
- 4.80
- GRM
- 2.5
CMA / ARV
- ARV (on-the-fly)
- $28,800
- Comps found
- 9
Show comp detail 9 sales within ~0.75 mi
| Address | Dist | Beds/Ba | Sqft | Sold | Price | $/sf | Match |
|---|---|---|---|---|---|---|---|
| 10401 N Cave Creek Rd #252 | 0.16mi | 2/1.5 | 912 (+1%) | 9mo | $29,000 | $32 | 81 |
| 10401 N Cave Creek Rd #93 | 0.00mi | 3/2.0 (+1) | 952 (+6%) | 1mo | $18,700 | $20 | 81 |
| 10401 N Cave Creek Rd #301 | 0.09mi | 2/1.0 | 850 (-6%) | 9mo | $24,000 | $28 | 79 |
| 10401 N Cave Creek Rd #242 | 0.09mi | 2/1.5 | 896 (-0%) | 23mo | $42,500 | $47 | 74 |
| 10401 N Cave Creek Rd #315 | 0.09mi | 2/1.0 | 860 (-4%) | 19mo | $27,500 | $32 | 73 |
| 10401 N Cave Creek Rd #50 | 0.00mi | 2/2.0 | 1,030 (+14%) | 4mo | $57,500 | $56 | 69 |
| 10401 N Cave Creek Rd #275 | 0.16mi | 2/1.0 | 792 (-12%) | 8mo | $45,000 | $57 | 66 |
| 10401 N Cave Creek Rd #12 | 0.16mi | 2/2.0 | 980 (+9%) | 10mo | $47,500 | $48 | 65 |
| 10401 N Cave Creek Rd #263 | 0.16mi | 1/1.0 (-1) | 784 (-13%) | 18mo | $22,000 | $28 | 51 |
Match score weights: distance 35% · size 25% · config 20% · recency 20%. Top-matched comps best support the ARV.
Projected returns pro-forma
-3.0% appreciation · 0.0% rent growth · sell at horizon
- IRR
- 82.3%
- Equity multiple
- 4.60×
- Total profit
- $37,752
- Equity at exit
- $5,591
- IRR
- 84.9%
- Equity multiple
- 8.60×
- Total profit
- $79,750
- Equity at exit
- $3,242
Cash invested: $10,500 (down + closing). Projections, not guarantees.
Landlord ↔ Tenant lean methodology
- Overall (STATE)
- 87 Strongly Landlord-Friendly
- State Arizona
- 87 Strongly Landlord-Friendly · R+3
- County
- — inherits STATE
- City
- — inherits STATE
ZIP-level market 85020
- Rents YoY
- -1.8%
- Active inventory
- 288
- Price-to-rent
- 2.5×
Monthly cashflow live
- Estimated rent
- $1,273 high interval (Pro) →
- Mortgage (P&I)
- −$197
- Tax est. 1.5%
- −$47 /mo · $562/yr
- Insurance
- −$16
- HOA
- −$0
- Vacancy / Maint / Mgmt
- −$267
- Net cashflow
- $746
Break-even live
UW: 25.0% down · 7.5% · 30yr · 1.5% tax · 5.0% vac · 8.0% maint · 8.0% mgmt
Financing live
Cash to close
- Down payment
- $9,375
- Closing costs
- $1,125
- Reserves months
- —
- Total cash needed
- —
Loan-product check · same deal, 3 products live
Conventional
25% down · 7.5% · 30yr
- Down + closing
- —
- Monthly P&I
- —
- Monthly cashflow
- —
- DSCR
- —
- Eligible?
- —
Personal DTI + credit; lowest rate.
DSCR
20% down · 8.5% · 30yr
- Down + closing
- —
- Monthly P&I
- —
- Monthly cashflow
- —
- DSCR
- —
- Eligible?
- —
No personal income docs; deal must DSCR.
Hard money
10% down · 12.0% · 12mo
- Down + closing
- —
- Monthly P&I
- —
- Monthly cashflow
- —
- DSCR
- —
- Eligible?
- —
Short-term bridge; refi at stabilization.
Rent comps 40 comps
| Address | Beds | Baths | Sqft | Rent | $/sqft | DOM | Units | Dist |
|---|---|---|---|---|---|---|---|---|
| 1525 E Cheryl Dr Phoenix, AZ | 1.0–2.0 | 1.0–2.0 | 843 | $1,157 | $1.37 | 1d | 6 | 0.14mi |
| 1420 E Brown St Unit C Phoenix, AZ | 2.0 | 1.0 | 840 | $1,295 | $1.54 | 1d | 1 | 0.16mi |
| 10410 N Cave Creek Rd Phoenix, AZ | 2.0–3.0 | 2.0 | 1227 | $1,400 | $1.14 | 1d | 4 | 0.19mi |
| 1551 E Christy Dr Phoenix, AZ | 2.0 | 1.0 | 702 | $950 | $1.35 | 24d | 1 | 0.21mi |
| 10644 N 15th Way Apt 3 Phoenix, AZ | 2.0 | 1.0 | 750 | $1,050 | $1.40 | 7d | 1 | 0.28mi |
| 10644 N 15th Way Apt 3 Phoenix, AZ | 2.0 | 1.0 | 750 | $1,050 | $1.40 | 24d | 1 | 0.28mi |
| 10644 N 15th Way Unit 08 Phoenix, AZ | 1.0 | 1.0 | 550 | $925 | $1.68 | 7d | 1 | 0.28mi |
| 9838 N 14th St #3 Phoenix, AZ | 1.0 | 1.0 | 550 | $1,150 | $2.09 | 1d | 1 | 0.30mi |
| 9816 N 15th St Unit 2 Phoenix, AZ | 1.0 | 1.0 | 780 | $1,200 | $1.54 | 1d | 1 | 0.32mi |
| 1346 E Mountain View Rd Unit 208 Phoenix, AZ | 2.0 | 1.0 | 800 | $999 | $1.25 | 1d | 1 | 0.35mi |
| 1336 E Mountain View Rd Phoenix, AZ | 2.0 | 2.0 | 885 | $1,150 | $1.30 | 1d | 2 | 0.36mi |
| 1336 E Mountain View Rd Phoenix, AZ | 2.0 | 2.0 | 885 | $1,250 | $1.41 | 23d | 2 | 0.36mi |
| 1336 E Mountain View Rd Unit 105 Phoenix, AZ | 2.0 | 2.0 | 885 | $1,350 | $1.53 | 17d | 1 | 0.36mi |
| 1247 E Cinnabar Ave Phoenix, AZ | 2.0 | 1.0 | 850 | $999 | $1.18 | 1d | 5 | 0.38mi |
| 1241 E Cinnabar Ave Unit 104A Phoenix, AZ | 2.0 | 1.0 | 848 | $999 | $1.18 | 23d | 1 | 0.38mi |
| 1241 E Cinnabar Ave Unit 102A Phoenix, AZ | 2.0 | 1.0 | 848 | $999 | $1.18 | 1d | 1 | 0.38mi |
| 1168 E Cochise Dr Phoenix, AZ | 2.0 | 2.5 | 1038 | $1,795 | $1.73 | 1d | 1 | 0.40mi |
| 1222 E Mountain View Rd #114 Phoenix, AZ | 2.0 | 1.0 | 783 | $1,099 | $1.40 | 16d | 1 | 0.46mi |
| 1222 E Mountain View Rd Phoenix, AZ | 2.0 | 1.0 | 783 | $1,024 | $1.31 | 1d | 3 | 0.47mi |
| 1230 E Purdue Ave Phoenix, AZ | 2.0 | 1.0 | 1000 | $1,450 | $1.45 | 1d | 1 | 0.49mi |
| 1306 E Purdue Ave Unit 4 Phoenix, AZ | 2.0 | 2.0 | 930 | $1,545 | $1.66 | 1d | 1 | 0.49mi |
| 10420 N 11th St #3 Phoenix, AZ | 2.0 | 1.0 | 1060 | $1,750 | $1.65 | 12d | 1 | 0.50mi |
| 1321 E Carol Ave Apt 3 Phoenix, AZ | 2.0 | 1.0 | 850 | $1,495 | $1.76 | 1d | 1 | 0.57mi |
| 10420 N 10th St #3 Phoenix, AZ | 2.0 | 1.5 | 1060 | $1,625 | $1.53 | 1d | 1 | 0.58mi |
| 10215 N 8th Pl Phoenix, AZ | 2.0 | 1.0 | 882 | $1,349 | $1.53 | 1d | 1 | 0.66mi |
| 9215 N 13th Pl Unit 5 Phoenix, AZ | 2.0 | 1.0 | 670 | $1,200 | $1.79 | 1d | 1 | 0.71mi |
| 731 E North Ln #3 Phoenix, AZ | 2.0 | 1.0 | 1060 | $1,900 | $1.79 | 1d | 1 | 0.79mi |
| 10001 N 7th St Phoenix, AZ | 2.0 | 1.0–2.0 | 604 | $1,229 | $2.03 | 1d | 11 | 0.86mi |
| 1401 E Dunlap Ave Unit 1413-04 Phoenix, AZ | 2.0 | 2.0 | 990 | $1,325 | $1.34 | 1d | 1 | 0.88mi |
| 823 E Carol Ave Unit 2 Phoenix, AZ | 2.0 | 1.0 | 532 | $1,200 | $2.26 | 1d | 1 | 0.89mi |
| 1136 E Eva St Phoenix, AZ | 2.0 | 1.0 | 736 | $1,600 | $2.17 | 1d | 1 | 0.90mi |
| 9514 N 8th St Unit 202 Phoenix, AZ | 2.0 | 1.0 | 724 | $1,050 | $1.45 | 1d | 1 | 0.92mi |
| 9028 N 11th St Unit 2 Phoenix, AZ | 2.0 | 1.0 | 850 | $1,050 | $1.24 | 1d | 1 | 0.95mi |
| 10002 N 7th St Phoenix, AZ | 1.0–3.0 | 1.0–2.0 | 1092 | $1,675 | $1.53 | 1d | 23 | 0.96mi |
| 888 E Clinton St Phoenix, AZ | 1.0–3.0 | 1.0–2.0 | 1024 | $1,559 | $1.52 | 1d | 30 | 0.98mi |
| 1027 E Dunlap Ave Unit 3 Phoenix, AZ | 2.0 | 1.0 | 550 | $1,100 | $2.00 | 1d | 1 | 1.02mi |
| 723 E Sunnyslope Ln Phoenix, AZ | 2.0 | 1.0 | 800 | $1,695 | $2.12 | 2d | 1 | 1.05mi |
| 723 E Sunnyslope Ln Phoenix, AZ | 2.0 | 1.0 | 794 | $1,695 | $2.13 | 1d | 1 | 1.05mi |
| 8916 N 11th St Unit A Phoenix, AZ | 1.0 | 1.0 | 799 | $900 | $1.13 | 2d | 1 | 1.06mi |
| 9603 N 5th St Unit B Phoenix, AZ | 1.0 | 1.0 | 530 | $945 | $1.78 | 10d | 1 | 1.08mi |
Listing history 11 events
-
2026-06-18days on market $37,500 Active 16 DOM
-
2026-06-17days on market $37,500 Active 15 DOM
-
2026-06-16days on market $37,500 Active 14 DOM
-
2026-06-15days on market $37,500 Active 13 DOM
-
2026-06-13days on market $37,500 Active 11 DOM
-
2026-06-09days on market $37,500 Active 7 DOM
-
2026-06-08days on market $37,500 Active 6 DOM
-
2026-06-07days on market $37,500 Active 5 DOM
-
2026-06-04days on market $37,500 Active 2 DOM
-
2026-06-02remarks 699-char remark
-
2026-06-02$37,500 Active 1 DOM
ⓘ Source: listings_history table (triggers on properties + properties_extension) + one-shot
backfill from property_details.listing_events for pre-trigger history.
Climate risk First Street
- Flood 1/10 Low FEMA zone X (shaded) · 0% chance over 30 yrs
- Wildfire 2/10 Low
- Heat 8/10 Severe 6 d/yr ≥110°F today · 15 d/yr by 30 yrs out
- Wind 1/10 Low
- Air quality 3/10 Moderate 3 unhealthy d/yr today · 4 by 30 yrs out
Nearby sold comps map
Loading sold comps map…
Walkable amenities ~0.75 mi
Loading nearby amenities…
Taxation est. · year 1
- Rental income
- $15,274
- − Mortgage interest
- −$2,101
- − Property taxes
- −$562
- − Insurance
- −$188
- − Repairs & maintenance
- −$1,222
- − Management
- −$1,222
- − Depreciation
- −$1,091
- Taxable income
- $8,889
- Est. tax owed @ 24.0%
- −$2,133
- After-tax cash flow
- $6,824/yr
For passive investors: Depreciation is non-cash, so a rental often shows a tax loss while cash-flowing — sheltering income. Rental losses are passive: they offset passive income freely, and up to $25,000/yr can offset ordinary (W-2) income if you actively participate and your MAGI is under $100k (phasing out to $0 by $150k); unused losses carry forward. On sale, claimed depreciation is recaptured at up to 25%, and gains may owe capital-gains tax (a 1031 exchange can defer both). Figures are a year-1 estimate at your 24.0% rate — not tax advice; consult a CPA.
Condition & rehab AI · 12 photos
This 2-bedroom, 1-bathroom mobile home in a 55+ community requires moderate repairs and maintenance to improve its condition and value. Key areas for improvement include painting, updating countertops and fixtures, and landscaping. With these updates, the home can be transformed into a move-in-ready property with increased resale and rental value.
Repairs flagged
- Moderate Kitchen countertops — Worn appearance suggests need for replacement or resurfacing.
- Minor Bathroom fixtures — Some may need updating or replacement for a fresh look.
- Minor Bedroom paint — Faded paint in some areas suggests touch-up is needed.
- Minor Exterior paint — Paint appears faded in some areas, suggesting touch-up is needed.
- Minor Landscaping — Overgrown areas and lack of curb appeal features suggest landscaping improvements are needed.
Value-add opportunities
- Both Paint interior walls and trim — Fresh paint can significantly improve the home's appearance and value.
- Both Replace worn-out countertops and fixtures — New countertops and fixtures can enhance the home's functionality and appeal.
- Both Landscaping improvements — A well-maintained and landscaped exterior can greatly increase curb appeal and property value.
- Both Replace worn-out carpet and tile — Fresh flooring can improve the home's overall appearance and functionality.
- Both Replace worn-out windows — New windows can improve energy efficiency and increase the home's curb appeal.
Renovation cost estimate screening
| Repair item | Severity | Est. cost |
|---|---|---|
| Kitchen countertops · Worn appearance suggests need for replacement or resurfacing. | Moderate | $3,000–15,000 |
| Bathroom fixtures · Some may need updating or replacement for a fresh look. | Minor | $500–3,000 |
| Bedroom paint · Faded paint in some areas suggests touch-up is needed. | Minor | $500–3,000 |
| Exterior paint · Paint appears faded in some areas, suggesting touch-up is needed. | Minor | $500–3,000 |
| Landscaping · Overgrown areas and lack of curb appeal features suggest landscaping improvements are needed. | Minor | $500–3,000 |
| Total estimated repair cost · 5 items | $5,000–27,000 |
Value-add ROI direction
- Both Paint interior walls and trim — Fresh paint can significantly improve the home's appearance and value. ↑
- Both Replace worn-out countertops and fixtures — New countertops and fixtures can enhance the home's functionality and appeal. ↑
- Both Landscaping improvements — A well-maintained and landscaped exterior can greatly increase curb appeal and property value. ↑
- Both Replace worn-out carpet and tile — Fresh flooring can improve the home's overall appearance and functionality. ↑
- Both Replace worn-out windows — New windows can improve energy efficiency and increase the home's curb appeal. ↑
ⓘ Cost ranges are severity-bucket heuristics (US national rule-of-thumb). Get contractor quotes + a written scope before underwriting a rehab budget.
Schools (NCES district)
- District
- Glendale Union High School District (4285)
- NCES district ID
- 0403450
- Math proficiency
- 23% ▼ -38.00%
- Reading proficiency
- 31% ▼ -19.00%
- Median HH income
- $40,846
- Composite
- 22.81/100
- National rank
- #8020
- State rank
- #130 of 249 in AZ
Livability — Phoenix
- Score
- 75/100
- State rank
- #16
- US rank
- #3924
Category grades
Schools grade is shown separately in the Schools card above.
Census & demographics
- Census place
- Phoenix, AZ
- County
- Maricopa County · 4,537,380 people
- City population
- 1,500,198
- Metro
- Phoenix-Mesa-Chandler, AZ
- Population (ZIP)
- 34,916
- Household income
- $83,735
- Rent vs Own
- Severe rent burden
- 2104.0
Population outlook (Maricopa County) Hauer SSP2
- Today (2025)
- 4,979,203 people
- By 2030
- 5,378,229 · +8.0%
- By 2040
- 6,156,598 · +23.6%
- By 2050
- 6,872,376 · +38.0%
- By 2075
- 8,401,270 · +68.7%
- By 2100
- 9,247,439 · +85.7%
Race, ethnicity, and origin ACS 2023
- Neighborhood character
- Diverse neighborhood (Simpson 0.57)
- Race & ethnicity
- White 60% Hispanic / Latino 26% Two or more races 12% Native American 5% Black 3% Asian 3%
- Hispanic origin (detail)
- Mexican 23%
- Common ancestry
- Romanian 4% Slovak 2% Portuguese 2%
- Foreign-born
- 13% · Canada, Guatemala, China
- Languages at home
- 79% English-only · Spanish 17% Other Indo-European 1% German/W. Germanic 1%
Political lean MEDSL · Maricopa
- 2024 margin
- Toss-up / Even · D 47.7% · R 51.2% · Other 1.1%
- 2008→2024 swing
- +7.1pp toward D · 2008: -10.6pp · 2024: -3.5pp
- All cycles
- 2024: R+3.5 2020: D+2.2 2016: R+3.5 2012: R+12.0 2008: R+10.6
Not yet ingested
- Civics
- —
Market trends
- HPI YoY
- ▼ -484.20%
- Current HPI
- 305.8855
- Rent YoY
- ▼ -1.77%
- Metro
- Phoenix-Mesa-Chandler, AZ
- State GDP YoY
- ▲ 4.54%
- F500 in state
- 20
Industry mix (Fortune 500 HQ in AZ)
| Industry | F500 HQs | Revenue |
|---|---|---|
| Technology | 2 | $13B |
|
||
| Mining / Metals | 1 | $23B |
|
||
| Environmental Services | 1 | $16B |
|
||
| Metals / Steel | 1 | $14B |
|
||
| Technology Distribution | 1 | $9B |
|
||
| Homebuilding | 1 | $8B |
|
||
Price history
1 event — show timeline
- 2026-05-30 Listed $37,500 ARMLS
Cash-flow waterfall
monthlySold comps — $/sqft
last 12 mo · ≤1 miLoading sold comps…