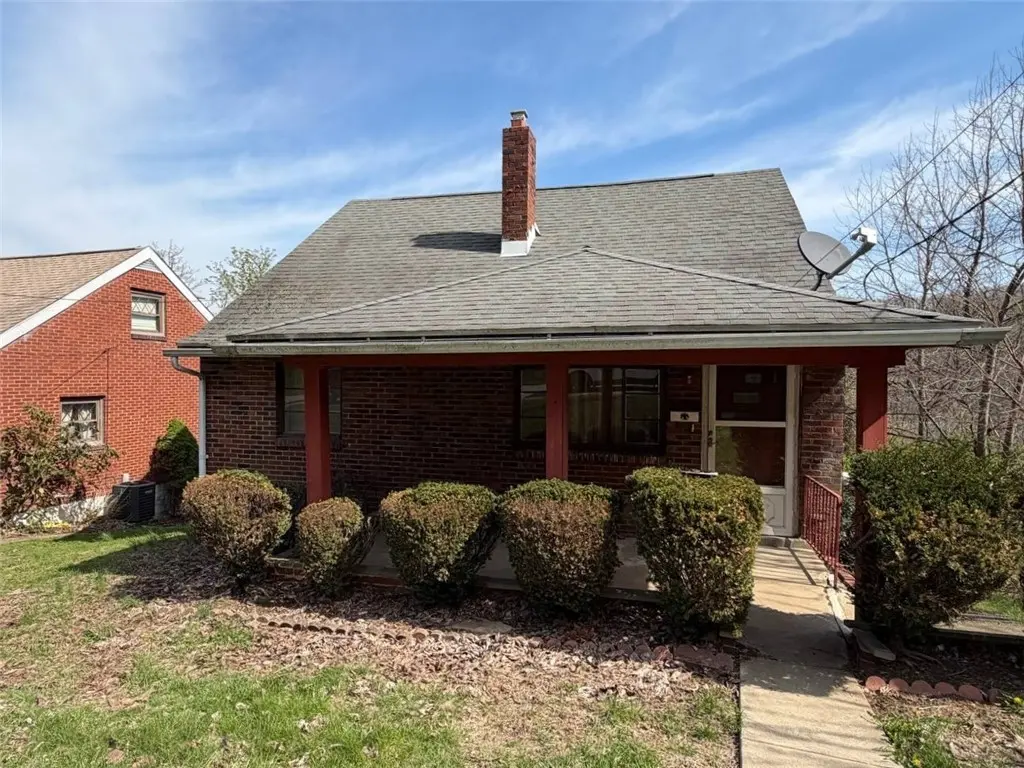
432 Mary St · Jeannette, PA
Flood risk 1/10 · Minimal
- FEMA flood zone
- X (unshaded)
- Chance of flooding over 30 yrs
- 0.0%
- Est. flood insurance / yr
- $507 – $1,088
Fire risk 1/10 · Minimal
- Est. fire insurance / yr
- $511 – $949
Heat risk 3/10 · Minor
- Hot days now (above 95°F)
- 7 days/yr
- Hot days in 30 yrs
- 18 days/yr
Wind risk 2/10 · Minimal
- Chance of severe wind over 30 yrs
- —
Air-quality risk 3/10 · Minor
- Unhealthy air days now
- 2 days/yr
- Unhealthy air days in 30 yrs
- 4 days/yr
Risk factors via First Street. Map © Google.
Why this score? — see what drove the C grade
The composite is a weighted blend of 9 inputs, each scored 0–100. Each bar is that input's sub-score; the figure is the points it added to the 100-point composite (weight × sub-score).
- Cash flow +25.6/30.0
- DSCR +8.5/10.0
- ARV discount +7.5/15.0
- 1% rule +6.8/10.0
- Schools +3.0/10.0
- Livability +3.0/5.0
- Rent growth +2.5/5.0
- Condition / age +2.5/5.0
- Appreciation +0.0/10.0
$99,900
🖨 Deal sheet 📄 Offer letter ✓ Due diligence
Listing remarks
Bring your vision and make this home your own! Located in a quiet residential area, this property offers a great opportunity for buyers looking to customize or renovate to their taste. The home features a functional layout with good-sized living spaces and solid bones, ready for updates and improvements. With a manageable yard and convenient location near local amenities and major routes, this property is ideal for a renovation project or investment opportunity.
Key facts
- Manageable yard
- Functional layout
- Convenient location
Tags
Property features AI
Exterior
- Utilities: Public water
- Home design: Resale property
- Construction: Brick construction; Asphalt roof
- Exterior features: Public water
Interior
- Bathrooms: 1 full bathroom
- Heating & cooling: Gas heating; Central air conditioning
- Interior features: Unfinished walk-out basement
Neighborhood map
What this means for you Summary
Snapshot
- This is a 3-bed/1.0-bath other listed at $100k.
Deal economics
- At list price, monthly cash flow is $235 ($3k/yr) — positive.
- The deal already cash-flows at list — no discount required.
- Meets the 1% rule at list price ($1k rent vs $100k).
- Recommended offer: $98k (1.5% below list) — sets the bar for market timing.
Location & tenants
- Location reads 59/100 on livability (#1,552 in PA) — a working-class tenant base; expect higher turnover. Strengths: cost of living A+, housing A+, schools B; Watch: crime D+, amenities F, commute F.
- Jeannette City SD (suburban): math 25% / reading 47% proficiency, ranked #417 of 539 in PA (top 77%) — families likely to look elsewhere, expect single-tenant / working-renter base with shorter leases.
- Market conditions: 130 active listings in the ZIP; 5 comparable units currently listed for rent nearby; rentals leasing fast (median 2d on market — plan ~1-2 weeks tenant-placement turnaround); 415 units permitted in Westmoreland County in 2024 (10 in 5+ unit buildings).
Forward outlook
- Local home prices are declining (-3.0%/yr); year-one equity from $691 of loan paydown is wiped out by about $3k of value loss. Plan a longer hold.
- Westmoreland County population projected at -19% by 2050 — secular population decline; favor cash flow + early exit over multi-decade hold.
Negotiation context
- It's been on market 21 days — a 2% lower offer ($98k) is reasonable based on typical stale-listing flexibility.
Risks & watch-outs
- Watch-outs: built in 1952 — expect roof / HVAC / electrical / plumbing capex.
Questions for the listing agent
- Built in 1952 — when were the roof, HVAC, electrical panel, plumbing, and water heater last replaced?
- Is there a deadline driving the sale (1031 exchange, divorce, estate, relocation)? That informs how much negotiation room exists.
- Schools are B-rated — typically a magnet for longer-tenancy family renters. What's the average tenant stay here, and is there a school-zone premium baked into asking?
- Crime grade is D in this area — have there been break-ins, vandalism, or insurance claims at this property in the last 3 years? What carrier currently insures it and at what premium?
- What's the average days-on-market for RENTAL listings here right now (not sales)? A rising rental-DOM trend means longer vacancies and softer asking-rent achievability than the comps imply.
- What's the recent tenant-quality profile in this submarket — average credit score on applications, eviction rate, late-payment / NSF rate, and stable-employment percentage? A property-management company in the area should have these aggregated.
- How much new for-sale + rental construction is in the pipeline within 1–3 miles? Heavy new supply typically softens prices + rents 12–24 months out; constrained supply supports both.
Investment metrics
- 1% rule
- 1.18% ✓
- Cap rate
- 9.11%
- Cash-on-cash
- 10.07%
- DSCR
- 1.45
- GRM
- 7.1
CMA / ARV
No comps found within radius.
Projected returns pro-forma
-3.0% appreciation · 3.0% rent growth · sell at horizon
- IRR
- -1.1%
- Equity multiple
- 0.96×
- Total profit
- $-1,213
- Equity at exit
- $14,895
- IRR
- 8.6%
- Equity multiple
- 1.65×
- Total profit
- $18,285
- Equity at exit
- $8,638
Cash invested: $27,972 (down + closing). Projections, not guarantees.
Landlord ↔ Tenant lean methodology
- Overall (STATE)
- 62 Landlord-Friendly
- State Pennsylvania
- 62 Landlord-Friendly · EVEN
- County
- — inherits STATE
- City
- — inherits STATE
ZIP-level market 15644
- Home prices YoY
- -34.7%
- Active inventory
- 130
- Price-to-rent
- 7.1×
Monthly cashflow live
- Estimated rent
- $1,179 high interval (Pro) →
- Mortgage (P&I)
- −$524
- Tax from tax record
- −$131 /mo · $1,569/yr
- Insurance
- −$42
- HOA
- −$0
- Vacancy / Maint / Mgmt
- −$247
- Net cashflow
- $235
Break-even live
UW: 25.0% down · 7.5% · 30yr · 1.5% tax · 5.0% vac · 8.0% maint · 8.0% mgmt
Financing live
Cash to close
- Down payment
- $24,975
- Closing costs
- $2,997
- Reserves months
- —
- Total cash needed
- —
Loan-product check · same deal, 3 products live
Conventional
25% down · 7.5% · 30yr
- Down + closing
- —
- Monthly P&I
- —
- Monthly cashflow
- —
- DSCR
- —
- Eligible?
- —
Personal DTI + credit; lowest rate.
DSCR
20% down · 8.5% · 30yr
- Down + closing
- —
- Monthly P&I
- —
- Monthly cashflow
- —
- DSCR
- —
- Eligible?
- —
No personal income docs; deal must DSCR.
Hard money
10% down · 12.0% · 12mo
- Down + closing
- —
- Monthly P&I
- —
- Monthly cashflow
- —
- DSCR
- —
- Eligible?
- —
Short-term bridge; refi at stabilization.
Rent comps 5 comps
| Address | Beds | Baths | Sqft | Rent | $/sqft | DOM | Units | Dist |
|---|---|---|---|---|---|---|---|---|
| 508 Lowry Ave Jeannette, PA | 2.0 | 1.0 | 1000 | $950 | $0.95 | 44d | 1 | 0.57mi |
| 36 Gaskill Ave Unit 2 Jeannette, PA | 3.0 | 1.0 | 1100 | $950 | $0.86 | 2d | 1 | 0.70mi |
| 104 Baughman Ave Unit 1 Jeannette, PA | 2.0 | 2.0 | 1000 | $1,200 | $1.20 | 19d | 1 | 0.71mi |
| 421 N 3rd St Jeannette, PA | 2.0 | 1.0 | 800 | $900 | $1.12 | 2d | 1 | 0.91mi |
| 211 S 7th St Unit A Jeannette, PA | 3.0 | 1.0 | 900 | $1,450 | $1.61 | 2d | 1 | 0.97mi |
Listing history 2 events
-
2026-05-01status Pending
-
2026-04-10$99,900 Active
ⓘ Source: listings_history table (triggers on properties + properties_extension) + one-shot
backfill from property_details.listing_events for pre-trigger history.
Tax reassessment forecast PA · Partial reset (capped growth)
- Current annual tax
- $1,569 · $131/mo
- Projected year-2 tax
- $1,574 · $131/mo
- Expected delta
- +$5/yr ($0/mo · 0.3%)
ⓘ Screening estimate from a state-policy table — verify with the county assessor before closing.
Climate risk First Street
- Flood 1/10 Low FEMA zone X (unshaded) · 0% chance over 30 yrs
- Wildfire 1/10 Low
- Heat 3/10 Moderate 7 d/yr ≥95°F today · 18 d/yr by 30 yrs out
- Wind 2/10 Low
- Air quality 3/10 Moderate 2 unhealthy d/yr today · 4 by 30 yrs out
Nearby sold comps map
Loading sold comps map…
Walkable amenities ~0.75 mi
Loading nearby amenities…
Taxation est. · year 1
- Rental income
- $14,142
- − Mortgage interest
- −$5,596
- − Property taxes
- −$1,569
- − Insurance
- −$500
- − Repairs & maintenance
- −$1,131
- − Management
- −$1,131
- − Depreciation
- −$2,906
- Taxable income
- $1,309
- Est. tax owed @ 24.0%
- −$314
- After-tax cash flow
- $2,503/yr
For passive investors: Depreciation is non-cash, so a rental often shows a tax loss while cash-flowing — sheltering income. Rental losses are passive: they offset passive income freely, and up to $25,000/yr can offset ordinary (W-2) income if you actively participate and your MAGI is under $100k (phasing out to $0 by $150k); unused losses carry forward. On sale, claimed depreciation is recaptured at up to 25%, and gains may owe capital-gains tax (a 1031 exchange can defer both). Figures are a year-1 estimate at your 24.0% rate — not tax advice; consult a CPA.
Schools (NCES district)
- District
- Jeannette City SD
- NCES district ID
- 4212330
- Math proficiency
- 25% ▼ -8.00%
- Reading proficiency
- 47% ▼ -7.00%
- Median HH income
- $37,400
- Composite
- 29.88/100
- National rank
- #6398
- State rank
- #417 of 539 in PA
Livability — Jeannette
- Score
- 59/100
- State rank
- #1552
- US rank
- #20510
Category grades
Schools grade is shown separately in the Schools card above.
Census & demographics
- Census place
- Jeannette, PA
- County
- Westmoreland County · 183,777 people
- City population
- 18,512
- Metro
- Pittsburgh, PA
- Population (ZIP)
- 18,512
- Household income
- $64,684
- Rent vs Own
- Severe rent burden
- 342.0
Population outlook (Westmoreland County) Hauer SSP2
- Today (2025)
- 342,555 people
- By 2030
- 331,717 · -3.2%
- By 2040
- 304,976 · -11.0%
- By 2050
- 277,444 · -19.0%
- By 2075
- 224,607 · -34.4%
- By 2100
- 171,084 · -50.1%
Race, ethnicity, and origin ACS 2023
- Neighborhood character
- Predominantly White (87%)
- Race & ethnicity
- White 87% Two or more races 6% Black 5% Hispanic / Latino 3%
- Common ancestry
- Romanian 6% Italian 2% Slovak 1%
- Foreign-born
- 2% · Canada, South Korea
- Languages at home
- 97% English-only · Spanish 2%
Political lean MEDSL · Westmoreland
- 2024 margin
- Strong R (+28.4) · D 35.4% · R 63.9%
- 2008→2024 swing
- -11.7pp toward R · 2008: -16.7pp · 2024: -28.4pp
- All cycles
- 2024: R+28.4 2020: R+28.3 2016: R+31.3 2012: R+23.7 2008: R+16.7
Not yet ingested
- Civics
- —
Market trends
- HPI YoY
- ▼ -95.33%
- Current HPI
- 179.5086
- Rent YoY
- —
- Metro
- Pittsburgh, PA
- State GDP YoY
- ▲ 1.68%
- F500 in state
- 34
Industry mix (Fortune 500 HQ in PA)
| Industry | F500 HQs | Revenue |
|---|---|---|
| Healthcare | 2 | $309B |
|
||
| Insurance | 2 | $27B |
|
||
| Telecommunications / Media | 1 | $124B |
|
||
| Industrial Distribution | 1 | $22B |
|
||
| Financial Services | 1 | $20B |
|
||
| Chemicals / Materials | 1 | $18B |
|
||
Price history
2 events — show timeline
- 2026-05-01 Pending — West Penn MLS
- 2026-04-10 Listed $99,900 West Penn MLS
Property tax history
+1.1%/yrLatest (2026): $1,569 · +0.0% YoY. Source: county tax records.
Cash-flow waterfall
monthlySold comps — $/sqft
last 12 mo · ≤1 miLoading sold comps…