 Multi-family
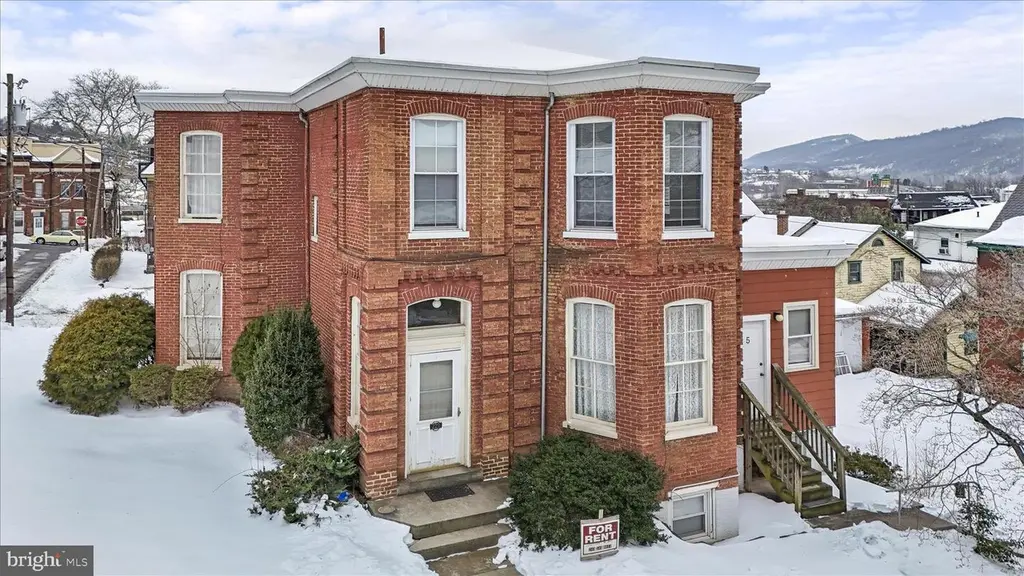
229 E Union St · Cumberland, MD
Flood risk 1/10 · Minimal
- FEMA flood zone
- X (unshaded)
- Chance of flooding over 30 yrs
- 0.0%
- Est. flood insurance / yr
- $473 – $860
Fire risk 3/10 · Minor
- Est. fire insurance / yr
- $755 – $1,403
Heat risk 5/10 · Moderate
- Hot days now (above 101°F)
- 7 days/yr
- Hot days in 30 yrs
- 19 days/yr
Wind risk 2/10 · Minimal
- Chance of severe wind over 30 yrs
- —
Air-quality risk 2/10 · Minimal
- Unhealthy air days now
- 0 days/yr
- Unhealthy air days in 30 yrs
- 1 days/yr
Risk factors via First Street. Map © Google.
Why this score? — see what drove the B grade
The composite is a weighted blend of 9 inputs, each scored 0–100. Each bar is that input's sub-score; the figure is the points it added to the 100-point composite (weight × sub-score).
- Cash flow +30.0/30.0
- 1% rule +10.0/10.0
- DSCR +10.0/10.0
- ARV discount +7.5/15.0
- Rent growth +5.0/5.0
- Livability +3.9/5.0
- Condition / age +2.5/5.0
- Schools +1.9/10.0
- Appreciation +0.0/10.0
$249,000
🖨 Deal sheet (PDF) 📄 Offer letter ✓ Due diligence
Multi-family units
County records classify this as Multi-Family (5+ Unit). Listing-text estimate: 1 unit. estimate disagrees with records
5+ unit building — per-unit beds/baths from public records are typically unavailable; the breakdown below (if shown) is an estimate from the listing text.
Listing remarks MLS
This investment multi-family property features five income-producing units, each with baseboard heat and tenant-paid electric. The landlord currently covers water, sewer, and trash services, and the property also includes a garage. Ideally located in an established residential neighborhood with access to downtown amenities, shopping, and major commuter routes, this asset is attractive to both tenants and investors. 5 Units - (1) 2 bed/1bath, (2) 1 bed/1 bath, (2) efficiency 1 bedroom unit is currently leased at $700/month. currently a month to month lease. Other properties available. Discount for purchase of all 4 properties. 315 Frederick - 9 Units 339/341 Frederick - 5 Units Commercial Lot Front & Baltimore . 08 Acres
Key facts
- Tenant paid electric
- Baseboard heat
- 0.25 acre lot
Tags
Neighborhood map
What this means for you Summary
Snapshot
- This is a 3-bed/6.0-bath multifamily listed at $249k.
Deal economics
- At list price, monthly cash flow is $2k ($23k/yr) — positive.
- The deal already cash-flows at list — no discount required.
- Meets the 1% rule at list price ($4k rent vs $249k).
- Recommended offer: $219k (12.0% below list) — sets the bar for market timing.
- Cap rate 15.6% vs local median 6.7% in Cumberland — top-decile yield for the area; either an underpriced asset or a hidden risk that comps aren't pricing in. Stress-test before assuming the spread holds.
Location & tenants
- Location reads 78/100 on livability (#64 in MD, #2,385 nationally) — a middle-class / working-renter tenant base. Strengths: amenities A+, commute A+, cost of living A+; Watch: schools D+, crime F, employment F.
- Allegany County Public Schools (other): math 15% / reading 30% proficiency, ranked #18 of 24 in MD (top 75%) — low school quality limits family demand, transient renter base, plan for 1-2y turnover.
- Market conditions: Rents rising fast (+10.9%/yr); 235 active listings in the ZIP; 1 comparable units currently listed for rent nearby; 24 units permitted in Allegany County in 2024 (0 in 5+ unit buildings).
- At $4,366/mo this rent would consume 86% of the median local household income ($61k/yr) (locally 824% of renters already pay >50% of income on rent) — very limited rent-growth headroom before tenants either downsize or default.
Forward outlook
- Local home prices are declining (-3.0%/yr); year-one equity from $2k of loan paydown is wiped out by about $7k of value loss. Plan a longer hold.
- Allegany County population projected at -14% by 2050 — secular population decline; favor cash flow + early exit over multi-decade hold.
- At projected returns (-3.0% appreciation + 8.0% rent growth), your $70k cash investment doubles in ~4 years — after that, you're playing with house money.
Negotiation context
- It's been on market 133 days — a 12% lower offer ($219k) is reasonable based on typical stale-listing flexibility.
- 3 sale attempts since 3y ago with the ask held roughly flat each time — persistent listings suggest the price (not the market) is what's stuck; bring a comps-based counter.
- Current owner paid $142k; list at $249k implies a 75% gain — meaningful room to come down on a strong offer.
Risks & watch-outs
- Watch-outs: built in 1910 — expect roof / HVAC / electrical / plumbing capex.
- Climate carrying-cost: extreme-heat days projected 7→19/yr by 2055 (HVAC capex compounding) — expect insurance premiums to compound above CPI over the hold.
Questions for the listing agent
- It's been on market 133 days. Have you received any prior offers? Is the seller open to a 12% concession, seller financing, or rate buy-down credit?
- Built in 1910 — when were the roof, HVAC, electrical panel, plumbing, and water heater last replaced?
- Why hasn't it sold? Are there any deal-killer items the seller is aware of (foundation, flood, title, zoning, code violations)?
- Is there a deadline driving the sale (1031 exchange, divorce, estate, relocation)? That informs how much negotiation room exists.
- Schools are D-rated, which usually means shorter tenancies and higher turnover. Who's the typical renter profile here, and what's been the actual vacancy rate?
- Crime grade is F in this area — have there been break-ins, vandalism, or insurance claims at this property in the last 3 years? What carrier currently insures it and at what premium?
- What's the average days-on-market for RENTAL listings here right now (not sales)? A rising rental-DOM trend means longer vacancies and softer asking-rent achievability than the comps imply.
- What's the recent tenant-quality profile in this submarket — average credit score on applications, eviction rate, late-payment / NSF rate, and stable-employment percentage? A property-management company in the area should have these aggregated.
- How much new apartment / multifamily construction is in the pipeline within 1–3 miles? Heavy new supply (>2% of stock underway) typically softens rents 12–24 months out; light construction supports rent growth.
Investment metrics
- 1% rule
- 1.75% ✓
- Cap rate
- 15.64%
- Cash-on-cash
- 33.39%
- DSCR
- 2.49
- GRM
- 4.8
CMA / ARV
- ARV (median comp)
- $96,989
- List price
- $249,000
- Delta
- 156.73%
- Verdict
- OVERPRICED
- Comps
- 20 within 1.0 mi
Projected returns pro-forma
-3.0% appreciation · 8.0% rent growth · sell at horizon
- IRR
- 33.9%
- Equity multiple
- 2.52×
- Total profit
- $106,219
- Equity at exit
- $37,127
- IRR
- 43.3%
- Equity multiple
- 6.11×
- Total profit
- $356,351
- Equity at exit
- $21,529
Cash invested: $69,720 (down + closing). Projections, not guarantees.
Landlord ↔ Tenant lean methodology
- Overall (STATE)
- 27 Tenant-Leaning
- State Maryland
- 27 Tenant-Leaning · D+14
- County
- — inherits STATE
- City
- — inherits STATE
ZIP-level market 21502
- Home prices YoY
- -17.4%
- Rents YoY
- 10.9%
- Active inventory
- 235
- Price-to-rent
- 21.8×
Monthly cashflow live
- Estimated rent
- $4,366 medium interval (Pro) →
- Mortgage (P&I)
- −$1,306
- Tax from tax record
- −$100 /mo · $1,195/yr
- Insurance
- −$104
- HOA
- −$0
- Vacancy / Maint / Mgmt
- −$917
- Net cashflow
- $1,940
Break-even live
Sensitivity live
| Price | -10% $2,081 | -5% $2,010 | +0% $1,940 | +5% $1,870 | +10% $1,799 |
|---|---|---|---|---|---|
| Rent | -10% $1,595 | -5% $1,768 | +0% $1,940 | +5% $2,112 | +10% $2,285 |
| Rate | -1.0pp $2,065 | -0.5pp $2,003 | base $1,940 | +0.5pp $1,875 | +1.0pp $1,810 |
5-unit breakdown (identical units grouped — click to expand)
| Units | Beds | Baths | Est. rent |
|---|---|---|---|
| 1× unit | 2 | 1 | $951 |
| 4× units | 1 | 1 | $3,416 |
| #2 | 1 | 1 | $854 |
| #3 | 1 | 1 | $854 |
| #4 | 1 | 1 | $854 |
| #5 | 1 | 1 | $854 |
| Total (5 units) | $4,366 | ||
UW: 25.0% down · 7.5% · 30yr · 1.5% tax · 5.0% vac · 8.0% maint · 8.0% mgmt
Financing live
Cash to close
- Down payment
- $62,250
- Closing costs
- $7,470
- Reserves months
- —
- Total cash needed
- —
Loan-product check · same deal, 3 products live
Conventional
25% down · 7.5% · 30yr
- Down + closing
- —
- Monthly P&I
- —
- Monthly cashflow
- —
- DSCR
- —
- Eligible?
- —
Personal DTI + credit; lowest rate.
DSCR
20% down · 8.5% · 30yr
- Down + closing
- —
- Monthly P&I
- —
- Monthly cashflow
- —
- DSCR
- —
- Eligible?
- —
No personal income docs; deal must DSCR.
Hard money
10% down · 12.0% · 12mo
- Down + closing
- —
- Monthly P&I
- —
- Monthly cashflow
- —
- DSCR
- —
- Eligible?
- —
Short-term bridge; refi at stabilization.
Rent comps 1 comps
| Address | Beds | Baths | Sqft | Rent | $/sqft | DOM | Units | Dist |
|---|---|---|---|---|---|---|---|---|
| 109 Grand Ave Unit B Cumberland, MD | 2.0 | 1.0 | 3000 | $800 | $0.27 | 44d | 1 | 1.05mi |
Listing history 23 events
-
2026-06-19days on market $249,000 Active 133 DOM
-
2026-06-18days on market $249,000 Active 132 DOM
-
2026-06-17days on market $249,000 Active 131 DOM
-
2026-06-16days on market $249,000 Active 130 DOM
-
2026-06-15days on market $249,000 Active 129 DOM
-
2026-06-14days on market $249,000 Active 127 DOM
-
2026-06-12days on market $249,000 Active 126 DOM
-
2026-06-09days on market $249,000 Active 123 DOM
-
2026-06-08days on market $249,000 Active 122 DOM
-
2026-06-07days on market $249,000 Active 121 DOM
-
2026-06-02days on market $249,000 Active 116 DOM
-
2026-06-01days on market $249,000 Active 115 DOM
-
2026-05-31days on market $249,000 Active 114 DOM
-
2026-05-30days on market $249,000 Active 113 DOM
-
2026-02-09price $249,000 739-char remark
Show marketing remark (739 chars)
This investment multi-family property features five income-producing units, each with baseboard heat and tenant-paid electric. The landlord currently covers water, sewer, and trash services, and the property also includes a garage. Ideally located in an established residential neighborhood with access to downtown amenities, shopping, and major commuter routes, this asset is attractive to both tenants and investors. 5 Units - (1) 2 bed/1bath, (2) 1 bed/1 bath, (2) efficiency 1 bedroom unit is currently leased at $700/month. currently a month to month lease. Other properties available. Discount for purchase of all 4 properties. 315 Frederick - 9 Units 339/341 Frederick - 5 Units Commercial Lot Front & Baltimore . 08 Acres
-
2026-02-06$249,900 Active 739-char remark
Show marketing remark (739 chars)
This investment multi-family property features five income-producing units, each with baseboard heat and tenant-paid electric. The landlord currently covers water, sewer, and trash services, and the property also includes a garage. Ideally located in an established residential neighborhood with access to downtown amenities, shopping, and major commuter routes, this asset is attractive to both tenants and investors. 5 Units - (1) 2 bed/1bath, (2) 1 bed/1 bath, (2) efficiency 1 bedroom unit is currently leased at $700/month. currently a month to month lease. Other properties available. Discount for purchase of all 4 properties. 315 Frederick - 9 Units 339/341 Frederick - 5 Units Commercial Lot Front & Baltimore . 08 Acres
-
2023-06-02historical
-
2023-05-25historical Active Under Contract
-
2023-04-04status Active
-
2023-03-09historical
-
2023-01-23$299,999 Active
-
1997-04-17soldstatus $142,231
-
1987-04-06soldstatus $25,000
ⓘ Source: listings_history table (triggers on properties + properties_extension) + one-shot
backfill from property_details.listing_events for pre-trigger history.
Tax reassessment forecast MD · Partial reset (capped growth)
- Current annual tax
- $1,195 · $100/mo
- Projected year-2 tax
- $1,955 · $163/mo
- Expected delta
- +$759/yr (+$63/mo · 63.5%)
ⓘ Screening estimate from a state-policy table — verify with the county assessor before closing.
Climate risk First Street
- Flood 1/10 Low FEMA zone X (unshaded) · 0% chance over 30 yrs
- Wildfire 3/10 Moderate
- Heat 5/10 Major 7 d/yr ≥101°F today · 19 d/yr by 30 yrs out
- Wind 2/10 Low
- Air quality 2/10 Low 0 unhealthy d/yr today · 1 by 30 yrs out
Nearby sold comps map
Loading sold comps map…
Walkable amenities ~0.75 mi
Loading nearby amenities…
Taxation est. · year 1
- Rental income
- $52,392
- − Mortgage interest
- −$13,948
- − Property taxes
- −$1,195
- − Insurance
- −$1,245
- − Repairs & maintenance
- −$4,191
- − Management
- −$4,191
- − Depreciation
- −$7,244
- Taxable income
- $20,377
- Est. tax owed @ 24.0%
- −$4,891
- After-tax cash flow
- $18,389/yr
For passive investors: Depreciation is non-cash, so a rental often shows a tax loss while cash-flowing — sheltering income. Rental losses are passive: they offset passive income freely, and up to $25,000/yr can offset ordinary (W-2) income if you actively participate and your MAGI is under $100k (phasing out to $0 by $150k); unused losses carry forward. On sale, claimed depreciation is recaptured at up to 25%, and gains may owe capital-gains tax (a 1031 exchange can defer both). Figures are a year-1 estimate at your 24.0% rate — not tax advice; consult a CPA.
Schools (NCES district)
- District
- Allegany County Public Schools
- NCES district ID
- 2400030
- Math proficiency
- 15% ▼ -26.00%
- Reading proficiency
- 30% ▼ -20.00%
- Median HH income
- $39,760
- Composite
- 18.95/100
- National rank
- #8854
- State rank
- #18 of 24 in MD
Livability — Cumberland
- Score
- 78/100
- State rank
- #64
- US rank
- #2385
Category grades
Schools grade is shown separately in the Schools card above.
Census & demographics
- Census place
- Cumberland, MD
- County
- Allegany County · 41,015 people
- City population
- 41,015
- Metro
- Cumberland, MD-WV
- Population (ZIP)
- 41,015
- Household income
- $60,725
- Rent vs Own
- Severe rent burden
- 824.0
Population outlook (Allegany County) Hauer SSP2
- Today (2025)
- 68,778 people
- By 2030
- 66,766 · -2.9%
- By 2040
- 62,784 · -8.7%
- By 2050
- 59,179 · -14.0%
- By 2075
- 50,732 · -26.2%
- By 2100
- 40,837 · -40.6%
Race, ethnicity, and origin ACS 2023
- Neighborhood character
- Predominantly White (83%)
- Race & ethnicity
- White 83% Black 9% Two or more races 5% Hispanic / Latino 2%
- Common ancestry
- Slovak 3% Romanian 2% Italian 1%
- Foreign-born
- 2% · Canada
- Languages at home
- 96% English-only · Spanish 2%
Political lean MEDSL · Allegany
- 2024 margin
- Solid R (+40.3) · D 28.9% · R 69.2% · Other 2.0%
- 2008→2024 swing
- -14.4pp toward R · 2008: -25.9pp · 2024: -40.3pp
- All cycles
- 2024: R+40.3 2020: R+38.3 2016: R+48.0 2012: R+32.9 2008: R+25.9
Not yet ingested
- Civics
- —
Market trends
- HPI YoY
- ▼ -54.33%
- Current HPI
- 258.6676
- Rent YoY
- ▲ 10.88%
- Metro
- Cumberland, MD-WV
- State GDP YoY
- ▲ 2.97%
- F500 in state
- 12
Industry mix (Fortune 500 HQ in MD)
| Industry | F500 HQs | Revenue |
|---|---|---|
| Aerospace / Defense | 1 | $71B |
|
||
| Utilities | 1 | $25B |
|
||
| Hotels | 1 | $24B |
|
||
| Consumer Goods | 1 | $7B |
|
||
| Real Estate | 1 | $6B |
|
||
| Chemicals | 1 | $2B |
|
||
Price history
+896.0% since first listed9 events — show timeline
- 2026-02-09 Price Changed $249,000 BRIGHT MLS
- 2026-02-06 Listed $249,900 BRIGHT MLS
- 2023-06-02 Listing Removed — BRIGHT MLS
- 2023-05-25 Contingent — BRIGHT MLS
- 2023-04-04 Relisted — BRIGHT MLS
- 2023-03-09 Listing Removed — BRIGHT MLS
- 2023-01-23 Listed $299,999 BRIGHT MLS
- 1997-04-17 Sold (Public Records) $142,231 Public Records
- 1987-04-06 Sold (Public Records) $25,000 Public Records
Property tax history
+5.3%/yrLatest (2025): $1,195 · +9.5% YoY. Source: county tax records.
Cash-flow waterfall
monthlySold comps — $/sqft
last 12 mo · ≤1 miLoading sold comps…