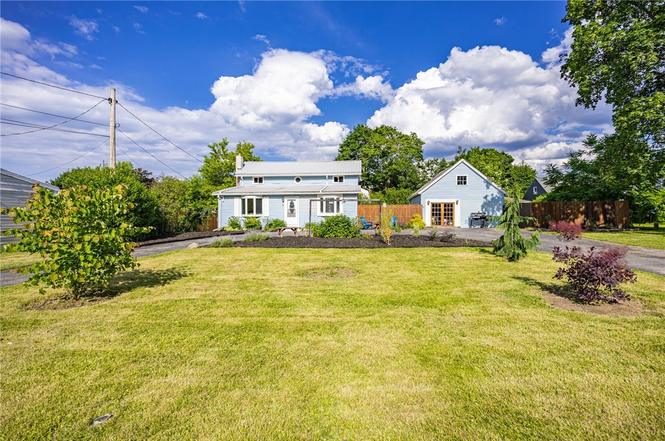
60 Marwood Rd · Rochester, NY
Flood risk 1/10 · Minimal
- FEMA flood zone
- X (unshaded)
- Chance of flooding over 30 yrs
- 0.0%
- Est. flood insurance / yr
- $473 – $860
Fire risk 3/10 · Minor
- Est. fire insurance / yr
- $691 – $1,283
Heat risk 2/10 · Minimal
- Hot days now (above 95°F)
- 7 days/yr
- Hot days in 30 yrs
- 16 days/yr
Wind risk 1/10 · Minimal
- Chance of severe wind over 30 yrs
- —
Air-quality risk 2/10 · Minimal
- Unhealthy air days now
- 1 days/yr
- Unhealthy air days in 30 yrs
- 2 days/yr
Risk factors via First Street. Map © Google.
Why this score? — see what drove the C grade
The composite is a weighted blend of 9 inputs, each scored 0–100. Each bar is that input's sub-score; the figure is the points it added to the 100-point composite (weight × sub-score).
- Cash flow +16.2/30.0
- ARV discount +15.0/15.0
- 1% rule +6.8/10.0
- DSCR +5.0/10.0
- Livability +3.8/5.0
- Schools +3.2/10.0
- Rent growth +2.5/5.0
- Condition / age +2.5/5.0
- Appreciation +0.0/10.0
$149,900
🖨 Deal sheet 📄 Offer letter ✓ Due diligence
Listing remarks
Welcome to this beautifully updated Cape Cod-style home offering 1,408 square feet of comfortable living space with the perfect blend of character, functionality, and modern updates. Situated on a rare double lot, this move-in ready property features 3 bedrooms and 1 full bath, along with a versatile floor plan offering one bedroom on the first floor and two bedrooms upstairs. Step inside to discover new luxury vinyl plank flooring throughout and a bright, inviting living room filled with natural light. The spacious eat-in kitchen serves as the heart of the home, showcasing abundant cabinetry, expansive counter space, stainless steel appliances, and a center island with seating ideal for ev
Key facts
- Double lot
- First-floor laundry
- 7,001 sq ft lot
Tags
Property features AI
Exterior
- Parking: Detached garage with 1.5 spaces; Garage with electricity and EV charging station(s); Circular driveway
- Utilities: High-speed internet available; Public water connected; Sewer available; Electric service with circuit breakers
- Home design: Single-story home; Existing property condition
- Construction: Vinyl siding; Asphalt and metal roof; Block foundation; Built (existing)
- Exterior features: Fully fenced yard; Patio; Near public transit; Rectangular residential lot; City street frontage; Lot dimensions 50 x 140
Interior
- Kitchen: Gas oven; Gas range; Dishwasher; Refrigerator; Eat-in kitchen
- Bedrooms: One main-level bedroom
- Flooring: Luxury vinyl
- Bathrooms: One full bathroom (main level)
- Heating & cooling: Ductless cooling; Ductless heating; Gas heating; Forced air
- Interior features: Separate/formal dining room; Eat-in kitchen; Separate/formal living room; Workshop; Full basement
- Laundry & utility: Washer and dryer on main level; Gas water heater
Neighborhood map
What this means for you Summary
Snapshot
- This is a 3-bed/1.0-bath single-family listed at $150k.
Deal economics
- At list price, monthly cash flow is $80 ($959/yr) — positive.
- The deal already cash-flows at list — no discount required.
- Meets the 1% rule at list price ($2k rent vs $150k).
- Cap rate 6.9% vs local median 9.3% in Rochester — below-typical yield; the buyer is paying a premium for something (appreciation thesis, condition, location) that the cap rate doesn't capture.
Location & tenants
- Location reads 76/100 on livability (#222 in NY, #3,482 nationally) — a middle-class / working-renter tenant base. Strengths: commute A+, cost of living A+, housing A+; Watch: schools D+, crime F, employment F.
- Greece Central School District (suburban): math 35% / reading 39% proficiency, ranked #544 of 590 in NY (top 92%) — families likely to look elsewhere, expect single-tenant / working-renter base with shorter leases.
- Market conditions: 111 active listings in the ZIP; 18 comparable units currently listed for rent nearby; rentals leasing fast (median 3d on market — plan ~1-2 weeks tenant-placement turnaround); 1,169 units permitted in Monroe County in 2024 (591 in 5+ unit buildings).
- This rent runs 32% of the median local income ($66k/yr) — at the standard rent-burdened threshold; future hikes will face affordability resistance.
Forward outlook
- Local home prices are declining (-3.0%/yr); year-one equity from $1k of loan paydown is wiped out by about $4k of value loss. Plan a longer hold.
- Monroe County population projected to shrink 6% by 2050 — rents likely to lag national; underwrite the cash flow, not the appreciation.
Negotiation context
- Only 1 days on market — expect competitive offers; lowballing is unlikely to land.
- 4 sale attempts since 11y ago with the ask held roughly flat each time — persistent listings suggest the price (not the market) is what's stuck; bring a comps-based counter.
- Current owner paid $110k; 36% above their basis — modest negotiation headroom, anchor on the comps not their cost.
Risks & watch-outs
- Watch-outs: property tax is 3.8% of price; built in 1923 — expect roof / HVAC / electrical / plumbing capex.
Questions for the listing agent
- Built in 1923 — when were the roof, HVAC, electrical panel, plumbing, and water heater last replaced?
- Property tax is high relative to price — has the assessment been appealed recently, and will the sale trigger a re-assessment?
- Is there a deadline driving the sale (1031 exchange, divorce, estate, relocation)? That informs how much negotiation room exists.
- Schools are D-rated, which usually means shorter tenancies and higher turnover. Who's the typical renter profile here, and what's been the actual vacancy rate?
- Crime grade is F in this area — have there been break-ins, vandalism, or insurance claims at this property in the last 3 years? What carrier currently insures it and at what premium?
- What's the average days-on-market for RENTAL listings here right now (not sales)? A rising rental-DOM trend means longer vacancies and softer asking-rent achievability than the comps imply.
- What's the recent tenant-quality profile in this submarket — average credit score on applications, eviction rate, late-payment / NSF rate, and stable-employment percentage? A property-management company in the area should have these aggregated.
- How much new for-sale + rental construction is in the pipeline within 1–3 miles? Heavy new supply typically softens prices + rents 12–24 months out; constrained supply supports both.
Investment metrics
- 1% rule
- 1.18% ✓
- Cap rate
- 6.93%
- Cash-on-cash
- 2.29%
- DSCR
- 1.10
- GRM
- 7.1
CMA / ARV
- ARV (on-the-fly)
- $249,216
- Comps found
- 12
Show comp detail 12 sales within ~0.75 mi
| Address | Dist | Beds/Ba | Sqft | Sold | Price | $/sf | Match |
|---|---|---|---|---|---|---|---|
| 95 Ripplewood Dr | 0.18mi | 4/2.0 (+1) | 1,400 (-1%) | 2mo | $290,000 | $207 | 80 |
| 80 Ripplewood Dr | 0.14mi | 3/1.5 | 1,308 (-7%) | 2mo | $269,000 | $206 | 78 |
| 126 Marwood Rd | 0.10mi | 4/2.0 (+1) | 1,299 (-8%) | 2mo | $270,000 | $208 | 72 |
| 122 Clearview Rd | 0.26mi | 3/1.0 | 1,257 (-11%) | 2mo | $151,000 | $120 | 68 |
| 591 Britton Rd | 0.58mi | 3/1.5 | 1,392 (-1%) | 1mo | $225,000 | $162 | 68 |
| 43 Sandalwood Dr | 0.46mi | 4/2.0 (+1) | 1,432 (+2%) | 1mo | $253,000 | $177 | 66 |
| 48 Skycrest Dr | 0.38mi | 3/1.5 | 1,288 (-8%) | 2mo | $265,000 | $206 | 64 |
| 65 Villewood Dr | 0.62mi | 3/1.0 | 1,350 (-4%) | 1mo | $215,000 | $159 | 63 |
| 60 Hilltop Rd | 0.39mi | 3/2.0 | 1,296 (-8%) | 2mo | $281,000 | $217 | 63 |
| 231 Hampton Blvd | 0.37mi | 2/2.5 (-1) | 1,548 (+10%) | 0mo | $260,000 | $168 | 55 |
| 61 Villewood Dr | 0.62mi | 4/1.5 (+1) | 1,612 (+14%) | 2mo | $258,000 | $160 | 38 |
| 43 Britton Rd | 0.70mi | 3/2.0 | 1,200 (-15%) | 3mo | $177,500 | $148 | 36 |
Match score weights: distance 35% · size 25% · config 20% · recency 20%. Top-matched comps best support the ARV.
Projected returns pro-forma
-3.0% appreciation · 3.0% rent growth · sell at horizon
- IRR
- -12.5%
- Equity multiple
- 0.55×
- Total profit
- $-18,997
- Equity at exit
- $22,351
- IRR
- -3.2%
- Equity multiple
- 0.78×
- Total profit
- $-9,170
- Equity at exit
- $12,961
Cash invested: $41,972 (down + closing). Projections, not guarantees.
Landlord ↔ Tenant lean methodology
- Overall (STATE)
- 15 Strongly Tenant-Friendly
- State New York
- 15 Strongly Tenant-Friendly · D+10
- County
- — inherits STATE
- City
- — inherits STATE
ZIP-level market 14616
- Home prices YoY
- -18.0%
- Active inventory
- 111
- Price-to-rent
- 7.1×
Monthly cashflow live
- Estimated rent
- $1,771 high interval (Pro) →
- Mortgage (P&I)
- −$786
- Tax from tax record
- −$471 /mo · $5,650/yr
- Insurance
- −$62
- HOA
- −$0
- Vacancy / Maint / Mgmt
- −$372
- Net cashflow
- $80
Break-even live
UW: 25.0% down · 7.5% · 30yr · 1.5% tax · 5.0% vac · 8.0% maint · 8.0% mgmt
Financing live
Cash to close
- Down payment
- $37,475
- Closing costs
- $4,497
- Reserves months
- —
- Total cash needed
- —
Loan-product check · same deal, 3 products live
Conventional
25% down · 7.5% · 30yr
- Down + closing
- —
- Monthly P&I
- —
- Monthly cashflow
- —
- DSCR
- —
- Eligible?
- —
Personal DTI + credit; lowest rate.
DSCR
20% down · 8.5% · 30yr
- Down + closing
- —
- Monthly P&I
- —
- Monthly cashflow
- —
- DSCR
- —
- Eligible?
- —
No personal income docs; deal must DSCR.
Hard money
10% down · 12.0% · 12mo
- Down + closing
- —
- Monthly P&I
- —
- Monthly cashflow
- —
- DSCR
- —
- Eligible?
- —
Short-term bridge; refi at stabilization.
Rent comps 18 comps
| Address | Beds | Baths | Sqft | Rent | $/sqft | DOM | Units | Dist |
|---|---|---|---|---|---|---|---|---|
| 534-582 Denise Rd Unit 562 Rochester, NY | 2.0 | 1.0 | 1000 | $1,575 | $1.57 | 2d | 1 | 0.13mi |
| 44 Windsor Rd Rochester, NY | 3.0 | 1.0 | 882 | $1,795 | $2.04 | 2d | 1 | 0.14mi |
| 125 Windsor Rd Rochester, NY | 2.0 | 1.0 | 1142 | $1,700 | $1.49 | 2d | 1 | 0.21mi |
| 108 Glenbrook Rd Rochester, NY | 3.0 | 1.0 | 1088 | $1,850 | $1.70 | 23d | 1 | 0.41mi |
| 360 Britton Rd Rochester, NY | 1.0–2.0 | 1.0 | 837 | $1,479 | $1.77 | 2d | 2 | 0.45mi |
| 419 Britton Rd Rochester, NY | 2.0 | 1.5 | 1025 | $1,595 | $1.56 | 2d | 1 | 0.52mi |
| 3677 Lake Ave Rochester, NY | 2.0 | 1.0 | 1088 | $1,200 | $1.10 | 43d | 1 | 0.65mi |
| 304 Bakerdale Rd Rochester, NY | 3.0 | 1.0 | 1256 | $1,650 | $1.31 | 44d | 1 | 0.66mi |
| 4 Valley Brook Cir Greece, NY | 2.0 | 1.5 | 1047 | $2,306 | $2.20 | 2d | 3 | 0.72mi |
| 37 Linda Dr Unit 1 Rochester, NY | 3.0 | 2.0 | 1600 | $2,100 | $1.31 | 43d | 1 | 0.79mi |
| 1255 Latta Rd Greece, NY | 1.0–2.0 | 1.0 | 705 | $1,570 | $2.23 | 2d | 5 | 0.86mi |
| 175 English Rd Rochester, NY | 3.0 | 1.5 | 1194 | $1,975 | $1.65 | 43d | 1 | 0.96mi |
| 704 Rumson Rd Rochester, NY | 3.0 | 1.0 | 1100 | $1,950 | $1.77 | 3d | 1 | 0.96mi |
| 4302 Lake Ave Unit 1 Rochester, NY | 3.0 | 1.5 | 1600 | $3,000 | $1.88 | 43d | 1 | 1.05mi |
| 500 Greenleaf Rd Rochester, NY | 1.0–2.0 | 1.0 | 1176 | $1,650 | $1.40 | 2d | 1 | 1.07mi |
| 123 Spanish Trl Rochester, NY | 1.0–2.0 | 1.0–1.5 | 945 | $1,775 | $1.88 | 2d | 1 | 1.14mi |
| 331 Leonard Rd Rochester, NY | 3.0 | 2.0 | 1157 | $1,850 | $1.60 | 3d | 1 | 1.19mi |
| 130 N Park Dr Rochester, NY | 3.0 | 1.5 | 1120 | $2,000 | $1.79 | 43d | 1 | 1.22mi |
Listing history 2 events
-
2026-06-19remarks 699-char remark
-
2026-06-19$149,900 Active 1 DOM
ⓘ Source: listings_history table (triggers on properties + properties_extension) + one-shot
backfill from property_details.listing_events for pre-trigger history.
Tax reassessment forecast NY · Partial reset (capped growth)
- Current annual tax
- $5,650 · $471/mo
- Projected year-2 tax
- $5,650 · $471/mo
- Expected delta
- $0/yr ($0/mo · 0.0%)
ⓘ Screening estimate from a state-policy table — verify with the county assessor before closing.
Climate risk First Street
- Flood 1/10 Low FEMA zone X (unshaded) · 0% chance over 30 yrs
- Wildfire 3/10 Moderate
- Heat 2/10 Low 7 d/yr ≥95°F today · 16 d/yr by 30 yrs out
- Wind 1/10 Low
- Air quality 2/10 Low 1 unhealthy d/yr today · 2 by 30 yrs out
Nearby sold comps map
Loading sold comps map…
Walkable amenities ~0.75 mi
Loading nearby amenities…
Taxation est. · year 1
- Rental income
- $21,256
- − Mortgage interest
- −$8,397
- − Property taxes
- −$5,650
- − Insurance
- −$750
- − Repairs & maintenance
- −$1,700
- − Management
- −$1,700
- − Depreciation
- −$4,361
- Taxable loss
- −$1,302
- Est. tax savings @ 24.0%
- +$313
- After-tax cash flow
- $1,272/yr
For passive investors: Depreciation is non-cash, so a rental often shows a tax loss while cash-flowing — sheltering income. Rental losses are passive: they offset passive income freely, and up to $25,000/yr can offset ordinary (W-2) income if you actively participate and your MAGI is under $100k (phasing out to $0 by $150k); unused losses carry forward. On sale, claimed depreciation is recaptured at up to 25%, and gains may owe capital-gains tax (a 1031 exchange can defer both). Figures are a year-1 estimate at your 24.0% rate — not tax advice; consult a CPA.
Schools (NCES district)
- District
- Greece Central School District
- NCES district ID
- 3612630
- Math proficiency
- 35% ▼ -14.00%
- Reading proficiency
- 39% ▼ -3.00%
- Median HH income
- $52,718
- Composite
- 32.26/100
- National rank
- #5761
- State rank
- #544 of 590 in NY
Livability — Rochester
- Score
- 76/100
- State rank
- #222
- US rank
- #3482
Category grades
Schools grade is shown separately in the Schools card above.
Census & demographics
- County
- Monroe County · 674,131 people
- City population
- 432,803
- Metro
- Rochester, NY
- Population (ZIP)
- 26,863
- Household income
- $66,499
- Rent vs Own
- Severe rent burden
- 789.0
Population outlook (Monroe County) Hauer SSP2
- Today (2025)
- 759,460 people
- By 2030
- 757,154 · -0.3%
- By 2040
- 740,644 · -2.5%
- By 2050
- 714,443 · -5.9%
- By 2075
- 645,883 · -15.0%
- By 2100
- 547,084 · -28.0%
Race, ethnicity, and origin ACS 2023
- Neighborhood character
- Predominantly White (68%)
- Race & ethnicity
- White 68% Black 13% Hispanic / Latino 12% Two or more races 8% Asian 3%
- Hispanic origin (detail)
- Mexican 1% Puerto Rican 9%
- Common ancestry
- Romanian 6% Lithuanian 2% Iranian 2%
- Foreign-born
- 8% · Canada, Philippines, Jamaica
- Languages at home
- 88% English-only · Spanish 5% Arabic 2% Other Asian/Pacific 2%
Political lean MEDSL · Monroe
- 2024 margin
- D (+19.1) · D 59.5% · R 40.5%
- 2008→2024 swing
- +1.4pp toward D · 2008: 17.7pp · 2024: 19.1pp
- All cycles
- 2024: D+19.1 2020: D+21.0 2016: D+14.1 2012: D+17.4 2008: D+17.7
Not yet ingested
- Civics
- —
Market trends
- HPI YoY
- ▼ -54.14%
- Current HPI
- 246.1703
- Rent YoY
- —
- Metro
- Rochester, NY
- State GDP YoY
- ▲ 2.60%
- F500 in state
- 92
Industry mix (Fortune 500 HQ in NY)
| Industry | F500 HQs | Revenue |
|---|---|---|
| Financial Services | 10 | $950B |
|
||
| Consumer Goods | 9 | $162B |
|
||
| Insurance | 4 | $225B |
|
||
| Telecommunications | 2 | $144B |
|
||
| Pharmaceuticals | 2 | $112B |
|
||
| Media / Entertainment | 2 | $69B |
|
||
Price history
+87.6% since first listed10 events — show timeline
- 2026-06-18 Listed $149,900 UNYREIS
- 2021-07-12 Sold (Public Records) $110,000 Public Records
- 2020-02-15 Listing Removed — UNYREIS
- 2020-01-14 Price Changed $109,900 UNYREIS
- 2020-01-02 Listed $114,900 UNYREIS
- 2020-01-02 Listing Removed — UNYREIS
- 2019-11-21 Price Changed $119,900 UNYREIS
- 2019-11-15 Listed $124,900 UNYREIS
- 2019-08-09 Sold (Public Records) $50,000 Public Records
- 2015-09-23 Listed $79,900 UNYREIS
Property tax history
+6.3%/yrLatest (2025): $5,650 · +2.3% YoY. Source: county tax records.
Cash-flow waterfall
monthlySold comps — $/sqft
last 12 mo · ≤1 miLoading sold comps…