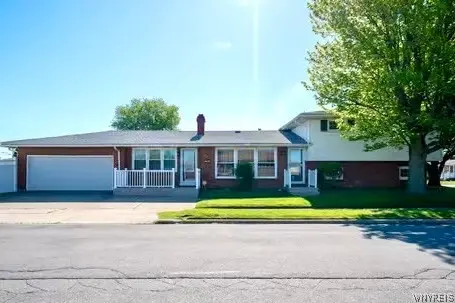
56 Barlow Ave · Lackawanna, NY
Flood risk 1/10 · Minimal
- FEMA flood zone
- X (unshaded)
- Chance of flooding over 30 yrs
- 0.0%
- Est. flood insurance / yr
- $473 – $860
Fire risk 2/10 · Minimal
- Est. fire insurance / yr
- $691 – $1,283
Heat risk 3/10 · Minor
- Hot days now (above 92°F)
- 7 days/yr
- Hot days in 30 yrs
- 16 days/yr
Wind risk 1/10 · Minimal
- Chance of severe wind over 30 yrs
- —
Air-quality risk 4/10 · Minor
- Unhealthy air days now
- 3 days/yr
- Unhealthy air days in 30 yrs
- 8 days/yr
Risk factors via First Street. Map © Google.
Why this score? — see what drove the D grade
The composite is a weighted blend of 9 inputs, each scored 0–100. Each bar is that input's sub-score; the figure is the points it added to the 100-point composite (weight × sub-score).
- Cash flow +15.5/30.0
- ARV discount +9.1/15.0
- DSCR +4.8/10.0
- 1% rule +3.8/10.0
- Livability +3.8/5.0
- Rent growth +2.5/5.0
- Condition / age +2.5/5.0
- Schools +2.0/10.0
- Appreciation +0.0/10.0
$284,900
🖨 Deal sheet (PDF) 📄 Offer letter ✓ Due diligence
Listing remarks
This spectacular home is Back on the Market, and it won’t last long!! This LARGE & Beautiful brick/vinyl home, is situated on corner lot in an awesome neighborhood; it offers curb appeal, impeccable maintenance and features 4 bedrooms and 2.5 bathrooms. Currently not furnished, use ZILLOW to virtually stage in our SHOWCASE listing. Rooms come alive with potential! Inside, the main level boasts a spacious family room with a fireplace and full bath (with possibility to convert to a first floor primary suite), an updated kitchen equipped with Corian counters, a breakfast bar, and tile backsplash, along with a dedicated dining area and a bright living room. Throughout the home, ori
Key facts
- 5,673 sq ft lot
- 2 garage spots
- Built 1964
Neighborhood map
What this means for you Summary
Snapshot
- This is a 3-bed/1.5-bath single-family listed at $285k.
Deal economics
- At list price, monthly cash flow is $117 ($1k/yr) — positive.
- The deal already cash-flows at list — no discount required.
- To meet the 1% rule (rent ≥ 1% of price), the offer needs to be $250k (12.2% below list).
- Recommended offer: $250k (12.2% below list) — sets the bar for 1% rule.
- Cap rate 6.8% vs local median 5.4% in Lackawanna — meaningfully above typical; check what's discounted (condition, days-on-market, listing class) to confirm the premium yield is real.
Location & tenants
- Location reads 75/100 on livability (#254 in NY, #4,026 nationally) — a middle-class / working-renter tenant base. Strengths: commute A+, cost of living A+, housing A+; Watch: crime C-, employment D+, amenities F.
- Lackawanna City School District (suburban): math 19% / reading 29% proficiency, ranked #588 of 590 in NY (top 100%) — low school quality limits family demand, transient renter base, plan for 1-2y turnover; 71% free/reduced lunch — lower-income household profile, screen leases tightly.
- Zoned schools: Martin Road Elementary School (math 12% / reading 29%, grade F, #1,944 of 2,108 statewide, top 92%, 560 students, 86% FRL); Lackawanna Middle School (math 5% / reading 27%, grade F, #702 of 729 statewide, top 96%, 407 students, 80% FRL); Lackawanna High School (math 72%, 560 students, 71% FRL).
- Market conditions: 92 active listings in the ZIP; 1 comparable units currently listed for rent nearby; 1,244 units permitted in Erie County in 2024 (563 in 5+ unit buildings).
Forward outlook
- Local home prices are declining (-3.0%/yr); year-one equity from $2k of loan paydown is wiped out by about $9k of value loss. Plan a longer hold.
Negotiation context
- It's been on market 34 days — a 3% lower offer ($276k) is reasonable based on typical stale-listing flexibility.
- 3 sale attempts with the ask held roughly flat each time — persistent listings suggest the price (not the market) is what's stuck; bring a comps-based counter.
Questions for the listing agent
- It's been on market 34 days. Have you received any prior offers? Is the seller open to a 12% concession, seller financing, or rate buy-down credit?
- Built in 1964 — when were the roof, HVAC, electrical panel, plumbing, and water heater last replaced?
- Is there a deadline driving the sale (1031 exchange, divorce, estate, relocation)? That informs how much negotiation room exists.
- Schools are D-rated, which usually means shorter tenancies and higher turnover. Who's the typical renter profile here, and what's been the actual vacancy rate?
- The area grade is low — what's the realistic commute time and amenity access for the typical tenant pool here? Any planned neighborhood developments (good or bad) we should know about?
- What's the average days-on-market for RENTAL listings here right now (not sales)? A rising rental-DOM trend means longer vacancies and softer asking-rent achievability than the comps imply.
- What's the recent tenant-quality profile in this submarket — average credit score on applications, eviction rate, late-payment / NSF rate, and stable-employment percentage? A property-management company in the area should have these aggregated.
- How much new for-sale + rental construction is in the pipeline within 1–3 miles? Heavy new supply typically softens prices + rents 12–24 months out; constrained supply supports both.
Investment metrics
- 1% rule
- 0.88% ✗
- Cap rate
- 6.78%
- Cash-on-cash
- 1.76%
- DSCR
- 1.08
- GRM
- 9.5
CMA / ARV
- ARV (on-the-fly)
- $295,112
- Comps found
- 7
Show comp detail 7 sales within ~0.75 mi
| Address | Dist | Beds/Ba | Sqft | Sold | Price | $/sf | Match |
|---|---|---|---|---|---|---|---|
| 1517 Abbott Rd | 0.49mi | 4/1.5 (+1) | 2,016 (+1%) | 19mo | $235,000 | $117 | 55 |
| 201 Bernadette | 0.46mi | 3/2.0 | 1,822 (-9%) | 10mo | $270,000 | $148 | 54 |
| 56 Weber Rd | 0.47mi | 3/1.5 | 1,756 (-12%) | 11mo | $292,000 | $166 | 49 |
| 100 Palm St | 0.73mi | 4/2.0 (+1) | 1,890 (-5%) | 4mo | $250,000 | $132 | 47 |
| 392 S Shore Blvd | 0.63mi | 3/1.5 | 1,746 (-12%) | 7mo | $220,000 | $126 | 44 |
| 74 Fieldcrest Ct | 0.65mi | 3/1.5 | 1,738 (-13%) | 11mo | $330,000 | $190 | 39 |
| 52 Kennedy Dr | 0.74mi | 3/2.0 | 1,715 (-14%) | 8mo | $285,000 | $166 | 34 |
Match score weights: distance 35% · size 25% · config 20% · recency 20%. Top-matched comps best support the ARV.
Projected returns pro-forma
-3.0% appreciation · 3.0% rent growth · sell at horizon
- IRR
- -13.5%
- Equity multiple
- 0.51×
- Total profit
- $-38,758
- Equity at exit
- $42,480
- IRR
- -4.6%
- Equity multiple
- 0.70×
- Total profit
- $-24,294
- Equity at exit
- $24,633
Cash invested: $79,772 (down + closing). Projections, not guarantees.
Landlord ↔ Tenant lean methodology
- Overall (STATE)
- 15 Strongly Tenant-Friendly
- State New York
- 15 Strongly Tenant-Friendly · D+10
- County
- — inherits STATE
- City
- — inherits STATE
ZIP-level market 14218
- Home prices YoY
- -9.2%
- Active inventory
- 92
- Price-to-rent
- 9.5×
Monthly cashflow live
- Estimated rent
- $2,500 medium interval (Pro) →
- Mortgage (P&I)
- −$1,494
- Tax from tax record
- −$245 /mo · $2,945/yr
- Insurance
- −$119
- HOA
- −$0
- Vacancy / Maint / Mgmt
- −$525
- Net cashflow
- $117
Break-even live
Sensitivity live
| Price | -10% $278 | -5% $197 | +0% $117 | +5% $36 | +10% $-44 |
|---|---|---|---|---|---|
| Rent | -10% $-81 | -5% $18 | +0% $117 | +5% $216 | +10% $314 |
| Rate | -1.0pp $260 | -0.5pp $189 | base $117 | +0.5pp $43 | +1.0pp $-32 |
UW: 25.0% down · 7.5% · 30yr · 1.5% tax · 5.0% vac · 8.0% maint · 8.0% mgmt
Financing live
Cash to close
- Down payment
- $71,225
- Closing costs
- $8,547
- Reserves months
- —
- Total cash needed
- —
Loan-product check · same deal, 3 products live
Conventional
25% down · 7.5% · 30yr
- Down + closing
- —
- Monthly P&I
- —
- Monthly cashflow
- —
- DSCR
- —
- Eligible?
- —
Personal DTI + credit; lowest rate.
DSCR
20% down · 8.5% · 30yr
- Down + closing
- —
- Monthly P&I
- —
- Monthly cashflow
- —
- DSCR
- —
- Eligible?
- —
No personal income docs; deal must DSCR.
Hard money
10% down · 12.0% · 12mo
- Down + closing
- —
- Monthly P&I
- —
- Monthly cashflow
- —
- DSCR
- —
- Eligible?
- —
Short-term bridge; refi at stabilization.
Rent comps 1 comps
| Address | Beds | Baths | Sqft | Rent | $/sqft | DOM | Units | Dist |
|---|---|---|---|---|---|---|---|---|
| 158 South Dr Buffalo, NY | 2.0 | 2.5 | 1380 | $2,500 | $1.81 | 3d | 1 | 0.65mi |
Listing history 21 events
-
2026-06-21days on market $284,900 Active 34 DOM
-
2026-06-18days on market $284,900 Active 31 DOM
-
2026-06-17days on market $284,900 Active 30 DOM
-
2026-06-16days on market $284,900 Active 29 DOM
-
2026-06-15days on market $284,900 Active 28 DOM
-
2026-06-13remarks 689-char remark
-
2026-06-13days on market $284,900 Active 26 DOM
-
2026-06-10days on market $284,900 Active 23 DOM
-
2026-06-09days on market $284,900 Active 22 DOM
-
2026-06-08days on market $284,900 Active 21 DOM
-
2026-06-07days on market $284,900 Active 20 DOM
-
2026-06-05days on market $284,900 Active 17 DOM
-
2026-06-03pricedays on market $284,900 Active 16 DOM
-
2026-06-02days on market $285,000 Active 15 DOM
-
2026-06-01days on market $285,000 Active 14 DOM
-
2026-05-31days on market $285,000 Active 13 DOM
-
2026-03-17status Pending
-
2026-03-08$285,000 Active
-
2025-11-23status Pending
-
2025-11-13status Active
-
2025-09-20$285,000 Active
ⓘ Source: listings_history table (triggers on properties + properties_extension) + one-shot
backfill from property_details.listing_events for pre-trigger history.
Tax reassessment forecast NY · Partial reset (capped growth)
- Current annual tax
- $2,945 · $245/mo
- Projected year-2 tax
- $3,880 · $323/mo
- Expected delta
- +$935/yr (+$78/mo · 31.7%)
ⓘ Screening estimate from a state-policy table — verify with the county assessor before closing.
Climate risk First Street
- Flood 1/10 Low FEMA zone X (unshaded) · 0% chance over 30 yrs
- Wildfire 2/10 Low
- Heat 3/10 Moderate 7 d/yr ≥92°F today · 16 d/yr by 30 yrs out
- Wind 1/10 Low
- Air quality 4/10 Moderate 3 unhealthy d/yr today · 8 by 30 yrs out
Nearby sold comps map
Loading sold comps map…
Walkable amenities ~0.75 mi
Loading nearby amenities…
Taxation est. · year 1
- Rental income
- $30,000
- − Mortgage interest
- −$15,959
- − Property taxes
- −$2,945
- − Insurance
- −$1,424
- − Repairs & maintenance
- −$2,400
- − Management
- −$2,400
- − Depreciation
- −$8,288
- Taxable loss
- −$3,417
- Est. tax savings @ 24.0%
- +$820
- After-tax cash flow
- $2,222/yr
For passive investors: Depreciation is non-cash, so a rental often shows a tax loss while cash-flowing — sheltering income. Rental losses are passive: they offset passive income freely, and up to $25,000/yr can offset ordinary (W-2) income if you actively participate and your MAGI is under $100k (phasing out to $0 by $150k); unused losses carry forward. On sale, claimed depreciation is recaptured at up to 25%, and gains may owe capital-gains tax (a 1031 exchange can defer both). Figures are a year-1 estimate at your 24.0% rate — not tax advice; consult a CPA.
Schools (NCES district)
- District
- Lackawanna City School District
- NCES district ID
- 3616440
- Math proficiency
- 19% ▼ -10.00%
- Reading proficiency
- 29% ▲ 3.00%
- Median HH income
- $35,041
- Composite
- 19.76/100
- National rank
- #8708
- State rank
- #588 of 590 in NY
Livability — Lackawanna
- Score
- 75/100
- State rank
- #254
- US rank
- #4026
Category grades
Schools grade is shown separately in the Schools card above.
Census & demographics
- Census place
- Lackawanna, NY
- City population
- 20,661
- Population (ZIP)
- 20,661
Population outlook (Erie County) Hauer SSP2
- Today (2025)
- 933,037 people
- By 2030
- 935,181 · +0.2%
- By 2040
- 928,531 · -0.5%
- By 2050
- 905,725 · -2.9%
- By 2075
- 834,037 · -10.6%
- By 2100
- 708,033 · -24.1%
Race, ethnicity, and origin ACS 2023
- Neighborhood character
- Predominantly White (73%)
- Race & ethnicity
- White 73% Black 13% Hispanic / Latino 10% Two or more races 5%
- Hispanic origin (detail)
- Puerto Rican 8%
- Common ancestry
- Romanian 18% Lithuanian 2% Slovak 1%
- Foreign-born
- 7% · Canada
- Languages at home
- 80% English-only · Arabic 11% Spanish 6% Russian/Polish/Slavic 1%
Political lean MEDSL · Erie
- 2024 margin
- Lean D (+9.7) · D 54.8% · R 45.2%
- 2008→2024 swing
- -7.9pp toward R · 2008: 17.5pp · 2024: 9.7pp
- All cycles
- 2024: D+9.7 2020: D+14.7 2016: D+4.8 2012: D+15.6 2008: D+17.5
Not yet ingested
- Civics
- —
Market trends
- HPI YoY
- ▼ -39.44%
- Current HPI
- 389.0188
- Rent YoY
- —
- Metro
- —
- State GDP YoY
- ▲ 2.60%
- F500 in state
- 92
Industry mix (Fortune 500 HQ in NY)
| Industry | F500 HQs | Revenue |
|---|---|---|
| Financial Services | 10 | $950B |
|
||
| Consumer Goods | 9 | $162B |
|
||
| Insurance | 4 | $225B |
|
||
| Telecommunications | 2 | $144B |
|
||
| Pharmaceuticals | 2 | $112B |
|
||
| Media / Entertainment | 2 | $69B |
|
||
Price history
+0.0% since first listed5 events — show timeline
- 2026-03-17 Pending — WNYREIS
- 2026-03-08 Listed $285,000 WNYREIS
- 2025-11-23 Pending — WNYREIS
- 2025-11-13 Relisted — WNYREIS
- 2025-09-20 Listed $285,000 WNYREIS
Property tax history
+4.8%/yrLatest (2025): $2,945 · +116.5% YoY. Source: county tax records.
Cash-flow waterfall
monthlySold comps — $/sqft
last 12 mo · ≤1 miLoading sold comps…