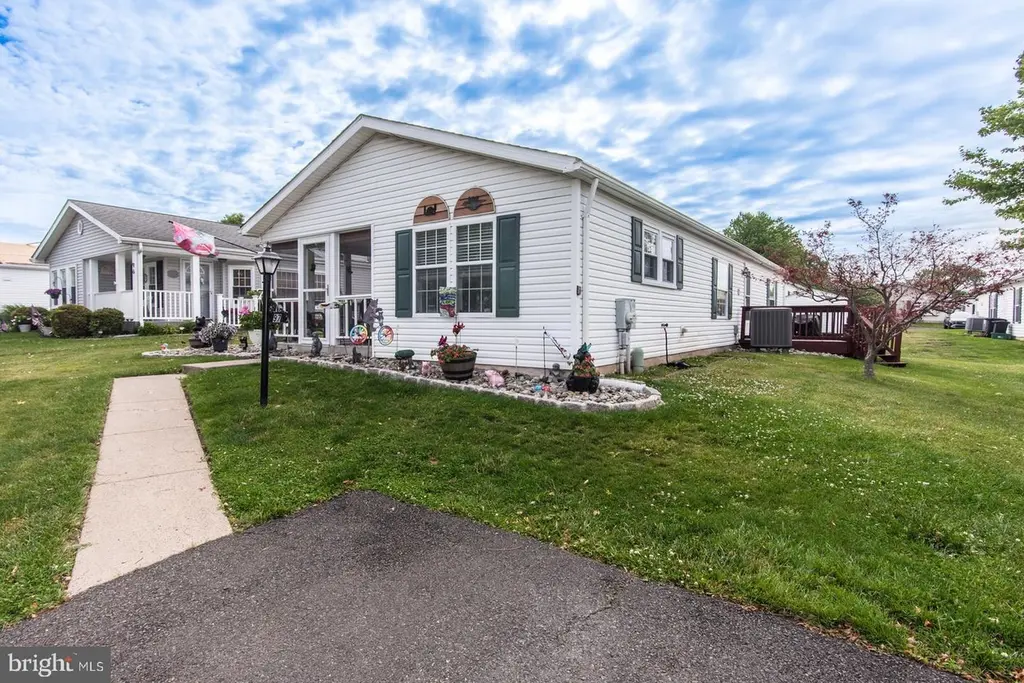
97 Acorn Ct E · Richboro, PA
Flood risk 6/10 · Moderate
- FEMA flood zone
- X (unshaded)
- Chance of flooding over 30 yrs
- 0.73%
- Est. flood insurance / yr
- $507 – $1,088
Fire risk 1/10 · Minimal
- Est. fire insurance / yr
- $511 – $949
Heat risk 5/10 · Moderate
- Hot days now (above 100°F)
- 7 days/yr
- Hot days in 30 yrs
- 15 days/yr
Wind risk 6/10 · Moderate
- Chance of severe wind over 30 yrs
- 27.0%
Air-quality risk 4/10 · Minor
- Unhealthy air days now
- 4 days/yr
- Unhealthy air days in 30 yrs
- 5 days/yr
Risk factors via First Street. Map © Google.
Why this score? — see what drove the D+ grade
The composite is a weighted blend of 9 inputs, each scored 0–100. Each bar is that input's sub-score; the figure is the points it added to the 100-point composite (weight × sub-score).
- Cash flow +17.5/30.0
- ARV discount +7.5/15.0
- Schools +5.8/10.0
- DSCR +5.5/10.0
- 1% rule +3.9/10.0
- Livability +3.8/5.0
- Rent growth +2.5/5.0
- Condition / age +2.5/5.0
- Appreciation +0.0/10.0
$349,000
🖨 Deal sheet 📄 Offer letter ✓ Due diligence
Listing remarks MLS
New flooring going in Wed April 17th. Laminate in LR/DR, hallway and bathrooms. New neutral carpet in the bedrooms. Pictures will be updated once completed. This Warrington model has an open floor plan which is light and airy. Walk into a sunny porch which welcomes you to this bright and sunny home. Newer appliances, refrigerator, dishwasher, stove, micro-wave, washer and dryer were all replaced in 2017 when the owner purchased the home. Whole house water filter system. HVAC is 6 years old. The kitchen has an abundance of cabinets and a sliding door to the porch. Laminated flooring was recently put into the dining room. There is a pellet stove which significantly reduces heating costs in the winter. The kitchen is large and has an abundance of cabinet space and has two skylights. There is a sliding door to the enclosed porch from the kitchen. Full bath in the hallway. Laundry room has door to deck. En-suite main bath has comfort height toilet. There are gutter guards on all gutters. There is a retractable awning over the deck. Close to the clubhouse and the pool and mail boxes. Bus service available. Sewer included in monthly fee.
Key facts
- New appliances
- Community pool
- Built 1992
Tags
Property features AI
Finance
- Other: Ground rent exists and is paid annually; Property manager present
- Financial info: Monthly land lease of $800 (99 years remaining); Annual ground rent applies
- HOA & community: HOA offers clubhouse and outdoor pool; HOA services include management, pool, recreation facility, road maintenance, sewer, snow removal, trash, and common area maintenance; One-time other fee of $100
Exterior
- Parking: Driveway
- Utilities: Community water; Community septic tank
- Home design: Manufactured single-wide home; Located in a 55+ senior community; Land lease ownership; Property in excellent condition
- Construction: Vinyl siding; Shingle roof; Crawl space foundation; Estimated year built
- Exterior features: Enclosed porch; Porches and decks; Screened outdoor living area; Community pool; Shed
Interior
- Kitchen: Dishwasher; Electric range/oven; Refrigerator
- Bedrooms: Two bedrooms on the main level
- Bathrooms: Two full bathrooms (both on the main level)
- Heating & cooling: Heat pump(s) heating; Central air conditioning (electric)
- Interior features: Cathedral ceilings; Sliding glass door; Screened porch
- Laundry & utility: Washer and dryer on the main floor; Electric water heater
Neighborhood map
What this means for you Summary
Snapshot
- This is a 2-bed/2.0-bath manufactured listed at $349k.
Deal economics
- At list price, monthly cash flow is $266 ($3k/yr) — positive.
- The deal already cash-flows at list — no discount required.
- To meet the 1% rule (rent ≥ 1% of price), the offer needs to be $310k (11.0% below list).
- Recommended offer: $310k (11.0% below list) — sets the bar for 1% rule.
- Cap rate 7.2% vs local median 2.7% in Richboro — top-decile yield for the area; either an underpriced asset or a hidden risk that comps aren't pricing in. Stress-test before assuming the spread holds.
Location & tenants
- Location reads 75/100 on livability (#459 in PA, #4,183 nationally) — a middle-class / working-renter tenant base. Strengths: crime A+, employment A+, housing A+; Watch: amenities F, commute F, cost of living F.
- Central Bucks SD (suburban): math 55% / reading 71% proficiency, ranked #37 of 539 in PA (top 7%) — acceptable for families but not a draw, mixed tenant base, ~2y average lease; only 7% free/reduced lunch — higher-income household profile.
- Zoned schools: Buckingham El Sch (math 58% / reading 78%, grade B+, #187 of 1,518 statewide, top 13%, 450 students, 12% FRL).
- Market conditions: 125 active listings in the ZIP; high-income renter base; 663 units permitted in Bucks County in 2024 (106 in 5+ unit buildings).
Forward outlook
- Local home prices are declining (-3.0%/yr); year-one equity from $2k of loan paydown is wiped out by about $10k of value loss. Plan a longer hold.
- Bucks County population projected to shrink 7% by 2050 — rents likely to lag national; underwrite the cash flow, not the appreciation.
Negotiation context
- It's been on market 20 days — a 2% lower offer ($344k) is reasonable based on typical stale-listing flexibility.
- 5 sale attempts since 9y ago with the ask held roughly flat each time — persistent listings suggest the price (not the market) is what's stuck; bring a comps-based counter.
- Current owner paid $220k; list at $349k implies a 59% gain — meaningful room to come down on a strong offer.
Risks & watch-outs
- Climate carrying-cost: major flood risk; major wind risk, 27% chance of damaging wind over 30y; extreme-heat days projected 7→15/yr by 2055 (HVAC capex compounding) — expect insurance premiums to compound above CPI over the hold.
Questions for the listing agent
- Is there a deadline driving the sale (1031 exchange, divorce, estate, relocation)? That informs how much negotiation room exists.
- Schools are A-rated — typically a magnet for longer-tenancy family renters. What's the average tenant stay here, and is there a school-zone premium baked into asking?
- The area grade is low — what's the realistic commute time and amenity access for the typical tenant pool here? Any planned neighborhood developments (good or bad) we should know about?
- What's the average days-on-market for RENTAL listings here right now (not sales)? A rising rental-DOM trend means longer vacancies and softer asking-rent achievability than the comps imply.
- What's the recent tenant-quality profile in this submarket — average credit score on applications, eviction rate, late-payment / NSF rate, and stable-employment percentage? A property-management company in the area should have these aggregated.
- How much new for-sale + rental construction is in the pipeline within 1–3 miles? Heavy new supply typically softens prices + rents 12–24 months out; constrained supply supports both.
Investment metrics
- 1% rule
- 0.89% ✗
- Cap rate
- 7.21%
- Cash-on-cash
- 3.27%
- DSCR
- 1.15
- GRM
- 9.4
CMA / ARV
No comps found within radius.
Projected returns pro-forma
-3.0% appreciation · 3.0% rent growth · sell at horizon
- IRR
- -11.2%
- Equity multiple
- 0.59×
- Total profit
- $-39,692
- Equity at exit
- $52,037
- IRR
- -2.0%
- Equity multiple
- 0.87×
- Total profit
- $-13,106
- Equity at exit
- $30,175
Cash invested: $97,720 (down + closing). Projections, not guarantees.
Landlord ↔ Tenant lean methodology
- Overall (STATE)
- 62 Landlord-Friendly
- State Pennsylvania
- 62 Landlord-Friendly · EVEN
- County
- — inherits STATE
- City
- — inherits STATE
ZIP-level market 18938
- Home prices YoY
- -31.6%
- Active inventory
- 125
- Price-to-rent
- 9.4×
Monthly cashflow live
- Estimated rent
- $3,105 medium interval (Pro) →
- Mortgage (P&I)
- −$1,830
- Tax from tax record
- −$211 /mo · $2,533/yr
- Insurance
- −$145
- HOA
- −$0
- Vacancy / Maint / Mgmt
- −$652
- Net cashflow
- $266
Break-even live
UW: 25.0% down · 7.5% · 30yr · 1.5% tax · 5.0% vac · 8.0% maint · 8.0% mgmt
Financing live
Cash to close
- Down payment
- $87,250
- Closing costs
- $10,470
- Reserves months
- —
- Total cash needed
- —
Loan-product check · same deal, 3 products live
Conventional
25% down · 7.5% · 30yr
- Down + closing
- —
- Monthly P&I
- —
- Monthly cashflow
- —
- DSCR
- —
- Eligible?
- —
Personal DTI + credit; lowest rate.
DSCR
20% down · 8.5% · 30yr
- Down + closing
- —
- Monthly P&I
- —
- Monthly cashflow
- —
- DSCR
- —
- Eligible?
- —
No personal income docs; deal must DSCR.
Hard money
10% down · 12.0% · 12mo
- Down + closing
- —
- Monthly P&I
- —
- Monthly cashflow
- —
- DSCR
- —
- Eligible?
- —
Short-term bridge; refi at stabilization.
Listing history 13 events
-
2026-06-18days on market $349,000 Active 20 DOM
-
2026-06-17days on market $349,000 Active 19 DOM
-
2026-06-16days on market $349,000 Active 18 DOM
-
2026-06-15days on market $349,000 Active 17 DOM
-
2026-06-13days on market $349,000 Active 15 DOM
-
2026-06-09days on market $349,000 Active 11 DOM
-
2026-06-08days on market $349,000 Active 10 DOM
-
2026-06-07days on market $349,000 Active 9 DOM
-
2026-06-04days on market $349,000 Active 6 DOM
-
2026-06-03days on market $349,000 Active 5 DOM
-
2026-06-02days on market $349,000 Active 4 DOM
-
2026-06-01days on market $349,000 Active 3 DOM
-
2026-05-31days on market $349,000 Active 2 DOM
ⓘ Source: listings_history table (triggers on properties + properties_extension) + one-shot
backfill from property_details.listing_events for pre-trigger history.
Tax reassessment forecast PA · Partial reset (capped growth)
- Current annual tax
- $2,533 · $211/mo
- Projected year-2 tax
- $4,024 · $335/mo
- Expected delta
- +$1,490/yr (+$124/mo · 58.8%)
ⓘ Screening estimate from a state-policy table — verify with the county assessor before closing.
Climate risk First Street
- Flood 6/10 Major FEMA zone X (unshaded) · 73% chance over 30 yrs
- Wildfire 1/10 Low
- Heat 5/10 Major 7 d/yr ≥100°F today · 15 d/yr by 30 yrs out
- Wind 6/10 Major 27% chance of damaging wind over 30 yrs
- Air quality 4/10 Moderate 4 unhealthy d/yr today · 5 by 30 yrs out
Nearby sold comps map
Loading sold comps map…
Walkable amenities ~0.75 mi
Loading nearby amenities…
Taxation est. · year 1
- Rental income
- $37,259
- − Mortgage interest
- −$19,549
- − Property taxes
- −$2,533
- − Insurance
- −$1,745
- − Repairs & maintenance
- −$2,981
- − Management
- −$2,981
- − Depreciation
- −$10,153
- Taxable loss
- −$2,683
- Est. tax savings @ 24.0%
- +$644
- After-tax cash flow
- $3,838/yr
For passive investors: Depreciation is non-cash, so a rental often shows a tax loss while cash-flowing — sheltering income. Rental losses are passive: they offset passive income freely, and up to $25,000/yr can offset ordinary (W-2) income if you actively participate and your MAGI is under $100k (phasing out to $0 by $150k); unused losses carry forward. On sale, claimed depreciation is recaptured at up to 25%, and gains may owe capital-gains tax (a 1031 exchange can defer both). Figures are a year-1 estimate at your 24.0% rate — not tax advice; consult a CPA.
Schools (NCES district)
- District
- Central Bucks SD
- NCES district ID
- 4205310
- Math proficiency
- 55% ▼ -12.00%
- Reading proficiency
- 71% ▼ -12.00%
- Median HH income
- $97,513
- Composite
- 58.05/100
- National rank
- #1032
- State rank
- #37 of 539 in PA
Livability — Richboro
- Score
- 75/100
- State rank
- #459
- US rank
- #4183
Category grades
Schools grade is shown separately in the Schools card above.
Census & demographics
- County
- Bucks County · 506,477 people
- City population
- 10,864
- Metro
- Philadelphia-Camden-Wilmington, PA-NJ-DE-MD
- Population (ZIP)
- 13,649
- Household income
- $184,833
- Rent vs Own
- Severe rent burden
- 212.0
Population outlook (Bucks County) Hauer SSP2
- Today (2025)
- 630,973 people
- By 2030
- 627,093 · -0.6%
- By 2040
- 609,680 · -3.4%
- By 2050
- 584,225 · -7.4%
- By 2075
- 539,840 · -14.4%
- By 2100
- 483,970 · -23.3%
Race, ethnicity, and origin ACS 2023
- Neighborhood character
- Predominantly White (85%)
- Race & ethnicity
- White 85% Two or more races 6% Asian 6% Hispanic / Latino 4%
- Common ancestry
- Romanian 8% Italian 4% Scotch-Irish 3%
- Foreign-born
- 10% · Canada, China, Dominican Republic
- Languages at home
- 90% English-only · Other Indo-European 2% Spanish 1% Russian/Polish/Slavic 1%
Political lean MEDSL · Bucks
- 2024 margin
- Toss-up / Even · D 49.5% · R 49.5%
- 2008→2024 swing
- -8.7pp toward R · 2008: 8.7pp · 2024: -0.1pp
- All cycles
- 2024: R+0.1 2020: D+4.4 2016: D+0.6 2012: D+1.2 2008: D+8.7
Not yet ingested
- Civics
- —
Market trends
- HPI YoY
- ▼ -133.64%
- Current HPI
- 289.3189
- Rent YoY
- —
- Metro
- Philadelphia-Camden-Wilmington, PA-NJ-DE-MD
- State GDP YoY
- ▲ 1.68%
- F500 in state
- 34
Industry mix (Fortune 500 HQ in PA)
| Industry | F500 HQs | Revenue |
|---|---|---|
| Healthcare | 2 | $309B |
|
||
| Insurance | 2 | $27B |
|
||
| Telecommunications / Media | 1 | $124B |
|
||
| Industrial Distribution | 1 | $22B |
|
||
| Financial Services | 1 | $20B |
|
||
| Chemicals / Materials | 1 | $18B |
|
||
Price history
+134.2% since first listed14 events — show timeline
- 2026-05-29 Listed $349,000 BRIGHT MLS
- 2026-03-29 Listing Removed — BRIGHT MLS
- 2026-03-23 Price Changed $334,900 BRIGHT MLS
- 2026-02-23 Listed $339,900 BRIGHT MLS
- 2024-07-24 Sold (MLS) $220,000 BRIGHT MLS
- 2024-05-14 Pending — BRIGHT MLS
- 2023-09-10 Listed $245,000 BRIGHT MLS
- 2023-08-21 Coming Soon $245,000 BRIGHT MLS
- 2017-12-15 Sold (MLS) $149,000 TREND
- 2017-12-15 Sold (MLS) $149,000 BRIGHT MLS
- 2017-10-27 Pending — TREND
- 2017-09-26 Price Changed $149,000 TREND
- 2017-07-07 Listed $159,000 TREND
- 2017-07-07 Listed $149,000 BRIGHT MLS
Property tax history
+1.3%/yrLatest (2026): $2,533 · +6.1% YoY. Source: county tax records.
Cash-flow waterfall
monthlySold comps — $/sqft
last 12 mo · ≤1 miLoading sold comps…