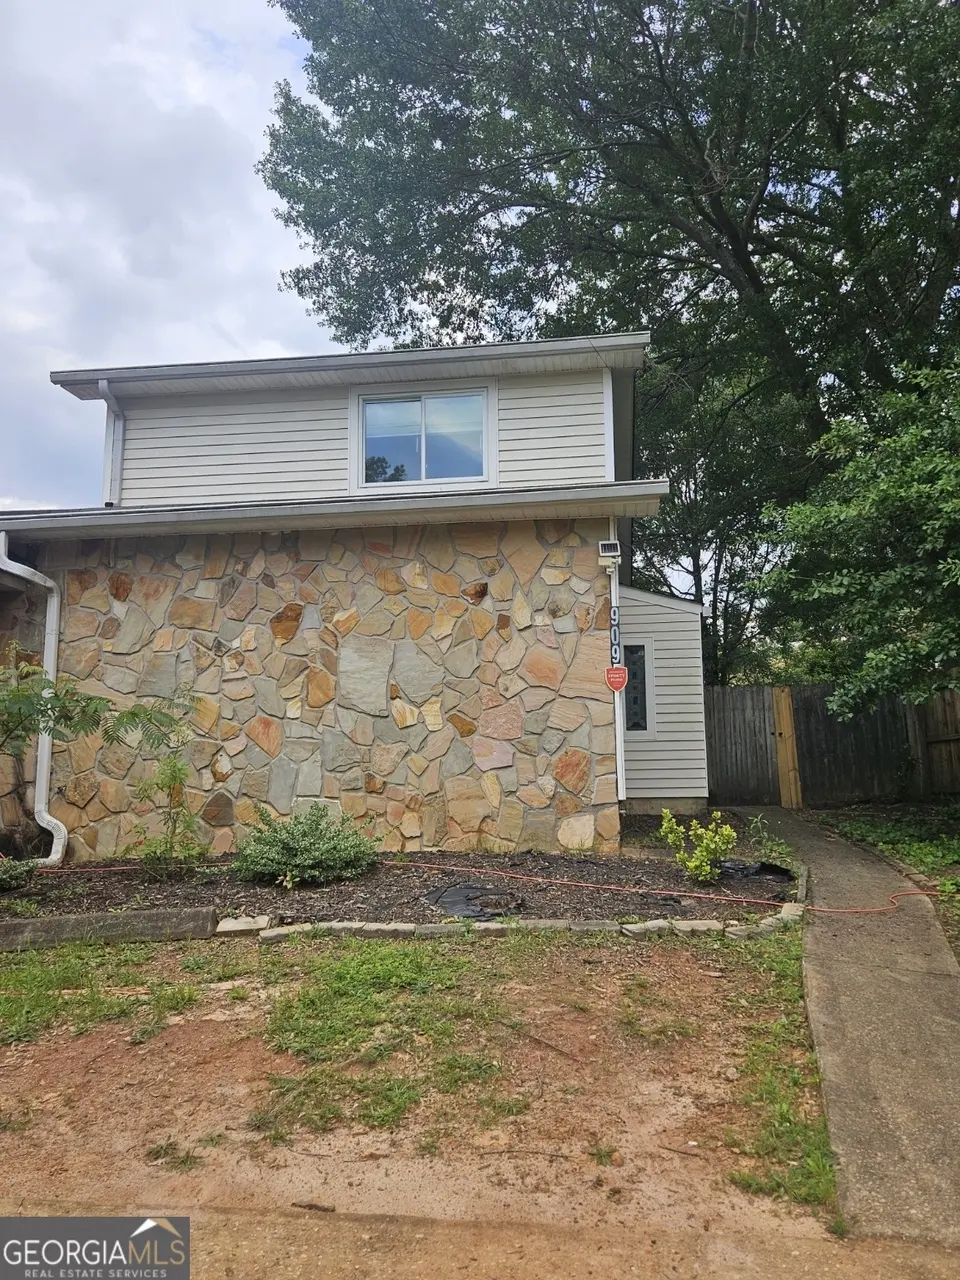
909 Ohara Dr · Jonesboro, GA
Flood risk 1/10 · Minimal
- FEMA flood zone
- X (unshaded)
- Chance of flooding over 30 yrs
- 0.0%
- Est. flood insurance / yr
- $507 – $1,088
Fire risk 1/10 · Minimal
- Est. fire insurance / yr
- $963 – $1,789
Heat risk 6/10 · Moderate
- Hot days now (above 105°F)
- 7 days/yr
- Hot days in 30 yrs
- 18 days/yr
Wind risk 5/10 · Moderate
- Chance of severe wind over 30 yrs
- 26.0%
Air-quality risk 4/10 · Minor
- Unhealthy air days now
- 4 days/yr
- Unhealthy air days in 30 yrs
- 6 days/yr
Risk factors via First Street. Map © Google.
Why this score? — see what drove the B grade
The composite is a weighted blend of 9 inputs, each scored 0–100. Each bar is that input's sub-score; the figure is the points it added to the 100-point composite (weight × sub-score).
- Cash flow +28.7/30.0
- ARV discount +15.0/15.0
- DSCR +10.0/10.0
- 1% rule +7.8/10.0
- Livability +3.6/5.0
- Rent growth +3.0/5.0
- Condition / age +2.5/5.0
- Schools +1.3/10.0
- Appreciation +0.0/10.0
$120,999
🖨 Deal sheet 📄 Offer letter ✓ Due diligence
Listing remarks MLS
This very roomy townhome is just perfect with a fenced private backyard. The primary bedroom is extra large with a walk-in closet and on a lever by itself. You have a 2-story family room with a fireplace and a picture window open to the kitchen. This property is close to shopping, school, bus line, airport, and expressway for easy movement throughout metro Atlanta.
Key facts
- 2-story family room
- Walk-in closet
- Picture window
Tags
Property features AI
Finance
- Other: Home warranty included
- HOA & community: No association; Community features: street lights, near public transport, walkable to schools, near shopping
Exterior
- Parking: Parking pad; More than one parking space per unit; Parking at kitchen level
- Utilities: Public water; Public sewer; 220 volt electric; Cable available; High speed internet available; Natural gas available
- Home design: Residential townhouse; Garden/Patio home / House; Resale property; Built in 1985
- Construction: Press board and stone exterior; Slate roof; Slab foundation
- Exterior features: Patio; Level, private lot
Interior
- Kitchen: Dishwasher; Refrigerator; Gas water heater
- Bedrooms: 2 bedrooms (1 on main level)
- Flooring: Hardwood; Laminate
- Bathrooms: 2 full bathrooms (1 on main level)
- Heating & cooling: Central heating (natural gas); Central air; Ceiling fans; Electric cooling
- Interior features: Two levels; Family room; Laundry area in kitchen; Masonry fireplace in family room; Public-record living area of 1098 square feet
- Laundry & utility: Laundry located in kitchen
Neighborhood map
What this means for you Summary
Snapshot
- This is a 2-bed/2.0-bath single-family listed at $121k.
Deal economics
- At list price, monthly cash flow is $402 ($5k/yr) — positive.
- The deal already cash-flows at list — no discount required.
- Meets the 1% rule at list price ($2k rent vs $121k).
- Cap rate 10.3% vs local median 5.0% in Jonesboro — top-decile yield for the area; either an underpriced asset or a hidden risk that comps aren't pricing in. Stress-test before assuming the spread holds.
Location & tenants
- Location reads 72/100 on livability (#63 in GA) — a middle-class / working-renter tenant base. Strengths: cost of living A+, housing A-; Watch: crime C-, employment D, schools F.
- Clayton County (suburban): math 11% / reading 20% proficiency, ranked #155 of 174 in GA (top 89%) — low school quality limits family demand, transient renter base, plan for 1-2y turnover; 78% free/reduced lunch — lower-income household profile, screen leases tightly.
- Market conditions: Rents rising (+2.1%/yr); 265 active listings in the ZIP; 38 comparable units currently listed for rent nearby; rentals at typical pace (median 24d on market — plan ~3-4 weeks tenant-placement turnaround); 45% of comp listings sitting > 30 days — soft ceiling on asking rent; 865 units permitted in Clayton County in 2024 (448 in 5+ unit buildings).
Forward outlook
- Local home prices are declining (-3.0%/yr); year-one equity from $836 of loan paydown is wiped out by about $4k of value loss. Plan a longer hold.
- Clayton County population projected at +29% by 2050 — long-run rental-demand tailwind backs the buy-and-hold thesis.
- At projected returns (-3.0% appreciation + 2.1% rent growth), your $34k cash investment doubles in ~9 years — after that, you're playing with house money.
Negotiation context
- Only 14 days on market — expect competitive offers; lowballing is unlikely to land.
- 10 sale attempts since 10y ago with the ask held roughly flat each time — persistent listings suggest the price (not the market) is what's stuck; bring a comps-based counter.
- Current owner paid $105k; 15% above their basis — modest negotiation headroom, anchor on the comps not their cost.
Risks & watch-outs
- Climate carrying-cost: moderate wind risk, 26% chance of damaging wind over 30y; extreme-heat days projected 7→18/yr by 2055 (HVAC capex compounding) — expect insurance premiums to compound above CPI over the hold.
Questions for the listing agent
- Is there a deadline driving the sale (1031 exchange, divorce, estate, relocation)? That informs how much negotiation room exists.
- Schools are F-rated, which usually means shorter tenancies and higher turnover. Who's the typical renter profile here, and what's been the actual vacancy rate?
- What's the average days-on-market for RENTAL listings here right now (not sales)? A rising rental-DOM trend means longer vacancies and softer asking-rent achievability than the comps imply.
- What's the recent tenant-quality profile in this submarket — average credit score on applications, eviction rate, late-payment / NSF rate, and stable-employment percentage? A property-management company in the area should have these aggregated.
- How much new for-sale + rental construction is in the pipeline within 1–3 miles? Heavy new supply typically softens prices + rents 12–24 months out; constrained supply supports both.
Investment metrics
- 1% rule
- 1.28% ✓
- Cap rate
- 10.28%
- Cash-on-cash
- 14.24%
- DSCR
- 1.63
- GRM
- 6.5
CMA / ARV
- ARV (on-the-fly)
- $163,602
- Comps found
- 10
Show comp detail 10 sales within ~0.75 mi
| Address | Dist | Beds/Ba | Sqft | Sold | Price | $/sf | Match |
|---|---|---|---|---|---|---|---|
| 7585 Haley Dr | 0.43mi | 3/1.5 (+1) | 1,050 (-4%) | 2mo | $110,000 | $105 | 64 |
| 1105 Lakeshore Dr | 0.40mi | 3/1.0 (+1) | 1,003 (-9%) | 1mo | $95,000 | $95 | 57 |
| 961 Dixie Dr | 0.53mi | 3/2.0 (+1) | 1,196 (+9%) | 1mo | $152,500 | $128 | 54 |
| 7577 Haley Dr | 0.44mi | 3/2.0 (+1) | 975 (-11%) | 12mo | $145,000 | $149 | 46 |
| 1140 Highway 138 SW | 0.48mi | 3/2.0 (+1) | 1,260 (+15%) | 5mo | $138,000 | $110 | 44 |
| 260 Wayne Ave | 0.67mi | 3/2.0 (+1) | 1,040 (-5%) | 14mo | $200,000 | $192 | 43 |
| 114 Raymond St | 0.68mi | 3/1.0 (+1) | 1,040 (-5%) | 9mo | $169,000 | $163 | 43 |
| 251 Wayne Ave | 0.65mi | 3/1.0 (+1) | 1,066 (-3%) | 18mo | $157,599 | $148 | 41 |
| 246 Wayne Ave | 0.69mi | 3/1.0 (+1) | 1,012 (-8%) | 9mo | $177,900 | $176 | 38 |
| 139 Cecelia Cir | 0.69mi | 3/1.5 (+1) | 975 (-11%) | 6mo | $165,000 | $169 | 37 |
Match score weights: distance 35% · size 25% · config 20% · recency 20%. Top-matched comps best support the ARV.
Projected returns pro-forma
-3.0% appreciation · 2.15% rent growth · sell at horizon
- IRR
- 3.6%
- Equity multiple
- 1.14×
- Total profit
- $4,695
- Equity at exit
- $18,041
- IRR
- 12.3%
- Equity multiple
- 1.94×
- Total profit
- $31,818
- Equity at exit
- $10,462
Cash invested: $33,880 (down + closing). Projections, not guarantees.
Landlord ↔ Tenant lean methodology
- Overall (STATE)
- 90 Strongly Landlord-Friendly
- State Georgia
- 90 Strongly Landlord-Friendly · R+3
- County
- — inherits STATE
- City
- — inherits STATE
ZIP-level market 30236
- Rents YoY
- 2.1%
- Active inventory
- 265
- Price-to-rent
- 6.5×
Monthly cashflow live
- Estimated rent
- $1,546 high interval (Pro) →
- Mortgage (P&I)
- −$635
- Tax from tax record
- −$134 /mo · $1,613/yr
- Insurance
- −$50
- HOA
- −$0
- Vacancy / Maint / Mgmt
- −$325
- Net cashflow
- $402
Break-even live
UW: 25.0% down · 7.5% · 30yr · 1.5% tax · 5.0% vac · 8.0% maint · 8.0% mgmt
Financing live
Cash to close
- Down payment
- $30,250
- Closing costs
- $3,630
- Reserves months
- —
- Total cash needed
- —
Loan-product check · same deal, 3 products live
Conventional
25% down · 7.5% · 30yr
- Down + closing
- —
- Monthly P&I
- —
- Monthly cashflow
- —
- DSCR
- —
- Eligible?
- —
Personal DTI + credit; lowest rate.
DSCR
20% down · 8.5% · 30yr
- Down + closing
- —
- Monthly P&I
- —
- Monthly cashflow
- —
- DSCR
- —
- Eligible?
- —
No personal income docs; deal must DSCR.
Hard money
10% down · 12.0% · 12mo
- Down + closing
- —
- Monthly P&I
- —
- Monthly cashflow
- —
- DSCR
- —
- Eligible?
- —
Short-term bridge; refi at stabilization.
Rent comps 38 comps
| Address | Beds | Baths | Sqft | Rent | $/sqft | DOM | Units | Dist |
|---|---|---|---|---|---|---|---|---|
| 933 Ohara Dr Jonesboro, GA | 2.0 | 2.0 | 1464 | $2,700 | $1.84 | 43d | 1 | 0.04mi |
| 858 Ohara Dr Jonesboro, GA | 2.0 | 2.0 | 1001 | $1,500 | $1.50 | 43d | 1 | 0.05mi |
| 7545 Tara Rd Jonesboro, GA | 1.0–3.0 | 1.0–2.0 | 1032 | $1,366 | $1.32 | 1d | 20 | 0.11mi |
| 7620 Tara Rd Jonesboro, GA | 2.0 | 1.5 | 1200 | $1,250 | $1.04 | 24d | 1 | 0.14mi |
| 7878 N Main St Jonesboro, GA | 2.0 | 1.0 | 950 | $962 | $1.01 | 1d | 5 | 0.28mi |
| 1150 Highway 138 Jonesboro, GA | 2.0 | 1.0 | 741 | $1,150 | $1.55 | 24d | 1 | 0.53mi |
| 976 5th Ave Jonesboro, GA | 3.0 | 2.0 | 1496 | $2,000 | $1.34 | 5d | 1 | 0.60mi |
| 249 Wayne Ave Jonesboro, GA | 3.0 | 1.0 | 1117 | $1,395 | $1.25 | 43d | 1 | 0.69mi |
| 100 Chaselake Dr Jonesboro, GA | 1.0–3.0 | 1.0–2.0 | 1160 | $1,311 | $1.13 | 1d | 23 | 0.75mi |
| 1174 Battlecreek Rd Jonesboro, GA | 2.0–3.0 | 2.5 | 1270 | $1,730 | $1.36 | 2d | 5 | 0.81mi |
| 7259 Mayfair Cir Jonesboro, GA | 3.0 | 1.0 | 1014 | $1,590 | $1.57 | 2d | 1 | 0.82mi |
| 537 Fielding Cir Riverdale, GA | 3.0 | 1.0 | 1025 | $1,465 | $1.43 | 24d | 1 | 0.85mi |
| 707 Battlecreek Rd Jonesboro, GA | 3.0 | 1.5 | 1075 | $1,625 | $1.51 | 43d | 1 | 0.86mi |
| 1 Magnolia Cir Jonesboro, GA | 1.0–3.0 | 1.0–2.0 | 925 | $1,316 | $1.42 | 1d | 15 | 0.90mi |
| 7830 N McDonough St Unit A4 Jonesboro, GA | 2.0 | 1.0 | 1000 | $1,550 | $1.55 | 43d | 1 | 0.91mi |
| 7830 N McDonough St Jonesboro, GA | 2.0 | 1.0 | 1000 | $1,350 | $1.35 | 43d | 1 | 0.91mi |
| 112 Burkshire Ct Unit A Jonesboro, GA | 2.0 | 1.0 | 877 | $1,095 | $1.25 | 43d | 1 | 0.97mi |
| 790 Dixon Rd Jonesboro, GA | 2.0 | 1.0–1.5 | 900 | $1,274 | $1.42 | 5d | 5 | 1.02mi |
| 232 N Lake Dr Jonesboro, GA | 3.0 | 1.5 | 1133 | $1,595 | $1.41 | 1d | 1 | 1.04mi |
| 109 North Ave Jonesboro, GA | 1.0–2.0 | 1.0 | 881 | $1,495 | $1.70 | 1d | 3 | 1.10mi |
| 407 Fayetteville Rd Jonesboro, GA | 2.0 | 1.0 | 896 | $1,375 | $1.53 | 24d | 1 | 1.12mi |
| 407 Fayetteville Rd Unit B Jonesboro, GA | 2.0 | 1.0 | 780 | $1,150 | $1.47 | 43d | 1 | 1.12mi |
| 100 Riverview Pl Jonesboro, GA | 1.0–3.0 | 1.0–2.0 | 1153 | $1,524 | $1.32 | 1d | 18 | 1.16mi |
| 8141 Hynds Springs Ln Jonesboro, GA | 3.0 | 2.0 | 1360 | $1,715 | $1.26 | 43d | 1 | 1.16mi |
| 808 S Nottingham Rd Jonesboro, GA | 3.0 | 1.5 | 1107 | $1,400 | $1.26 | 18d | 1 | 1.17mi |
| 808 S Nottingham Rd Jonesboro, GA | 3.0 | 1.5 | 1107 | $1,400 | $1.26 | 43d | 1 | 1.17mi |
| 754 S Nottingham Rd Jonesboro, GA | 3.0 | 1.0 | 1144 | $1,500 | $1.31 | 43d | 1 | 1.20mi |
| 218 Wallis St Jonesboro, GA | 3.0 | 2.0 | 1464 | $1,545 | $1.06 | 24d | 1 | 1.20mi |
| 7800 Park Ln Jonesboro, GA | 3.0 | 1.5 | 1036 | $1,723 | $1.66 | 43d | 1 | 1.25mi |
| 7767 Park Ln Jonesboro, GA | 3.0 | 1.5 | 1065 | $1,660 | $1.56 | 43d | 1 | 1.28mi |
| 7799 Park Ln Jonesboro, GA | 3.0 | 1.5 | 1112 | $1,500 | $1.35 | 4d | 1 | 1.28mi |
| 661 Sherwood Dr Jonesboro, GA | 2.0–3.0 | 1.0–2.0 | 1184 | $1,295 | $1.09 | 43d | 1 | 1.34mi |
| 394 Queen Aliese Ln Jonesboro, GA | 3.0 | 1.0 | 1350 | $1,550 | $1.15 | 43d | 1 | 1.39mi |
| 260 Commons Dr Jonesboro, GA | 3.0 | 2.5 | 1410 | $1,750 | $1.24 | 2d | 1 | 1.39mi |
| 7238 Alicias Way Morrow, GA | 3.0 | 2.5 | 1347 | $1,900 | $1.41 | 43d | 1 | 1.39mi |
| 7232 April Ct Morrow, GA | 3.0 | 2.5 | 1402 | $1,700 | $1.21 | 3d | 1 | 1.45mi |
| 164 Meadowlark Ln Jonesboro, GA | 3.0 | 1.5 | 1056 | $1,665 | $1.58 | 1d | 1 | 1.47mi |
| 7202 Georges Way Morrow, GA | 3.0 | 2.5 | 1402 | $2,000 | $1.43 | 43d | 1 | 1.47mi |
Listing history 10 events
-
2026-06-18days on market $120,999 Active 14 DOM
-
2026-06-17days on market $120,999 Active 13 DOM
-
2026-06-16days on market $120,999 Active 12 DOM
-
2026-06-15days on market $120,999 Active 11 DOM
-
2026-06-13days on market $120,999 Active 9 DOM
-
2026-06-09days on market $120,999 Active 5 DOM
-
2026-06-08days on market $120,999 Active 4 DOM
-
2026-06-07pricestatusdays on market $120,999 Active 3 DOM
-
2026-06-04remarks 367-char remark
-
2026-06-04$121,000 New 1 DOM
ⓘ Source: listings_history table (triggers on properties + properties_extension) + one-shot
backfill from property_details.listing_events for pre-trigger history.
Tax reassessment forecast GA · Resets to sale price
- Current annual tax
- $1,613 · $134/mo
- Projected year-2 tax
- $1,613 · $134/mo
- Expected delta
- $0/yr ($0/mo · 0.0%)
ⓘ Screening estimate from a state-policy table — verify with the county assessor before closing.
Climate risk First Street
- Flood 1/10 Low FEMA zone X (unshaded) · 0% chance over 30 yrs
- Wildfire 1/10 Low
- Heat 6/10 Major 7 d/yr ≥105°F today · 18 d/yr by 30 yrs out
- Wind 5/10 Major 26% chance of damaging wind over 30 yrs
- Air quality 4/10 Moderate 4 unhealthy d/yr today · 6 by 30 yrs out
Nearby sold comps map
Loading sold comps map…
Walkable amenities ~0.75 mi
Loading nearby amenities…
Taxation est. · year 1
- Rental income
- $18,552
- − Mortgage interest
- −$6,778
- − Property taxes
- −$1,613
- − Insurance
- −$605
- − Repairs & maintenance
- −$1,484
- − Management
- −$1,484
- − Depreciation
- −$3,520
- Taxable income
- $3,068
- Est. tax owed @ 24.0%
- −$736
- After-tax cash flow
- $4,087/yr
For passive investors: Depreciation is non-cash, so a rental often shows a tax loss while cash-flowing — sheltering income. Rental losses are passive: they offset passive income freely, and up to $25,000/yr can offset ordinary (W-2) income if you actively participate and your MAGI is under $100k (phasing out to $0 by $150k); unused losses carry forward. On sale, claimed depreciation is recaptured at up to 25%, and gains may owe capital-gains tax (a 1031 exchange can defer both). Figures are a year-1 estimate at your 24.0% rate — not tax advice; consult a CPA.
Schools (NCES district)
- District
- Clayton County
- NCES district ID
- 1301230
- Math proficiency
- 11% ▼ -13.00%
- Reading proficiency
- 20% ▼ -9.00%
- Median HH income
- $42,266
- Composite
- 13.41/100
- National rank
- #9527
- State rank
- #155 of 174 in GA
Livability — Jonesboro
- Score
- 72/100
- State rank
- #63
- US rank
- #6030
Category grades
Schools grade is shown separately in the Schools card above.
Census & demographics
- County
- Clayton County · 230,153 people
- City population
- 93,280
- Metro
- Atlanta-Sandy Springs-Alpharetta, GA
- Population (ZIP)
- 50,089
- Household income
- $66,973
- Rent vs Own
- Severe rent burden
- 2024.0
Population outlook (Clayton County) Hauer SSP2
- Today (2025)
- 310,777 people
- By 2030
- 329,762 · +6.1%
- By 2040
- 368,052 · +18.4%
- By 2050
- 401,196 · +29.1%
- By 2075
- 472,488 · +52.0%
- By 2100
- 500,446 · +61.0%
Race, ethnicity, and origin ACS 2023
- Neighborhood character
- Diverse neighborhood (Simpson 0.56)
- Race & ethnicity
- Black 64% White 14% Hispanic / Latino 11% Two or more races 8% Asian 5%
- Hispanic origin (detail)
- Mexican 6% Puerto Rican 1%
- Common ancestry
- Slovak 1% Italian 1% Hispanic 1%
- Foreign-born
- 13% · Canada, Vietnam, China
- Languages at home
- 81% English-only · Spanish 10% Vietnamese 3% French/Haitian/Cajun 2%
Political lean MEDSL · Clayton
- 2024 margin
- Solid D (+69.2) · D 84.3% · R 15.1%
- 2008→2024 swing
- +2.8pp toward D · 2008: 66.4pp · 2024: 69.2pp
- All cycles
- 2024: D+69.2 2020: D+70.9 2016: D+71.9 2012: D+70.1 2008: D+66.4
Not yet ingested
- Civics
- —
Market trends
- HPI YoY
- ▼ -137.02%
- Current HPI
- 204.1778
- Rent YoY
- ▲ 2.15%
- Metro
- Atlanta-Sandy Springs-Alpharetta, GA
- State GDP YoY
- ▲ 2.66%
- F500 in state
- 28
Industry mix (Fortune 500 HQ in GA)
| Industry | F500 HQs | Revenue |
|---|---|---|
| Paper / Packaging | 2 | $29B |
|
||
| Retail | 1 | $160B |
|
||
| Transportation / Logistics | 1 | $91B |
|
||
| Airlines | 1 | $62B |
|
||
| Consumer Goods | 1 | $47B |
|
||
| Utilities | 1 | $25B |
|
||
Price history
+148.5% since first listed24 events — show timeline
- 2026-06-03 Listed $121,000 GAMLS
- 2026-06-03 Listed $121,000 FMLS
- 2025-05-04 Rental Removed $1,389 RENTALBEAST
- 2025-05-01 Rental Removed $1,389 RENT.
- 2025-04-24 Listed for Rent $1,389 RENTALBEAST
- 2025-04-23 Listed for Rent $1,389 RENT.
- 2025-01-12 Rental Removed $1,375 RENTALBEAST
- 2025-01-10 Rental Removed $1,375 RENT.
- 2025-01-09 Listed for Rent $1,375 RENTALBEAST
- 2024-12-28 Listed for Rent $1,375 RENT.
- 2022-01-18 Sold (Public Records) $105,000 Public Records
- 2021-12-22 Listing Removed — GAMLS
- 2021-11-01 Pending — GAMLS
- 2021-10-29 Relisted — GAMLS
- 2021-10-26 Pending — GAMLS
- 2021-10-24 Relisted — GAMLS
- 2021-10-21 Listing Removed — GAMLS
- 2021-09-21 Listed $105,000 GAMLS
- 2016-10-21 Sold (MLS) $40,000 GAMLS
- 2016-10-18 Pending — GAMLS
- 2016-10-13 Listed $39,900 GAMLS
- 2006-05-03 Sold (Public Records) $73,500 Public Records
- 1989-05-16 Sold (Public Records) $51,100 Public Records
- 1985-10-31 Sold (Public Records) $48,700 Public Records
Property tax history
+3.1%/yrLatest (2025): $1,613 · -1.8% YoY. Source: county tax records.
Cash-flow waterfall
monthlySold comps — $/sqft
last 12 mo · ≤1 miLoading sold comps…