726 Gaywood Dr · Woodway, TX
Flood risk 1/10 · Minimal
- FEMA flood zone
- X (unshaded)
- Chance of flooding over 30 yrs
- 0.0%
- Est. flood insurance / yr
- $507 – $1,088
Fire risk 3/10 · Minor
- Est. fire insurance / yr
- $1,222 – $2,270
Heat risk 7/10 · Major
- Hot days now (above 108°F)
- 6 days/yr
- Hot days in 30 yrs
- 20 days/yr
Wind risk 6/10 · Moderate
- Chance of severe wind over 30 yrs
- 60.0%
Air-quality risk 2/10 · Minimal
- Unhealthy air days now
- 0 days/yr
- Unhealthy air days in 30 yrs
- 1 days/yr
Risk factors via First Street. Map © Google.
Why this score? — see what drove the C+ grade
The composite is a weighted blend of 9 inputs, each scored 0–100. Each bar is that input's sub-score; the figure is the points it added to the 100-point composite (weight × sub-score).
- Cash flow +19.2/30.0
- ARV discount +15.0/15.0
- 1% rule +6.1/10.0
- DSCR +6.1/10.0
- Schools +5.2/10.0
- Livability +3.4/5.0
- Rent growth +2.7/5.0
- Condition / age +2.5/5.0
- Appreciation +0.0/10.0
$199,900
🖨 Deal sheet (PDF) 📄 Offer letter ✓ Due diligence
Listing remarks
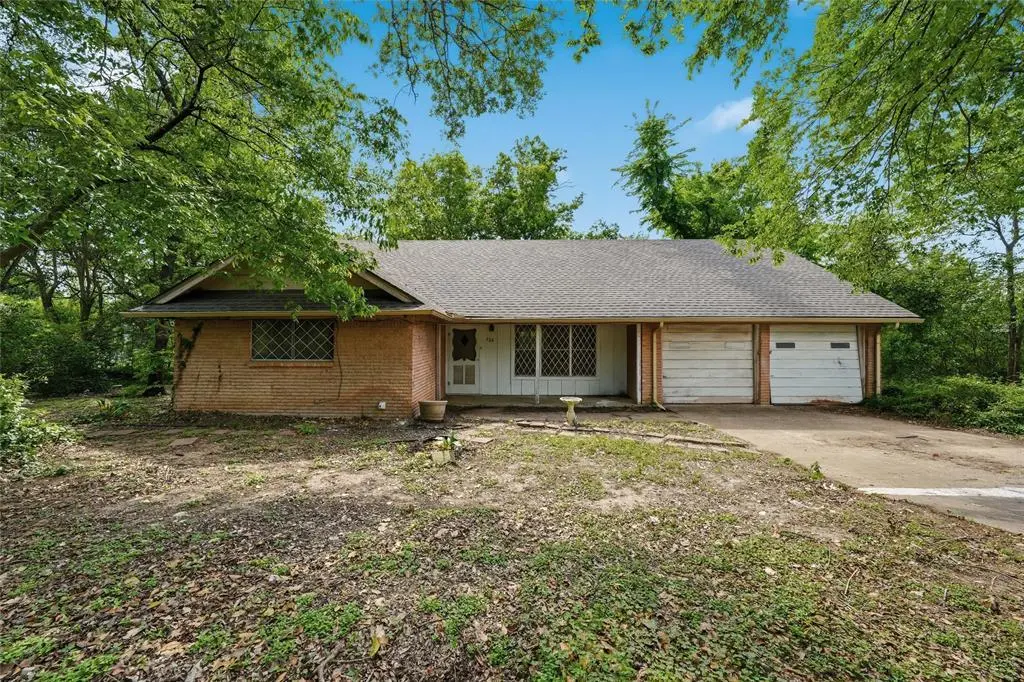
THE LOWEST PRICE HOME IN WOODWAY offers a great opportunity for those looking for a fixer-upper! Set among the rolling terrain and mature trees that define Woodway, this 1.5-story home presents a strong opportunity for a buyer ready to make updates and improvements. The main level features two separate living areas, offering flexibility in layout and use. The second living space, located just off the kitchen and dining area, includes a wood-burning fireplace and direct access to the patio overlooking a wooded ravine. The current layout allows for defined spaces, or it could be opened to create a more connected living area. The first floor includes a primary bedroom with its own en suite
Key facts
- 0.4 acre lot
- 2 garage spots
- Built 1961
Tags
Property features AI
Finance
- Other: Probate listing; County: McLennan; Country: United States
- Financial info: Treat as clear loan type; No second mortgage
- HOA & community: No association
Exterior
- Parking: Attached 2-car garage; 2 covered parking spaces; Driveway
- Utilities: City water; City sewer; Not in a municipal utility district
- Home design: Single family residence; Residential property; Not attached to another property; Subdivision: Shalimar
- Construction: Built in 1961; Brick and wood construction
- Exterior features: Sloped lot with steep slope
Interior
- Kitchen: No appliances listed
- Bedrooms: 4 bedrooms (primary bedroom on level 1)
- Bathrooms: 3 bathrooms (2 full, 1 half)
- Interior features: One and one-half levels; One living area; One dining area; Den with fireplace
- Laundry & utility: No laundry/utility appliances listed
Neighborhood map
What this means for you Summary
Snapshot
- This is a 4-bed/2.5-bath single-family listed at $200k.
Deal economics
- At list price, monthly cash flow is $216 ($3k/yr) — positive.
- The deal already cash-flows at list — no discount required.
- Meets the 1% rule at list price ($2k rent vs $200k).
- Recommended offer: $194k (3.0% below list) — sets the bar for market timing.
Location & tenants
- Location reads 67/100 on livability (#521 in TX) — a middle-class / working-renter tenant base. Strengths: crime A+, employment A+, housing A+; Watch: amenities F, commute F, health & safety F.
- Midway ISD (other): math 61% / reading 58% proficiency, ranked #56 of 826 in TX (top 7%) — acceptable for families but not a draw, mixed tenant base, ~2y average lease.
- Zoned schools: Woodway El (math 52% / reading 57%, grade C, #621 of 4,322 statewide, top 15%, 567 students, 28% FRL) — zoned schools at 28% FRL track the district average.
- Market conditions: Rents flat; 308 active listings in the ZIP; 5 comparable units currently listed for rent nearby; rentals lingering (median 45d on market — plan ~5-8 weeks vacancy on turnover, expect pricing pressure); 60% of comp listings sitting > 30 days — soft ceiling on asking rent; solid renter incomes; 1,014 units permitted in McLennan County in 2024 (200 in 5+ unit buildings).
Forward outlook
- Local home prices are declining (-3.0%/yr); year-one equity from $1k of loan paydown is wiped out by about $6k of value loss. Plan a longer hold.
- McLennan County population projected at +17% by 2050 — long-run rental-demand tailwind backs the buy-and-hold thesis.
Negotiation context
- It's been on market 60 days — a 3% lower offer ($194k) is reasonable based on typical stale-listing flexibility.
Risks & watch-outs
- Climate carrying-cost: major wind risk, 60% chance of damaging wind over 30y; extreme-heat days projected 6→20/yr by 2055 (HVAC capex compounding) — expect insurance premiums to compound above CPI over the hold.
Questions for the listing agent
- It's been on market 60 days. Have you received any prior offers? Is the seller open to a 3% concession, seller financing, or rate buy-down credit?
- Built in 1961 — when were the roof, HVAC, electrical panel, plumbing, and water heater last replaced?
- Is there a deadline driving the sale (1031 exchange, divorce, estate, relocation)? That informs how much negotiation room exists.
- What's the average days-on-market for RENTAL listings here right now (not sales)? A rising rental-DOM trend means longer vacancies and softer asking-rent achievability than the comps imply.
- What's the recent tenant-quality profile in this submarket — average credit score on applications, eviction rate, late-payment / NSF rate, and stable-employment percentage? A property-management company in the area should have these aggregated.
- How much new for-sale + rental construction is in the pipeline within 1–3 miles? Heavy new supply typically softens prices + rents 12–24 months out; constrained supply supports both.
Investment metrics
- 1% rule
- 1.11% ✓
- Cap rate
- 7.59%
- Cash-on-cash
- 4.64%
- DSCR
- 1.21
- GRM
- 7.5
CMA / ARV
- ARV (on-the-fly)
- $365,100
- Comps found
- 12
Show comp detail 12 sales within ~0.75 mi
| Address | Dist | Beds/Ba | Sqft | Sold | Price | $/sf | Match |
|---|---|---|---|---|---|---|---|
| 7517 Brentwood Cir | 0.27mi | 4/2.0 | 2,259 (-7%) | 5mo | $374,900 | $166 | 69 |
| 7516 Brentwood Cir | 0.26mi | 4/3.0 | 2,539 (+4%) | 19mo | $425,000 | $167 | 63 |
| 733 Bellaire Dr | 0.33mi | 3/2.0 (-1) | 2,323 (-5%) | 13mo | $320,000 | $138 | 60 |
| 1132 Redondo Dr | 0.32mi | 4/2.5 | 2,570 (+6%) | 20mo | $315,000 | $123 | 60 |
| 1133 Forest Grove Dr | 0.66mi | 5/2.5 (+1) | 2,435 (0%) | 8mo | $299,900 | $123 | 58 |
| 1124 Woodland West Dr | 0.62mi | 4/3.0 | 2,414 (-1%) | 15mo | $482,000 | $200 | 55 |
| 700 Topeka Dr | 0.36mi | 3/2.5 (-1) | 2,322 (-5%) | 20mo | $319,900 | $138 | 54 |
| 1220 Wedgewood Dr | 0.39mi | 4/3.0 | 2,566 (+5%) | 23mo | $385,000 | $150 | 52 |
| 7416 Brentwood Cir | 0.39mi | 3/2.0 (-1) | 2,115 (-13%) | 9mo | $320,000 | $151 | 46 |
| 8257 Forest Ridge Dr | 0.56mi | 3/2.0 (-1) | 2,215 (-9%) | 16mo | $399,000 | $180 | 39 |
| 7213 Sandera Dr | 0.63mi | 4/3.0 | 2,673 (+10%) | 20mo | $389,990 | $146 | 36 |
| 1124 Western Oaks Dr | 0.71mi | 5/2.5 (+1) | 2,263 (-7%) | 20mo | $275,000 | $122 | 33 |
Match score weights: distance 35% · size 25% · config 20% · recency 20%. Top-matched comps best support the ARV.
Projected returns pro-forma
-3.0% appreciation · 0.71% rent growth · sell at horizon
- IRR
- -11.9%
- Equity multiple
- 0.58×
- Total profit
- $-23,473
- Equity at exit
- $29,806
- IRR
- -6.8%
- Equity multiple
- 0.61×
- Total profit
- $-21,724
- Equity at exit
- $17,284
Cash invested: $55,972 (down + closing). Projections, not guarantees.
Landlord ↔ Tenant lean methodology
- Overall (STATE)
- 87 Strongly Landlord-Friendly
- State Texas
- 87 Strongly Landlord-Friendly · R+5
- County
- — inherits STATE
- City
- — inherits STATE
ZIP-level market 76712
- Home prices YoY
- -32.6%
- Rents YoY
- 0.7%
- Active inventory
- 308
- Price-to-rent
- 7.5×
Monthly cashflow live
- Estimated rent
- $2,213 high interval (Pro) →
- Mortgage (P&I)
- −$1,048
- Tax from tax record
- −$400 /mo · $4,803/yr
- Insurance
- −$83
- HOA
- −$0
- Vacancy / Maint / Mgmt
- −$465
- Net cashflow
- $216
Break-even live
Sensitivity live
| Price | -10% $329 | -5% $273 | +0% $216 | +5% $160 | +10% $103 |
|---|---|---|---|---|---|
| Rent | -10% $42 | -5% $129 | +0% $216 | +5% $304 | +10% $391 |
| Rate | -1.0pp $317 | -0.5pp $267 | base $216 | +0.5pp $165 | +1.0pp $112 |
UW: 25.0% down · 7.5% · 30yr · 1.5% tax · 5.0% vac · 8.0% maint · 8.0% mgmt
Financing live
Cash to close
- Down payment
- $49,975
- Closing costs
- $5,997
- Reserves months
- —
- Total cash needed
- —
Loan-product check · same deal, 3 products live
Conventional
25% down · 7.5% · 30yr
- Down + closing
- —
- Monthly P&I
- —
- Monthly cashflow
- —
- DSCR
- —
- Eligible?
- —
Personal DTI + credit; lowest rate.
DSCR
20% down · 8.5% · 30yr
- Down + closing
- —
- Monthly P&I
- —
- Monthly cashflow
- —
- DSCR
- —
- Eligible?
- —
No personal income docs; deal must DSCR.
Hard money
10% down · 12.0% · 12mo
- Down + closing
- —
- Monthly P&I
- —
- Monthly cashflow
- —
- DSCR
- —
- Eligible?
- —
Short-term bridge; refi at stabilization.
Rent comps 5 comps
| Address | Beds | Baths | Sqft | Rent | $/sqft | DOM | Units | Dist |
|---|---|---|---|---|---|---|---|---|
| 1125 Wedgewood Dr Woodway, TX | 4.0 | 2.0 | 2246 | $2,195 | $0.98 | 44d | 1 | 0.33mi |
| 701 Topeka Dr Woodway, TX | 3.0 | 2.0 | 1781 | $2,300 | $1.29 | 14d | 1 | 0.40mi |
| 901 Rambler Dr Waco, TX | 3.0 | 2.0 | 1629 | $1,795 | $1.10 | 22d | 1 | 0.82mi |
| 6807 Alford Dr Waco, TX | 3.0 | 2.5 | 1800 | $1,495 | $0.83 | 44d | 1 | 0.98mi |
| 549 N 62nd St Waco, TX | 4.0 | 2.0 | 1690 | $1,995 | $1.18 | 44d | 1 | 1.42mi |
Listing history 12 events
-
2026-06-21statusdays on market $199,900 Active 60 DOM
-
2026-06-12statusdays on market $199,900 Pending 58 DOM
-
2026-06-10days on market $199,900 Active 57 DOM
-
2026-06-08days on market $199,900 Active 56 DOM
-
2026-06-08days on market $199,900 Active 55 DOM
-
2026-06-07days on market $199,900 Active 54 DOM
-
2026-06-04price $199,900 Active 51 DOM
-
2026-06-03days on market $215,000 Active 51 DOM
-
2026-06-02days on market $215,000 Active 50 DOM
-
2026-06-01days on market $215,000 Active 49 DOM
-
2026-05-31remarks 699-char remark
-
2026-05-31$215,000 Active 48 DOM
ⓘ Source: listings_history table (triggers on properties + properties_extension) + one-shot
backfill from property_details.listing_events for pre-trigger history.
Tax reassessment forecast TX · Resets to sale price
- Current annual tax
- $4,803 · $400/mo
- Projected year-2 tax
- $4,803 · $400/mo
- Expected delta
- $0/yr ($0/mo · 0.0%)
ⓘ Screening estimate from a state-policy table — verify with the county assessor before closing.
Climate risk First Street
- Flood 1/10 Low FEMA zone X (unshaded) · 0% chance over 30 yrs
- Wildfire 3/10 Moderate
- Heat 7/10 Severe 6 d/yr ≥108°F today · 20 d/yr by 30 yrs out
- Wind 6/10 Major 60% chance of damaging wind over 30 yrs
- Air quality 2/10 Low 0 unhealthy d/yr today · 1 by 30 yrs out
Nearby sold comps map
Loading sold comps map…
Walkable amenities ~0.75 mi
Loading nearby amenities…
Taxation est. · year 1
- Rental income
- $26,555
- − Mortgage interest
- −$11,198
- − Property taxes
- −$4,803
- − Insurance
- −$1,000
- − Repairs & maintenance
- −$2,124
- − Management
- −$2,124
- − Depreciation
- −$5,815
- Taxable loss
- −$509
- Est. tax savings @ 24.0%
- +$122
- After-tax cash flow
- $2,718/yr
For passive investors: Depreciation is non-cash, so a rental often shows a tax loss while cash-flowing — sheltering income. Rental losses are passive: they offset passive income freely, and up to $25,000/yr can offset ordinary (W-2) income if you actively participate and your MAGI is under $100k (phasing out to $0 by $150k); unused losses carry forward. On sale, claimed depreciation is recaptured at up to 25%, and gains may owe capital-gains tax (a 1031 exchange can defer both). Figures are a year-1 estimate at your 24.0% rate — not tax advice; consult a CPA.
Schools (NCES district)
- District
- Midway ISD
- NCES district ID
- 4830640
- Math proficiency
- 61% ▼ -8.00%
- Reading proficiency
- 58% ▼ -7.00%
- Median HH income
- $67,076
- Composite
- 52.32/100
- National rank
- #1593
- State rank
- #56 of 826 in TX
Livability — Woodway
- Score
- 67/100
- State rank
- #521
- US rank
- #10234
Category grades
Schools grade is shown separately in the Schools card above.
Census & demographics
- Census place
- Woodway, TX
- County
- McLennan County · 213,088 people
- City population
- 29,118
- Metro
- Waco, TX
- Population (ZIP)
- 29,118
- Household income
- $97,903
- Rent vs Own
- Severe rent burden
- 847.0
Population outlook (McLennan County) Hauer SSP2
- Today (2025)
- 264,191 people
- By 2030
- 273,578 · +3.6%
- By 2040
- 291,506 · +10.3%
- By 2050
- 308,044 · +16.6%
- By 2075
- 349,648 · +32.3%
- By 2100
- 364,779 · +38.1%
Race, ethnicity, and origin ACS 2023
- Neighborhood character
- Predominantly White (72%)
- Race & ethnicity
- White 72% Hispanic / Latino 14% Two or more races 12% Black 7% Asian 2%
- Hispanic origin (detail)
- Mexican 11% Puerto Rican 1%
- Common ancestry
- Slovak 3% Italian 2% Iranian 2%
- Foreign-born
- 5% · Canada, China
- Languages at home
- 90% English-only · Spanish 6% Other Indo-European 1% German/W. Germanic 1%
Political lean MEDSL · McLennan
- 2024 margin
- Solid R (+30.9) · D 34.0% · R 64.9% · Other 1.0%
- 2008→2024 swing
- -7.0pp toward R · 2008: -23.9pp · 2024: -30.9pp
- All cycles
- 2024: R+30.9 2020: R+23.4 2016: R+27.1 2012: R+29.8 2008: R+23.9
Not yet ingested
- Civics
- —
Market trends
- HPI YoY
- ▼ -96.17%
- Current HPI
- 198.9025
- Rent YoY
- ▲ 0.71%
- Metro
- Waco, TX
- State GDP YoY
- ▲ 3.95%
- F500 in state
- 110
Industry mix (Fortune 500 HQ in TX)
| Industry | F500 HQs | Revenue |
|---|---|---|
| Energy | 16 | $1,198B |
|
||
| Technology | 5 | $198B |
|
||
| Engineering / Construction | 4 | $72B |
|
||
| Energy Services | 3 | $60B |
|
||
| Utilities | 3 | $41B |
|
||
| Healthcare | 2 | $330B |
|
||
Price history
-6.5% since first listed3 events — show timeline
- 2026-05-11 Price Changed $215,000 NTREIS
- 2026-04-13 Listed $229,900 NTREIS
- 1997-11-21 Sold (Public Records) — Public Records
Property tax history
+4.3%/yrLatest (2025): $4,803 · +11.3% YoY. Source: county tax records.
Cash-flow waterfall
monthlySold comps — $/sqft
last 12 mo · ≤1 miLoading sold comps…