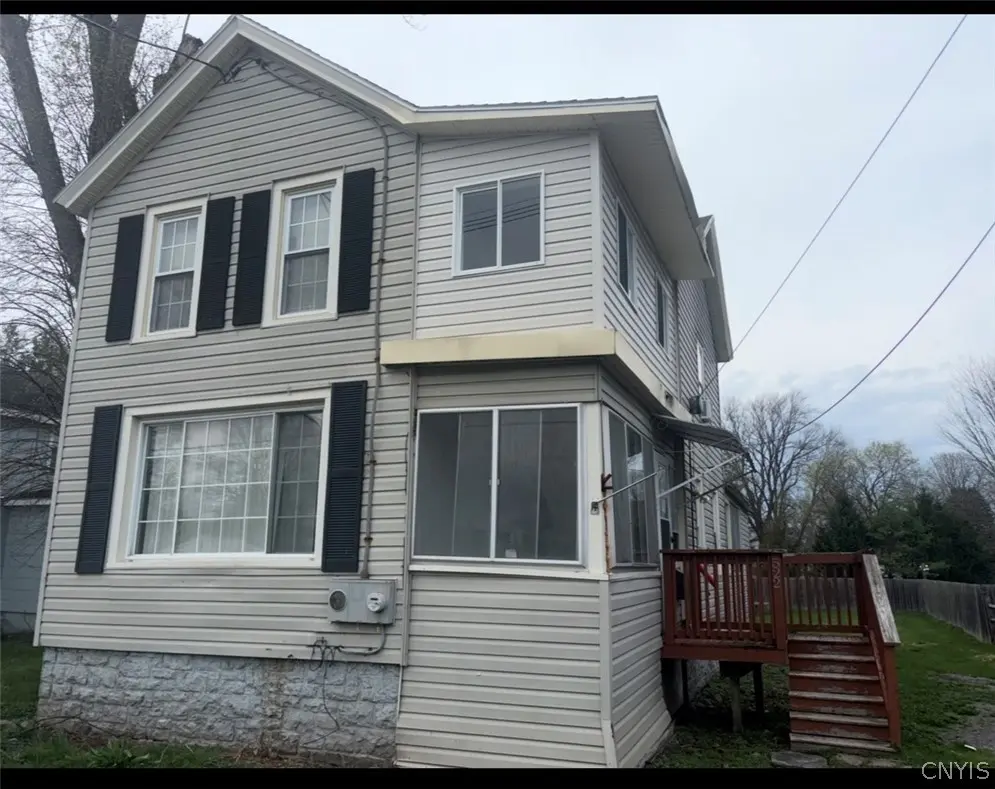
522 Stone St · Oneida, NY
Flood risk 1/10 · Minimal
- FEMA flood zone
- X (unshaded)
- Chance of flooding over 30 yrs
- 0.0%
- Est. flood insurance / yr
- $473 – $860
Fire risk 2/10 · Minimal
- Est. fire insurance / yr
- $691 – $1,283
Heat risk 3/10 · Minor
- Hot days now (above 94°F)
- 7 days/yr
- Hot days in 30 yrs
- 16 days/yr
Wind risk 1/10 · Minimal
- Chance of severe wind over 30 yrs
- 0.0%
Air-quality risk 2/10 · Minimal
- Unhealthy air days now
- 0 days/yr
- Unhealthy air days in 30 yrs
- 1 days/yr
Risk factors via First Street. Map © Google.
Why this score? — see what drove the B+ grade
The composite is a weighted blend of 9 inputs, each scored 0–100. Each bar is that input's sub-score; the figure is the points it added to the 100-point composite (weight × sub-score).
- Cash flow +30.0/30.0
- ARV discount +15.0/15.0
- 1% rule +10.0/10.0
- DSCR +10.0/10.0
- Schools +4.1/10.0
- Livability +3.1/5.0
- Rent growth +2.5/5.0
- Condition / age +2.5/5.0
- Appreciation +0.0/10.0
$99,000
🖨 Deal sheet (PDF) 📄 Offer letter ✓ Due diligence
Listing remarks
Centrally located in Oneida NY, this home is ready for new owners who are looking for a project to build equity. Whether you are looking for a place to call home or an investment property, this could be the right one.
Key facts
- 7,405 sq ft lot
- Built 1900
- Listed 29 days
Property features AI
Exterior
- Parking: No garage
- Utilities: Public water connected; Sewer connected
- Home design: 2-story home; Resale property
- Construction: Vinyl siding; Block foundation; Existing structure
- Exterior features: See remarks for exterior details; Rectangular lot (approx. 51 x 145)
Interior
- Kitchen: No specific kitchen appliance list provided
- Bedrooms: Total of 8 rooms (includes bedrooms and living spaces)
- Bathrooms: 1 full bathroom (main level)
- Heating & cooling: Gas forced-air heating
- Interior features: See remarks for additional interior details; Full basement
- Laundry & utility: Laundry located in the basement; Gas water heater
Neighborhood map
What this means for you Summary
Snapshot
- This is a 5-bed/2.0-bath single-family listed at $99k.
Deal economics
- At list price, monthly cash flow is $453 ($5k/yr) — positive.
- The deal already cash-flows at list — no discount required.
- Meets the 1% rule at list price ($2k rent vs $99k).
- Recommended offer: $98k (1.5% below list) — sets the bar for market timing.
- Cap rate 11.8% vs local median 4.0% in Oneida — top-decile yield for the area; either an underpriced asset or a hidden risk that comps aren't pricing in. Stress-test before assuming the spread holds.
Location & tenants
- Location reads 61/100 on livability (#924 in NY) — a middle-class / working-renter tenant base. Strengths: cost of living A+, housing A+; Watch: employment C-, health & safety C-, crime F.
- Oneida City School District (town): math 43% / reading 54% proficiency, ranked #421 of 590 in NY (top 71%) — families likely to look elsewhere, expect single-tenant / working-renter base with shorter leases.
- Zoned schools: Seneca Street School (math 47% / reading 57%, grade C-, #988 of 2,108 statewide, top 49%, 203 students, 45% FRL); Otto L Shortell Middle School (math 23% / reading 45%, grade F, #497 of 729 statewide, top 69%, 391 students, 53% FRL); Oneida Senior High School (math 87% / reading 87%, grade A, #311 of 1,100 statewide, top 30%, 564 students, 43% FRL).
- Market conditions: 67 active listings in the ZIP; 137 units permitted in Madison County in 2024 (46 in 5+ unit buildings).
Forward outlook
- Local home prices are declining (-3.0%/yr); year-one equity from $684 of loan paydown is wiped out by about $3k of value loss. Plan a longer hold.
- Madison County population projected at -24% by 2050 — secular population decline; favor cash flow + early exit over multi-decade hold.
- At projected returns (-3.0% appreciation + 3.0% rent growth), your $28k cash investment doubles in ~7 years — after that, you're playing with house money.
Negotiation context
- It's been on market 29 days — a 2% lower offer ($98k) is reasonable based on typical stale-listing flexibility.
- 2 sale attempts with the ask held roughly flat each time — persistent listings suggest the price (not the market) is what's stuck; bring a comps-based counter.
- Current owner paid $83k; 19% above their basis — modest negotiation headroom, anchor on the comps not their cost.
Risks & watch-outs
- Watch-outs: property tax is 3.7% of price; built in 1900 — expect roof / HVAC / electrical / plumbing capex.
Questions for the listing agent
- Built in 1900 — when were the roof, HVAC, electrical panel, plumbing, and water heater last replaced?
- Property tax is high relative to price — has the assessment been appealed recently, and will the sale trigger a re-assessment?
- Is there a deadline driving the sale (1031 exchange, divorce, estate, relocation)? That informs how much negotiation room exists.
- Crime grade is F in this area — have there been break-ins, vandalism, or insurance claims at this property in the last 3 years? What carrier currently insures it and at what premium?
- What's the average days-on-market for RENTAL listings here right now (not sales)? A rising rental-DOM trend means longer vacancies and softer asking-rent achievability than the comps imply.
- What's the recent tenant-quality profile in this submarket — average credit score on applications, eviction rate, late-payment / NSF rate, and stable-employment percentage? A property-management company in the area should have these aggregated.
- How much new for-sale + rental construction is in the pipeline within 1–3 miles? Heavy new supply typically softens prices + rents 12–24 months out; constrained supply supports both.
Investment metrics
- 1% rule
- 1.69% ✓
- Cap rate
- 11.78%
- Cash-on-cash
- 19.61%
- DSCR
- 1.87
- GRM
- 4.9
CMA / ARV
- ARV (on-the-fly)
- $152,796
- Comps found
- 2
Show comp detail 2 sales within ~0.75 mi
| Address | Dist | Beds/Ba | Sqft | Sold | Price | $/sf | Match |
|---|---|---|---|---|---|---|---|
| 229 Boston St | 0.61mi | 4/1.5 (-1) | 1,449 (+13%) | 6mo | $164,900 | $114 | 38 |
| 227 Bates Ave | 0.60mi | 4/2.0 (-1) | 1,464 (+14%) | 14mo | $174,900 | $119 | 32 |
Match score weights: distance 35% · size 25% · config 20% · recency 20%. Top-matched comps best support the ARV.
Projected returns pro-forma
-3.0% appreciation · 3.0% rent growth · sell at horizon
- IRR
- 11.8%
- Equity multiple
- 1.47×
- Total profit
- $12,955
- Equity at exit
- $14,761
- IRR
- 20.8%
- Equity multiple
- 2.77×
- Total profit
- $49,006
- Equity at exit
- $8,560
Cash invested: $27,720 (down + closing). Projections, not guarantees.
Landlord ↔ Tenant lean methodology
- Overall (STATE)
- 15 Strongly Tenant-Friendly
- State New York
- 15 Strongly Tenant-Friendly · D+10
- County
- — inherits STATE
- City
- — inherits STATE
ZIP-level market 13421
- Home prices YoY
- -5.1%
- Active inventory
- 67
- Price-to-rent
- 4.9×
Monthly cashflow live
- Estimated rent
- $1,674 medium interval (Pro) →
- Mortgage (P&I)
- −$519
- Tax from tax record
- −$309 /mo · $3,711/yr
- Insurance
- −$41
- HOA
- −$0
- Vacancy / Maint / Mgmt
- −$352
- Net cashflow
- $453
Break-even live
Sensitivity live
| Price | -10% $509 | -5% $481 | +0% $453 | +5% $425 | +10% $397 |
|---|---|---|---|---|---|
| Rent | -10% $321 | -5% $387 | +0% $453 | +5% $519 | +10% $585 |
| Rate | -1.0pp $503 | -0.5pp $478 | base $453 | +0.5pp $427 | +1.0pp $401 |
UW: 25.0% down · 7.5% · 30yr · 1.5% tax · 5.0% vac · 8.0% maint · 8.0% mgmt
Financing live
Cash to close
- Down payment
- $24,750
- Closing costs
- $2,970
- Reserves months
- —
- Total cash needed
- —
Loan-product check · same deal, 3 products live
Conventional
25% down · 7.5% · 30yr
- Down + closing
- —
- Monthly P&I
- —
- Monthly cashflow
- —
- DSCR
- —
- Eligible?
- —
Personal DTI + credit; lowest rate.
DSCR
20% down · 8.5% · 30yr
- Down + closing
- —
- Monthly P&I
- —
- Monthly cashflow
- —
- DSCR
- —
- Eligible?
- —
No personal income docs; deal must DSCR.
Hard money
10% down · 12.0% · 12mo
- Down + closing
- —
- Monthly P&I
- —
- Monthly cashflow
- —
- DSCR
- —
- Eligible?
- —
Short-term bridge; refi at stabilization.
Listing history 24 events
-
2026-06-21days on market $99,000 Active 29 DOM
-
2026-06-21days on market $99,000 Active 28 DOM
-
2026-06-18days on market $99,000 Active 26 DOM
-
2026-06-17days on market $99,000 Active 25 DOM
-
2026-06-16days on market $99,000 Active 24 DOM
-
2026-06-15days on market $99,000 Active 23 DOM
-
2026-06-13days on market $99,000 Active 21 DOM
-
2026-06-12days on market $99,000 Active 20 DOM
-
2026-06-09days on market $99,000 Active 17 DOM
-
2026-06-08days on market $99,000 Active 16 DOM
-
2026-06-07days on market $99,000 Active 15 DOM
-
2026-06-07days on market $99,000 Active 14 DOM
-
2026-06-04days on market $99,000 Active 11 DOM
-
2026-06-02days on market $99,000 Active 10 DOM
-
2026-06-01days on market $99,000 Active 9 DOM
-
2026-05-31days on market $99,000 Active 8 DOM
-
2026-05-22$99,000 Active
-
2025-10-21historical
-
2025-09-09price $160,000
-
2025-07-24price $169,000
-
2025-05-28price $175,000
-
2025-05-15price $179,000
-
2025-04-24$179,900 Active
-
2008-09-18soldstatus $83,000
ⓘ Source: listings_history table (triggers on properties + properties_extension) + one-shot
backfill from property_details.listing_events for pre-trigger history.
Tax reassessment forecast NY · Partial reset (capped growth)
- Current annual tax
- $3,711 · $309/mo
- Projected year-2 tax
- $3,711 · $309/mo
- Expected delta
- $0/yr ($0/mo · 0.0%)
ⓘ Screening estimate from a state-policy table — verify with the county assessor before closing.
Climate risk First Street
- Flood 1/10 Low FEMA zone X (unshaded) · 0% chance over 30 yrs
- Wildfire 2/10 Low
- Heat 3/10 Moderate 7 d/yr ≥94°F today · 16 d/yr by 30 yrs out
- Wind 1/10 Low 0% chance of damaging wind over 30 yrs
- Air quality 2/10 Low 0 unhealthy d/yr today · 1 by 30 yrs out
Nearby sold comps map
Loading sold comps map…
Walkable amenities ~0.75 mi
Loading nearby amenities…
Taxation est. · year 1
- Rental income
- $20,093
- − Mortgage interest
- −$5,546
- − Property taxes
- −$3,711
- − Insurance
- −$495
- − Repairs & maintenance
- −$1,607
- − Management
- −$1,607
- − Depreciation
- −$2,880
- Taxable income
- $4,246
- Est. tax owed @ 24.0%
- −$1,019
- After-tax cash flow
- $4,418/yr
For passive investors: Depreciation is non-cash, so a rental often shows a tax loss while cash-flowing — sheltering income. Rental losses are passive: they offset passive income freely, and up to $25,000/yr can offset ordinary (W-2) income if you actively participate and your MAGI is under $100k (phasing out to $0 by $150k); unused losses carry forward. On sale, claimed depreciation is recaptured at up to 25%, and gains may owe capital-gains tax (a 1031 exchange can defer both). Figures are a year-1 estimate at your 24.0% rate — not tax advice; consult a CPA.
Schools (NCES district)
- District
- Oneida City School District
- NCES district ID
- 3600013
- Math proficiency
- 43% ▼ -11.00%
- Reading proficiency
- 54% ▲ 12.00%
- Median HH income
- $45,791
- Composite
- 41.1/100
- National rank
- #3568
- State rank
- #421 of 590 in NY
Livability — Oneida
- Score
- 61/100
- State rank
- #924
- US rank
- #18033
Category grades
Schools grade is shown separately in the Schools card above.
Census & demographics
- Census place
- Oneida, NY
- City population
- 12,742
- Population (ZIP)
- 12,742
Population outlook (Madison County) Hauer SSP2
- Today (2025)
- 69,528 people
- By 2030
- 66,599 · -4.2%
- By 2040
- 59,814 · -14.0%
- By 2050
- 52,842 · -24.0%
- By 2075
- 39,167 · -43.7%
- By 2100
- 28,442 · -59.1%
Race, ethnicity, and origin ACS 2023
- Neighborhood character
- Predominantly White (92%)
- Race & ethnicity
- White 92% Two or more races 4% Hispanic / Latino 3%
- Common ancestry
- Lithuanian 5% Romanian 4% Iranian 2%
- Foreign-born
- 1% · Canada, China
- Languages at home
- 97% English-only · Spanish 1% Other Indo-European 1%
Political lean MEDSL · Madison
- 2024 margin
- R (+13.1) · D 43.5% · R 56.5%
- 2008→2024 swing
- -13.9pp toward R · 2008: 0.9pp · 2024: -13.1pp
- All cycles
- 2024: R+13.1 2020: R+10.6 2016: R+15.9 2012: D+0.3 2008: D+0.9
Not yet ingested
- Civics
- —
Market trends
- HPI YoY
- ▼ -13.30%
- Current HPI
- 248.3909
- Rent YoY
- —
- Metro
- —
- State GDP YoY
- ▲ 2.60%
- F500 in state
- 92
Industry mix (Fortune 500 HQ in NY)
| Industry | F500 HQs | Revenue |
|---|---|---|
| Financial Services | 10 | $950B |
|
||
| Consumer Goods | 9 | $162B |
|
||
| Insurance | 4 | $225B |
|
||
| Telecommunications | 2 | $144B |
|
||
| Pharmaceuticals | 2 | $112B |
|
||
| Media / Entertainment | 2 | $69B |
|
||
Price history
+19.3% since first listed8 events — show timeline
- 2026-05-22 Listed $99,000 CNYIS
- 2025-10-21 Listing Removed — CNYIS
- 2025-09-09 Price Changed $160,000 CNYIS
- 2025-07-24 Price Changed $169,000 CNYIS
- 2025-05-28 Price Changed $175,000 CNYIS
- 2025-05-15 Price Changed $179,000 CNYIS
- 2025-04-24 Listed $179,900 CNYIS
- 2008-09-18 Sold (Public Records) $83,000 Public Records
Property tax history
+0.6%/yrLatest (2025): $3,711 · +0.2% YoY. Source: county tax records.
Cash-flow waterfall
monthlySold comps — $/sqft
last 12 mo · ≤1 miLoading sold comps…