 🏗️ New Construction
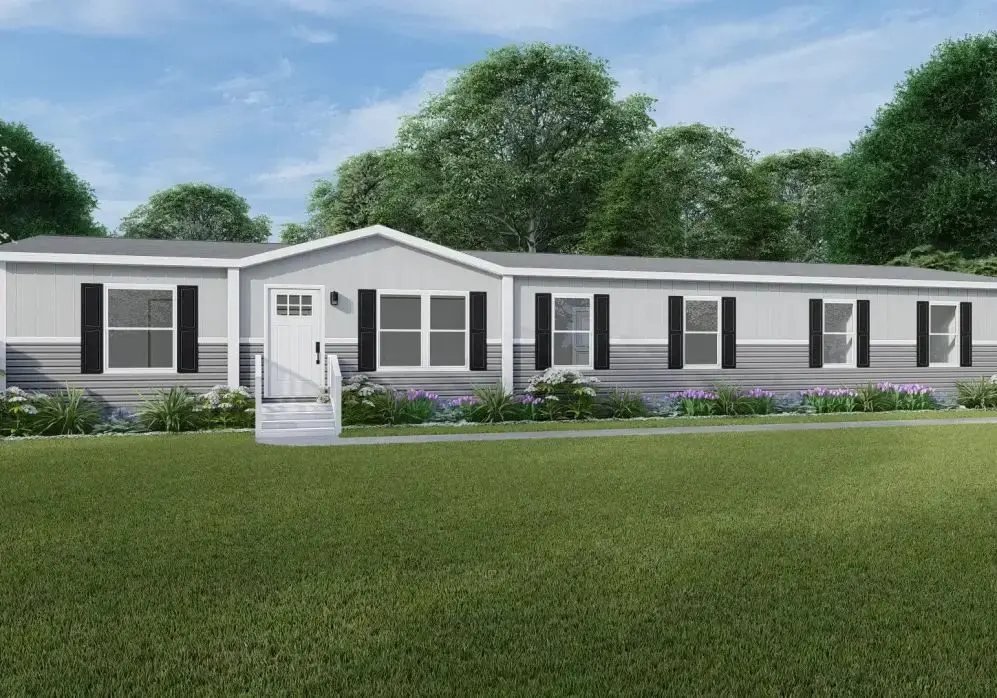
Snowcap Plan · Fort Worth, TX
Flood risk No data
- FEMA flood zone
- —
- Chance of flooding over 30 yrs
- —
- Est. flood insurance / yr
- —
Fire risk No data
- Est. fire insurance / yr
- —
Heat risk No data
- Hot days now (above threshold)
- —
- Hot days in 30 yrs
- —
Wind risk No data
- Chance of severe wind over 30 yrs
- —
Air-quality risk No data
- Unhealthy air days now
- —
- Unhealthy air days in 30 yrs
- —
Risk factors via First Street. Map © Google.
Why this score? — see what drove the B- grade
The composite is a weighted blend of 9 inputs, each scored 0–100. Each bar is that input's sub-score; the figure is the points it added to the 100-point composite (weight × sub-score).
- Cash flow +30.0/30.0
- DSCR +10.0/10.0
- 1% rule +9.0/10.0
- ARV discount +7.5/15.0
- Condition / age +4.8/5.0
- Livability +4.0/5.0
- Rent growth +2.1/5.0
- Schools +2.0/10.0
- Appreciation +0.0/10.0
$143,900
🖨 Deal sheet 📄 Offer letter ✓ Due diligence
Listing remarks MLS
The Epic Experience / The Snowcap by Southern Energy Homes delivers an expansive living area of 2,001 square feet. Featuring 4 bedrooms and 3 bathrooms, The Snowcap is perfect for large families or those who love spacious living. This home combines luxurious amenities with refined design elements, creating an elegant and comfortable living space. * This pricing is for the HOME ONLY. If you need land, we can help with that, ask about our Land Home package!
Key facts
- Listed 313 days
Neighborhood map
What this means for you Summary
Snapshot
- This is a 4-bed/3.0-bath manufactured listed at $144k. Condition is rated excellent.
Deal economics
- At list price, monthly cash flow is $592 ($7k/yr) — positive.
- The deal already cash-flows at list — no discount required.
- Meets the 1% rule at list price ($2k rent vs $144k).
- Recommended offer: $127k (12.0% below list) — sets the bar for market timing.
- Cap rate 11.2% vs local median 3.9% in Fort Worth — top-decile yield for the area; either an underpriced asset or a hidden risk that comps aren't pricing in. Stress-test before assuming the spread holds.
Location & tenants
- Location reads 80/100 on livability (#49 in TX, #1,954 nationally) — a professional / high-income tenant draw. Strengths: amenities A+, cost of living A+, housing A+; Watch: schools D+, crime F.
- Fort Worth ISD (urban): math 18% / reading 28% proficiency, ranked #742 of 826 in TX (top 90%) — low school quality limits family demand, transient renter base, plan for 1-2y turnover; 73% free/reduced lunch — lower-income household profile, screen leases tightly.
- Market conditions: Rents soft (-1.6%/yr); 186 active listings in the ZIP; 10 comparable units currently listed for rent nearby; rentals lingering (median 44d on market — plan ~5-8 weeks vacancy on turnover, expect pricing pressure); 50% of comp listings sitting > 30 days — soft ceiling on asking rent; 18,938 units permitted in Tarrant County in 2024 (8,336 in 5+ unit buildings).
- At $2,008/mo this rent would consume 47% of the median local household income ($51k/yr) (locally 2221% of renters already pay >50% of income on rent) — very limited rent-growth headroom before tenants either downsize or default.
Forward outlook
- Local home prices are declining (-3.0%/yr); year-one equity from $995 of loan paydown is wiped out by about $4k of value loss. Plan a longer hold.
- Tarrant County population projected at +41% by 2050 — long-run rental-demand tailwind backs the buy-and-hold thesis.
- At projected returns (-3.0% appreciation + 0.0% rent growth), your $40k cash investment doubles in ~10 years — after that, you're playing with house money.
Negotiation context
- It's been on market 314 days — a 12% lower offer ($127k) is reasonable based on typical stale-listing flexibility.
Questions for the listing agent
- It's been on market 314 days. Have you received any prior offers? Is the seller open to a 12% concession, seller financing, or rate buy-down credit?
- Why hasn't it sold? Are there any deal-killer items the seller is aware of (foundation, flood, title, zoning, code violations)?
- Is there a deadline driving the sale (1031 exchange, divorce, estate, relocation)? That informs how much negotiation room exists.
- Schools are D-rated, which usually means shorter tenancies and higher turnover. Who's the typical renter profile here, and what's been the actual vacancy rate?
- Crime grade is F in this area — have there been break-ins, vandalism, or insurance claims at this property in the last 3 years? What carrier currently insures it and at what premium?
- What's the average days-on-market for RENTAL listings here right now (not sales)? A rising rental-DOM trend means longer vacancies and softer asking-rent achievability than the comps imply.
- What's the recent tenant-quality profile in this submarket — average credit score on applications, eviction rate, late-payment / NSF rate, and stable-employment percentage? A property-management company in the area should have these aggregated.
- How much new for-sale + rental construction is in the pipeline within 1–3 miles? Heavy new supply typically softens prices + rents 12–24 months out; constrained supply supports both.
Investment metrics
- 1% rule
- 1.40% ✓
- Cap rate
- 11.23%
- Cash-on-cash
- 17.64%
- DSCR
- 1.78
- GRM
- 6.0
CMA / ARV
No comps found within radius.
Projected returns pro-forma
-3.0% appreciation · 0.0% rent growth · sell at horizon
- IRR
- 5.7%
- Equity multiple
- 1.21×
- Total profit
- $8,544
- Equity at exit
- $21,456
- IRR
- 12.2%
- Equity multiple
- 1.83×
- Total profit
- $33,383
- Equity at exit
- $12,442
Cash invested: $40,292 (down + closing). Projections, not guarantees.
Landlord ↔ Tenant lean methodology
- Overall (STATE)
- 87 Strongly Landlord-Friendly
- State Texas
- 87 Strongly Landlord-Friendly · R+5
- County
- — inherits STATE
- City
- — inherits STATE
ZIP-level market 76119
- Home prices YoY
- -6.4%
- Rents YoY
- -1.6%
- Active inventory
- 186
- Price-to-rent
- 6.0×
Monthly cashflow live
- Estimated rent
- $2,008 high interval (Pro) →
- Mortgage (P&I)
- −$755
- Tax est. 1.5%
- −$180 /mo · $2,158/yr
- Insurance
- −$60
- HOA
- −$0
- Vacancy / Maint / Mgmt
- −$422
- Net cashflow
- $592
Break-even live
UW: 25.0% down · 7.5% · 30yr · 1.5% tax · 5.0% vac · 8.0% maint · 8.0% mgmt
Financing live
Cash to close
- Down payment
- $35,975
- Closing costs
- $4,317
- Reserves months
- —
- Total cash needed
- —
Loan-product check · same deal, 3 products live
Conventional
25% down · 7.5% · 30yr
- Down + closing
- —
- Monthly P&I
- —
- Monthly cashflow
- —
- DSCR
- —
- Eligible?
- —
Personal DTI + credit; lowest rate.
DSCR
20% down · 8.5% · 30yr
- Down + closing
- —
- Monthly P&I
- —
- Monthly cashflow
- —
- DSCR
- —
- Eligible?
- —
No personal income docs; deal must DSCR.
Hard money
10% down · 12.0% · 12mo
- Down + closing
- —
- Monthly P&I
- —
- Monthly cashflow
- —
- DSCR
- —
- Eligible?
- —
Short-term bridge; refi at stabilization.
Rent comps 10 comps
| Address | Beds | Baths | Sqft | Rent | $/sqft | DOM | Units | Dist |
|---|---|---|---|---|---|---|---|---|
| 5818 Grayson St Unit 5818 Fort Worth, TX | 3.0 | 2.5 | 1400 | $2,000 | $1.43 | 18d | 1 | 0.27mi |
| 5820 Grayson St Fort Worth, TX | 3.0 | 2.5 | 1417 | $1,895 | $1.34 | 43d | 1 | 0.27mi |
| 5712 Whittlesey Rd Fort Worth, TX | 4.0 | 2.0 | 1610 | $2,000 | $1.24 | 44d | 1 | 0.39mi |
| 5104 Applegate Dr Fort Worth, TX | 4.0 | 3.5 | 2013 | $2,340 | $1.16 | 43d | 1 | 1.29mi |
| 2312 Cass St Fort Worth, TX | 4.0 | 2.5 | 1600 | $1,850 | $1.16 | 14d | 1 | 1.38mi |
| 5505 Shore Point Trl Fort Worth, TX | 4.0 | 2.5 | 2043 | $2,300 | $1.13 | 24d | 1 | 1.40mi |
| 5664 Shore Point Trl Fort Worth, TX | 3.0 | 2.5 | 1742 | $2,150 | $1.23 | 43d | 1 | 1.41mi |
| 5532 Shore Point Trl Fort Worth, TX | 3.0 | 2.5 | 1446 | $1,950 | $1.35 | 43d | 1 | 1.42mi |
| 5541 Topwater Trl Fort Worth, TX | 3.0 | 3.0 | 2089 | $6,100 | $2.92 | 2d | 1 | 1.43mi |
| 5641 Willamette Dr Fort Worth, TX | 3.0 | 2.5 | 1631 | $2,150 | $1.32 | 17d | 1 | 1.48mi |
Listing history 17 events
-
2026-06-18days on market $143,900 Active 314 DOM
-
2026-06-17days on market $143,900 Active 313 DOM
-
2026-06-16days on market $143,900 Active 312 DOM
-
2026-06-15days on market $143,900 Active 311 DOM
-
2026-06-13days on market $143,900 Active 309 DOM
-
2026-06-09days on market $143,900 Active 305 DOM
-
2026-06-08days on market $143,900 Active 304 DOM
-
2026-06-07days on market $143,900 Active 303 DOM
-
2026-06-04days on market $143,900 Active 300 DOM
-
2026-06-03days on market $143,900 Active 299 DOM
-
2026-06-02days on market $143,900 Active 298 DOM
-
2026-06-02days on market $143,900 Active 297 DOM
-
2026-05-31days on market $143,900 Active 296 DOM
-
2026-04-25price $143,900 459-char remark
Show marketing remark (459 chars)
The Epic Experience / The Snowcap by Southern Energy Homes delivers an expansive living area of 2,001 square feet. Featuring 4 bedrooms and 3 bathrooms, The Snowcap is perfect for large families or those who love spacious living. This home combines luxurious amenities with refined design elements, creating an elegant and comfortable living space. * This pricing is for the HOME ONLY. If you need land, we can help with that, ask about our Land Home package!
-
2026-03-28price $152,900 459-char remark
Show marketing remark (459 chars)
The Epic Experience / The Snowcap by Southern Energy Homes delivers an expansive living area of 2,001 square feet. Featuring 4 bedrooms and 3 bathrooms, The Snowcap is perfect for large families or those who love spacious living. This home combines luxurious amenities with refined design elements, creating an elegant and comfortable living space. * This pricing is for the HOME ONLY. If you need land, we can help with that, ask about our Land Home package!
-
2025-09-09price $138,900 459-char remark
Show marketing remark (459 chars)
The Epic Experience / The Snowcap by Southern Energy Homes delivers an expansive living area of 2,001 square feet. Featuring 4 bedrooms and 3 bathrooms, The Snowcap is perfect for large families or those who love spacious living. This home combines luxurious amenities with refined design elements, creating an elegant and comfortable living space. * This pricing is for the HOME ONLY. If you need land, we can help with that, ask about our Land Home package!
-
2025-08-09$135,900 Active 459-char remark
Show marketing remark (459 chars)
The Epic Experience / The Snowcap by Southern Energy Homes delivers an expansive living area of 2,001 square feet. Featuring 4 bedrooms and 3 bathrooms, The Snowcap is perfect for large families or those who love spacious living. This home combines luxurious amenities with refined design elements, creating an elegant and comfortable living space. * This pricing is for the HOME ONLY. If you need land, we can help with that, ask about our Land Home package!
ⓘ Source: listings_history table (triggers on properties + properties_extension) + one-shot
backfill from property_details.listing_events for pre-trigger history.
Nearby sold comps map
Loading sold comps map…
Walkable amenities ~0.75 mi
Loading nearby amenities…
Taxation est. · year 1
- Rental income
- $24,101
- − Mortgage interest
- −$8,061
- − Property taxes
- −$2,158
- − Insurance
- −$720
- − Repairs & maintenance
- −$1,928
- − Management
- −$1,928
- − Depreciation
- −$4,186
- Taxable income
- $5,120
- Est. tax owed @ 24.0%
- −$1,229
- After-tax cash flow
- $5,878/yr
For passive investors: Depreciation is non-cash, so a rental often shows a tax loss while cash-flowing — sheltering income. Rental losses are passive: they offset passive income freely, and up to $25,000/yr can offset ordinary (W-2) income if you actively participate and your MAGI is under $100k (phasing out to $0 by $150k); unused losses carry forward. On sale, claimed depreciation is recaptured at up to 25%, and gains may owe capital-gains tax (a 1031 exchange can defer both). Figures are a year-1 estimate at your 24.0% rate — not tax advice; consult a CPA.
Condition & rehab AI · 14 photos
This manufactured home is in excellent condition with good exterior and interior finishes. It has a good roof and siding, and the landscaping is well-maintained. The home is move-in ready and would benefit from some exterior painting and a small front porch to enhance its curb appeal and rental value.
Value-add opportunities
- Resale Paint the exterior siding and trim — Fresh paint can enhance the curb appeal and make the home look more inviting to potential buyers.
- Rental Add a small front porch — A front porch can provide a welcoming entrance and increase the rental appeal.
Renovation cost estimate screening
Value-add ROI direction
- Resale Paint the exterior siding and trim — Fresh paint can enhance the curb appeal and make the home look more inviting to potential buyers. ↑
- Rental Add a small front porch — A front porch can provide a welcoming entrance and increase the rental appeal. ↑
ⓘ Cost ranges are severity-bucket heuristics (US national rule-of-thumb). Get contractor quotes + a written scope before underwriting a rehab budget.
Schools (NCES district)
- District
- Fort Worth ISD
- NCES district ID
- 4819700
- Math proficiency
- 18% ▼ -16.00%
- Reading proficiency
- 28% ▼ -6.00%
- Median HH income
- $42,109
- Composite
- 19.61/100
- National rank
- #8753
- State rank
- #742 of 826 in TX
Livability — Fort Worth
- Score
- 80/100
- State rank
- #49
- US rank
- #1954
Category grades
Schools grade is shown separately in the Schools card above.
Census & demographics
- Census place
- Fort Worth, TX
- County
- Tarrant County · 2,033,669 people
- City population
- 911,619
- Metro
- Dallas-Fort Worth-Arlington, TX
- Population (ZIP)
- 52,974
- Household income
- $51,267
- Rent vs Own
- Severe rent burden
- 2221.0
Population outlook (Tarrant County) Hauer SSP2
- Today (2025)
- 2,380,417 people
- By 2030
- 2,578,900 · +8.3%
- By 2040
- 2,974,995 · +25.0%
- By 2050
- 3,350,489 · +40.8%
- By 2075
- 4,216,909 · +77.2%
- By 2100
- 4,741,527 · +99.2%
Race, ethnicity, and origin ACS 2023
- Neighborhood character
- Diverse neighborhood (Simpson 0.60)
- Race & ethnicity
- Hispanic / Latino 51% Black 36% Two or more races 26% White 8% Asian 3%
- Hispanic origin (detail)
- Mexican 44%
- Foreign-born
- 25% · Canada, Philippines
- Languages at home
- 54% English-only · Spanish 42% Other Indo-European 2% Other Asian/Pacific 1%
Political lean MEDSL · Tarrant
- 2024 margin
- Lean R (+5.1) · D 46.7% · R 51.9% · Other 1.4%
- 2008→2024 swing
- +6.6pp toward D · 2008: -11.7pp · 2024: -5.1pp
- All cycles
- 2024: R+5.1 2020: D+0.2 2016: R+8.7 2012: R+15.7 2008: R+11.7
Not yet ingested
- Civics
- —
Market trends
- HPI YoY
- ▼ -23.04%
- Current HPI
- 336.7941
- Rent YoY
- ▼ -1.61%
- Metro
- Dallas-Fort Worth-Arlington, TX
- State GDP YoY
- ▲ 3.95%
- F500 in state
- 110
Industry mix (Fortune 500 HQ in TX)
| Industry | F500 HQs | Revenue |
|---|---|---|
| Energy | 16 | $1,198B |
|
||
| Technology | 5 | $198B |
|
||
| Engineering / Construction | 4 | $72B |
|
||
| Energy Services | 3 | $60B |
|
||
| Utilities | 3 | $41B |
|
||
| Healthcare | 2 | $330B |
|
||
Price history
+5.9% since first listed4 events — show timeline
- 2026-04-25 Price Changed $143,900 Zillow
- 2026-03-28 Price Changed $152,900 Zillow
- 2025-09-09 Price Changed $138,900 Zillow
- 2025-08-09 Listed $135,900 Zillow
Cash-flow waterfall
monthlySold comps — $/sqft
last 12 mo · ≤1 miLoading sold comps…