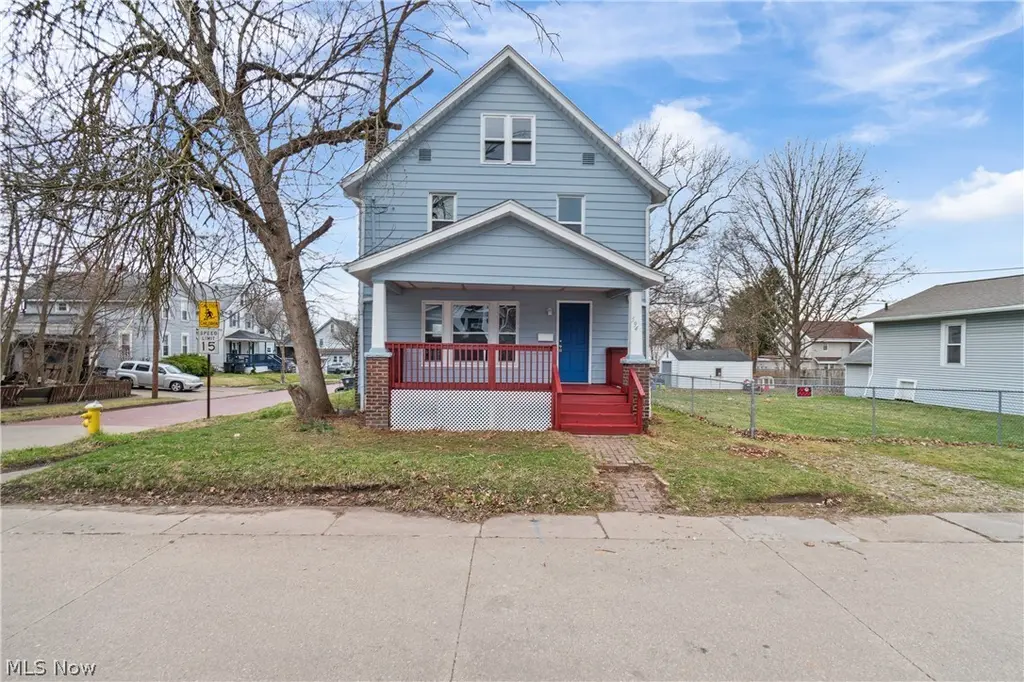
594 Columbia Ave · Akron, OH
Flood risk 1/10 · Minimal
- FEMA flood zone
- X (unshaded)
- Chance of flooding over 30 yrs
- 0.0%
- Est. flood insurance / yr
- $473 – $860
Fire risk 1/10 · Minimal
- Est. fire insurance / yr
- $713 – $1,323
Heat risk 3/10 · Minor
- Hot days now (above 97°F)
- 7 days/yr
- Hot days in 30 yrs
- 17 days/yr
Wind risk 1/10 · Minimal
- Chance of severe wind over 30 yrs
- —
Air-quality risk 3/10 · Minor
- Unhealthy air days now
- 2 days/yr
- Unhealthy air days in 30 yrs
- 4 days/yr
Risk factors via First Street. Map © Google.
Why this score? — see what drove the D grade
The composite is a weighted blend of 9 inputs, each scored 0–100. Each bar is that input's sub-score; the figure is the points it added to the 100-point composite (weight × sub-score).
- Cash flow +19.9/30.0
- DSCR +6.3/10.0
- 1% rule +5.1/10.0
- Livability +4.0/5.0
- Rent growth +3.7/5.0
- Condition / age +2.5/5.0
- Schools +2.1/10.0
- ARV discount +0.0/15.0
- Appreciation +0.0/10.0
$129,900
🖨 Deal sheet (PDF) 📄 Offer letter ✓ Due diligence
Listing remarks
Investors!! Cash flow property - section 8 occupied! Mortgage is approximately $583, and tenant pays $1300. Charming & Updated 4-Bedroom Home in North Hill! A beautifully updated home offering 4 spacious bedrooms and 1 full bathroom in a convenient Akron location. This home features recent updates throughout, including vinyl windows that provide energy efficiency and plenty of natural light. Step onto the inviting front porch, perfect for relaxing with your morning coffee or enjoying the evening breeze. Inside, you'll find a well-maintained living space with a functional layout, ideal for families or anyone looking for extra room to spread out. The basement offers plenty of storage,
Key facts
- Vinyl windows
- Front porch
- Basement storage
Tags
Property features AI
Exterior
- Parking: Driveway parking
- Utilities: Public water; Public sewer
- Home design: Frame construction; Asphalt roof; Above-grade finished area approximately 1,570
- Construction: Frame construction; Asphalt roof; Year built per assessor
- Exterior features: Driveway
Interior
- Kitchen: Range; Refrigerator
- Bathrooms: One full bathroom
- Heating & cooling: Forced-air heating; Gas heating
- Interior features: Full unfinished basement; One fireplace
Neighborhood map
What this means for you Summary
Snapshot
- This is a 4-bed/1.0-bath single-family listed at $130k.
Deal economics
- At list price, monthly cash flow is $156 ($2k/yr) — positive.
- The deal already cash-flows at list — no discount required.
- Meets the 1% rule at list price ($1k rent vs $130k).
- Recommended offer: $126k (3.0% below list) — sets the bar for market timing.
Location & tenants
- Location reads 81/100 on livability (#104 in OH, #1,591 nationally) — a professional / high-income tenant draw. Strengths: amenities A+, commute A+, cost of living A+; Watch: crime F, employment F.
- Akron City (urban): math 22% / reading 30% proficiency, ranked #602 of 656 in OH (top 92%) — low school quality limits family demand, transient renter base, plan for 1-2y turnover; 66% free/reduced lunch — lower-income household profile, screen leases tightly.
- Zoned schools: Forest Hill Community Learning Center (math 22% / reading 32%, grade F, #1,193 of 1,584 statewide, top 76%, 365 students, 0% FRL); Jennings Community Learning Center (math 12% / reading 18%, grade F, #627 of 654 statewide, top 96%, 757 students, 0% FRL); North High School (math 2% / reading 15%, grade F, #755 of 781 statewide, top 97%, 916 students, 0% FRL) — zoned schools average 0% FRL vs 66% district-wide (66 pts lower); this property's tenant base skews higher-income than the district average.
- Market conditions: Rents rising fast (+4.8%/yr); 88 active listings in the ZIP; 13 comparable units currently listed for rent nearby; rentals lingering (median 46d on market — plan ~5-8 weeks vacancy on turnover, expect pricing pressure); 62% of comp listings sitting > 30 days — soft ceiling on asking rent; lower-income renter base — watch delinquency; 1,114 units permitted in Summit County in 2024 (397 in 5+ unit buildings).
- This rent runs 38% of the median local income ($41k/yr) — at the standard rent-burdened threshold; future hikes will face affordability resistance.
Forward outlook
- Local home prices are declining (-3.0%/yr); year-one equity from $898 of loan paydown is wiped out by about $4k of value loss. Plan a longer hold.
- Summit County population projected to shrink 6% by 2050 — rents likely to lag national; underwrite the cash flow, not the appreciation.
Negotiation context
- It's been on market 40 days — a 3% lower offer ($126k) is reasonable based on typical stale-listing flexibility.
- 16 sale attempts since 10y ago with the ask held roughly flat each time — persistent listings suggest the price (not the market) is what's stuck; bring a comps-based counter.
- Current owner paid $105k; 24% above their basis — modest negotiation headroom, anchor on the comps not their cost.
Risks & watch-outs
- Watch-outs: built in 1919 — expect roof / HVAC / electrical / plumbing capex.
Questions for the listing agent
- It's been on market 40 days. Have you received any prior offers? Is the seller open to a 3% concession, seller financing, or rate buy-down credit?
- Built in 1919 — when were the roof, HVAC, electrical panel, plumbing, and water heater last replaced?
- Is there a deadline driving the sale (1031 exchange, divorce, estate, relocation)? That informs how much negotiation room exists.
- Crime grade is F in this area — have there been break-ins, vandalism, or insurance claims at this property in the last 3 years? What carrier currently insures it and at what premium?
- The area grade is low — what's the realistic commute time and amenity access for the typical tenant pool here? Any planned neighborhood developments (good or bad) we should know about?
- What's the average days-on-market for RENTAL listings here right now (not sales)? A rising rental-DOM trend means longer vacancies and softer asking-rent achievability than the comps imply.
- What's the recent tenant-quality profile in this submarket — average credit score on applications, eviction rate, late-payment / NSF rate, and stable-employment percentage? A property-management company in the area should have these aggregated.
- How much new for-sale + rental construction is in the pipeline within 1–3 miles? Heavy new supply typically softens prices + rents 12–24 months out; constrained supply supports both.
Investment metrics
- 1% rule
- 1.01% ✓
- Cap rate
- 7.73%
- Cash-on-cash
- 5.15%
- DSCR
- 1.23
- GRM
- 8.2
CMA / ARV
- ARV (median comp)
- $99,009
- List price
- $129,900
- Delta
- 31.20%
- Verdict
- OVERPRICED
- Comps
- 20 within 1.0 mi
Show comp detail 12 sales within ~0.75 mi
| Address | Dist | Beds/Ba | Sqft | Sold | Price | $/sf | Match |
|---|---|---|---|---|---|---|---|
| 468 Delmar Ave | 0.22mi | 3/1.0 (-1) | 1,601 (+2%) | 5mo | $141,000 | $88 | 77 |
| 717 Columbia Ave | 0.24mi | 3/2.5 (-1) | 1,572 (+0%) | 1mo | $163,000 | $104 | 77 |
| 307 E Glenwood Ave | 0.31mi | 4/2.0 | 1,528 (-3%) | 1mo | $65,000 | $43 | 76 |
| 482 E Tallmadge Ave | 0.39mi | 3/2.0 (-1) | 1,586 (+1%) | 4mo | $106,500 | $67 | 68 |
| 310 Ontario St | 0.29mi | 3/2.5 (-1) | 1,512 (-4%) | 5mo | $225,000 | $149 | 65 |
| 203 E York St | 0.18mi | 3/1.5 (-1) | 1,415 (-10%) | 6mo | $75,000 | $53 | 63 |
| 868 Iredell St | 0.64mi | 4/2.0 | 1,548 (-1%) | 6mo | $145,000 | $94 | 59 |
| 230 Helen Ave | 0.48mi | 4/1.5 | 1,390 (-12%) | 1mo | $154,000 | $111 | 56 |
| 749 Elma St | 0.38mi | 4/2.0 | 1,352 (-14%) | 7mo | $104,000 | $77 | 49 |
| 705 Damon St | 0.70mi | 3/2.0 (-1) | 1,486 (-5%) | 6mo | $175,000 | $118 | 44 |
| 958 Woodward Ave | 0.72mi | 3/1.5 (-1) | 1,439 (-8%) | 6mo | $115,000 | $80 | 41 |
| 523 Evans Ave | 0.63mi | 3/1.5 (-1) | 1,374 (-12%) | 6mo | $125,000 | $91 | 38 |
Match score weights: distance 35% · size 25% · config 20% · recency 20%. Top-matched comps best support the ARV.
Projected returns pro-forma
-3.0% appreciation · 4.82% rent growth · sell at horizon
- IRR
- -6.3%
- Equity multiple
- 0.76×
- Total profit
- $-8,648
- Equity at exit
- $19,369
- IRR
- 5.4%
- Equity multiple
- 1.43×
- Total profit
- $15,759
- Equity at exit
- $11,231
Cash invested: $36,372 (down + closing). Projections, not guarantees.
Landlord ↔ Tenant lean methodology
- Overall (STATE)
- 73 Landlord-Friendly
- State Ohio
- 73 Landlord-Friendly · R+6
- County
- — inherits STATE
- City
- — inherits STATE
ZIP-level market 44310
- Rents YoY
- 4.8%
- Active inventory
- 88
- Price-to-rent
- 8.2×
Monthly cashflow live
- Estimated rent
- $1,316 high interval (Pro) →
- Mortgage (P&I)
- −$681
- Tax from tax record
- −$148 /mo · $1,778/yr
- Insurance
- −$54
- HOA
- −$0
- Vacancy / Maint / Mgmt
- −$276
- Net cashflow
- $156
Break-even live
Sensitivity live
| Price | -10% $230 | -5% $193 | +0% $156 | +5% $119 | +10% $82 |
|---|---|---|---|---|---|
| Rent | -10% $52 | -5% $104 | +0% $156 | +5% $208 | +10% $260 |
| Rate | -1.0pp $221 | -0.5pp $189 | base $156 | +0.5pp $122 | +1.0pp $88 |
UW: 25.0% down · 7.5% · 30yr · 1.5% tax · 5.0% vac · 8.0% maint · 8.0% mgmt
Financing live
Cash to close
- Down payment
- $32,475
- Closing costs
- $3,897
- Reserves months
- —
- Total cash needed
- —
Loan-product check · same deal, 3 products live
Conventional
25% down · 7.5% · 30yr
- Down + closing
- —
- Monthly P&I
- —
- Monthly cashflow
- —
- DSCR
- —
- Eligible?
- —
Personal DTI + credit; lowest rate.
DSCR
20% down · 8.5% · 30yr
- Down + closing
- —
- Monthly P&I
- —
- Monthly cashflow
- —
- DSCR
- —
- Eligible?
- —
No personal income docs; deal must DSCR.
Hard money
10% down · 12.0% · 12mo
- Down + closing
- —
- Monthly P&I
- —
- Monthly cashflow
- —
- DSCR
- —
- Eligible?
- —
Short-term bridge; refi at stabilization.
Rent comps 13 comps
| Address | Beds | Baths | Sqft | Rent | $/sqft | DOM | Units | Dist |
|---|---|---|---|---|---|---|---|---|
| 265 Cranz Pl Akron, OH | 4.0 | 1.0 | 1376 | $1,300 | $0.94 | 45d | 1 | 0.11mi |
| 559 Dayton St Akron, OH | 3.0 | 1.0 | 1200 | $1,200 | $1.00 | 45d | 1 | 0.12mi |
| 570 Dayton St Akron, OH | 3.0 | 1.0 | 1140 | $1,350 | $1.18 | 16d | 1 | 0.15mi |
| 649 Patterson Ave Unit B Akron, OH | 3.0 | 1.0 | 1200 | $900 | $0.75 | 45d | 1 | 0.22mi |
| 15 W York St Akron, OH | 3.0 | 1.0 | 1178 | $1,150 | $0.98 | 23d | 1 | 0.58mi |
| 835 Carlysle St Akron, OH | 3.0 | 1.0 | 1152 | $1,250 | $1.09 | 45d | 1 | 0.83mi |
| 805 Carpenter St Akron, OH | 3.0 | 1.0 | 1056 | $1,100 | $1.04 | 25d | 1 | 0.85mi |
| 1180 Murray Ave Akron, OH | 3.0 | 2.0 | 1340 | $1,175 | $0.88 | 23d | 1 | 1.15mi |
| 248 Arch St Akron, OH | 3.0 | 1.0 | 1210 | $1,300 | $1.07 | 45d | 1 | 1.17mi |
| 240 Arch St Akron, OH | 3.0 | 1.0 | 1182 | $1,375 | $1.16 | 45d | 1 | 1.17mi |
| 207 Crosby St Akron, OH | 4.0 | 1.0 | 1200 | $1,395 | $1.16 | 45d | 1 | 1.42mi |
| 1358 N Howard St Akron, OH | 4.0 | 2.0 | 2100 | $1,800 | $0.86 | 15d | 1 | 1.45mi |
| 208 Denver St Akron, OH | 3.0 | 1.0 | 1248 | $895 | $0.72 | 45d | 1 | 1.49mi |
Listing history 50 events
-
2026-06-21days on market $129,900 Active 40 DOM
-
2026-06-18days on market $129,900 Active 37 DOM
-
2026-06-17days on market $129,900 Active 36 DOM
-
2026-06-16days on market $129,900 Active 35 DOM
-
2026-06-15days on market $129,900 Active 34 DOM
-
2026-06-14days on market $129,900 Active 32 DOM
-
2026-06-13days on market $129,900 Active 31 DOM
-
2026-06-10days on market $129,900 Active 29 DOM
-
2026-06-09days on market $129,900 Active 28 DOM
-
2026-06-08days on market $129,900 Active 27 DOM
-
2026-06-07days on market $129,900 Active 26 DOM
-
2026-06-05days on market $129,900 Active 23 DOM
-
2026-06-03days on market $129,900 Active 22 DOM
-
2026-06-02days on market $129,900 Active 21 DOM
-
2026-06-01days on market $129,900 Active 20 DOM
-
2026-05-31days on market $129,900 Active 19 DOM
-
2026-05-31days on market $129,900 Active 18 DOM
-
2026-05-12$129,900 Active 901-char remark
-
2026-02-26historical $1,295
-
2026-01-26price $1,295
-
2026-01-18price $1,350
-
2025-12-16$1,395
-
2025-12-14historical
-
2025-11-07price $112,000
-
2025-11-03$115,000 Active
-
2025-11-03historical
-
2025-10-22status Active
-
2025-10-21price $115,000
-
2025-10-16historical Contingent
-
2025-10-11$121,500 Active
-
2025-10-11historical
-
2025-10-06price $124,000
-
2025-09-23$125,000 Active
-
2025-09-23historical
-
2025-08-28status Active
-
2025-07-09historical Contingent
-
2025-07-02price $125,000
-
2025-06-24$135,000 Active
-
2025-06-23historical
-
2025-06-05price $139,900
-
2025-05-15price $141,900
-
2025-04-28price $143,900
-
2025-03-28$144,900 Active
-
2023-03-31soldstatus $105,000 Closed
-
2023-03-13soldstatus $105,000
-
2023-02-05status Pending
-
2023-01-28status Active
-
2022-12-14status Active
-
2022-12-14price $110,000
-
2022-11-01historical Contingent
ⓘ Source: listings_history table (triggers on properties + properties_extension) + one-shot
backfill from property_details.listing_events for pre-trigger history.
Tax reassessment forecast OH · Partial reset (capped growth)
- Current annual tax
- $1,778 · $148/mo
- Projected year-2 tax
- $1,902 · $159/mo
- Expected delta
- +$124/yr (+$10/mo · 7.0%)
ⓘ Screening estimate from a state-policy table — verify with the county assessor before closing.
Climate risk First Street
- Flood 1/10 Low FEMA zone X (unshaded) · 0% chance over 30 yrs
- Wildfire 1/10 Low
- Heat 3/10 Moderate 7 d/yr ≥97°F today · 17 d/yr by 30 yrs out
- Wind 1/10 Low
- Air quality 3/10 Moderate 2 unhealthy d/yr today · 4 by 30 yrs out
Nearby sold comps map
Loading sold comps map…
Walkable amenities ~0.75 mi
Loading nearby amenities…
Taxation est. · year 1
- Rental income
- $15,790
- − Mortgage interest
- −$7,276
- − Property taxes
- −$1,778
- − Insurance
- −$650
- − Repairs & maintenance
- −$1,263
- − Management
- −$1,263
- − Depreciation
- −$3,779
- Taxable loss
- −$219
- Est. tax savings @ 24.0%
- +$53
- After-tax cash flow
- $1,925/yr
For passive investors: Depreciation is non-cash, so a rental often shows a tax loss while cash-flowing — sheltering income. Rental losses are passive: they offset passive income freely, and up to $25,000/yr can offset ordinary (W-2) income if you actively participate and your MAGI is under $100k (phasing out to $0 by $150k); unused losses carry forward. On sale, claimed depreciation is recaptured at up to 25%, and gains may owe capital-gains tax (a 1031 exchange can defer both). Figures are a year-1 estimate at your 24.0% rate — not tax advice; consult a CPA.
Schools (NCES district)
- District
- Akron City
- NCES district ID
- 3904348
- Math proficiency
- 22% ▼ -17.00%
- Reading proficiency
- 30% ▼ -12.00%
- Median HH income
- $33,811
- Composite
- 21.31/100
- National rank
- #8383
- State rank
- #602 of 656 in OH
Livability — Akron
- Score
- 81/100
- State rank
- #104
- US rank
- #1591
Category grades
Schools grade is shown separately in the Schools card above.
Census & demographics
- Census place
- Akron, OH
- County
- Summit County · 440,783 people
- City population
- 174,375
- Metro
- Akron, OH
- Population (ZIP)
- 25,496
- Household income
- $41,066
- Rent vs Own
- Severe rent burden
- 2058.0
Population outlook (Summit County) Hauer SSP2
- Today (2025)
- 546,583 people
- By 2030
- 544,028 · -0.5%
- By 2040
- 531,363 · -2.8%
- By 2050
- 514,923 · -5.8%
- By 2075
- 481,765 · -11.9%
- By 2100
- 432,265 · -20.9%
Race, ethnicity, and origin ACS 2023
- Neighborhood character
- Highly diverse neighborhood (Simpson 0.73)
- Race & ethnicity
- White 40% Black 25% Asian 20% Hispanic / Latino 10% Two or more races 9%
- Hispanic origin (detail)
- Mexican 6% Puerto Rican 2%
- Common ancestry
- Romanian 2% Slovak 1% Italian 1%
- Foreign-born
- 25% · Canada, India, Philippines
- Languages at home
- 69% English-only · Other Indo-European 13% Spanish 7% Other Asian/Pacific 6%
Political lean MEDSL · Summit
- 2024 margin
- Lean D (+7.0) · D 53.0% · R 46.0%
- 2008→2024 swing
- -9.6pp toward R · 2008: 16.6pp · 2024: 7.0pp
- All cycles
- 2024: D+7.0 2020: D+9.6 2016: D+8.2 2012: D+14.8 2008: D+16.6
Not yet ingested
- Civics
- —
Market trends
- HPI YoY
- ▼ -194.41%
- Current HPI
- 203.4431
- Rent YoY
- ▲ 4.82%
- Metro
- Akron, OH
- State GDP YoY
- ▲ 1.98%
- F500 in state
- 48
Industry mix (Fortune 500 HQ in OH)
| Industry | F500 HQs | Revenue |
|---|---|---|
| Insurance | 3 | $145B |
|
||
| Industrial Machinery | 3 | $49B |
|
||
| Financial Services | 3 | $24B |
|
||
| Consumer Goods | 2 | $93B |
|
||
| Aerospace / Defense | 2 | $47B |
|
||
| Utilities | 2 | $33B |
|
||
Price history
+188.7% since first listed46 events — show timeline
- 2026-05-12 Listed $129,900 MLSNOW
- 2026-02-26 Rental Removed $1,295 RENTEC
- 2026-01-26 Price Changed $1,295 RENTEC
- 2026-01-18 Price Changed $1,350 RENTEC
- 2025-12-16 Listed for Rent $1,395 RENTEC
- 2025-12-14 Listing Removed — MLSNOW
- 2025-11-07 Price Changed $112,000 MLSNOW
- 2025-11-03 Listing Removed — MLSNOW
- 2025-11-03 Listed $115,000 MLSNOW
- 2025-10-22 Relisted — MLSNOW
- 2025-10-21 Price Changed $115,000 MLSNOW
- 2025-10-16 Contingent — MLSNOW
- 2025-10-11 Listing Removed — MLSNOW
- 2025-10-11 Listed $121,500 MLSNOW
- 2025-10-06 Price Changed $124,000 MLSNOW
- 2025-09-23 Listing Removed — MLSNOW
- 2025-09-23 Listed $125,000 MLSNOW
- 2025-08-28 Relisted — MLSNOW
- 2025-07-09 Contingent — MLSNOW
- 2025-07-02 Price Changed $125,000 MLSNOW
- 2025-06-24 Listed $135,000 MLSNOW
- 2025-06-23 Listing Removed — MLSNOW
- 2025-06-05 Price Changed $139,900 MLSNOW
- 2025-05-15 Price Changed $141,900 MLSNOW
- 2025-04-28 Price Changed $143,900 MLSNOW
- 2025-03-28 Listed $144,900 MLSNOW
- 2023-03-31 Sold (MLS) $105,000 MLSNOW
- 2023-03-13 Sold (Public Records) $105,000 Public Records
- 2023-02-05 Pending — MLSNOW
- 2023-01-28 Relisted — MLSNOW
- 2022-12-14 Relisted — MLSNOW
- 2022-12-14 Price Changed $110,000 MLSNOW
- 2022-11-01 Contingent — MLSNOW
- 2022-10-25 Price Changed $105,000 MLSNOW
- 2022-10-19 Listed $110,000 MLSNOW
- 2022-07-06 Sold (Public Records) $33,500 Public Records
- 2022-07-01 Sold (MLS) $33,500 MLSNOW
- 2022-06-13 Pending — MLSNOW
- 2022-05-27 Listed $45,000 MLSNOW
- 2018-01-19 Listing Removed — MLSNOW
- 2017-08-18 Relisted — MLSNOW
- 2017-08-08 Pending — MLSNOW
- 2017-07-20 Listed $38,000 MLSNOW
- 2017-04-24 Listing Removed — MLSNOW
- 2016-12-02 Price Changed $42,000 MLSNOW
- 2016-10-24 Listed $45,000 MLSNOW
Property tax history
+2.5%/yrLatest (2025): $1,778 · +0.1% YoY. Source: county tax records.
Cash-flow waterfall
monthlySold comps — $/sqft
last 12 mo · ≤1 miLoading sold comps…