 🔨 Auction
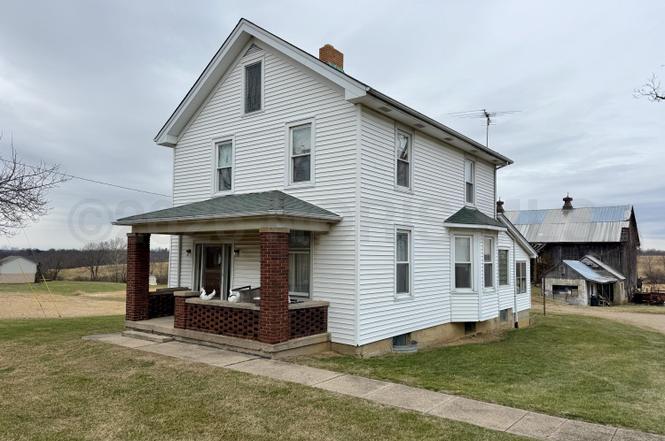
1082 Warvel Rd · Hamilton, OH
Flood risk 1/10 · Minimal
- FEMA flood zone
- X (unshaded)
- Chance of flooding over 30 yrs
- 0.0%
- Est. flood insurance / yr
- $473 – $860
Fire risk 1/10 · Minimal
- Est. fire insurance / yr
- $713 – $1,323
Heat risk 4/10 · Minor
- Hot days now (above 105°F)
- 7 days/yr
- Hot days in 30 yrs
- 19 days/yr
Wind risk 2/10 · Minimal
- Chance of severe wind over 30 yrs
- 1.0%
Air-quality risk 3/10 · Minor
- Unhealthy air days now
- 2 days/yr
- Unhealthy air days in 30 yrs
- 3 days/yr
Risk factors via First Street. Map © Google.
Why this score? — see what drove the F grade
The composite is a weighted blend of 9 inputs, each scored 0–100. Each bar is that input's sub-score; the figure is the points it added to the 100-point composite (weight × sub-score).
- ARV discount +7.5/15.0
- Schools +6.4/10.0
- Cash flow +4.6/30.0
- Livability +3.7/5.0
- Rent growth +3.4/5.0
- Condition / age +2.5/5.0
- 1% rule +0.0/10.0
- DSCR +0.0/10.0
- Appreciation +0.0/10.0
$100,000
🖨 Deal sheet (PDF) 📄 Offer letter ✓ Due diligence
Listing remarks
STARTING BID: $100,000. Land & Home Auction - February 28th, 2026, at 10:00 AM. Auction will be held live-offsite at Big Buls Roadhouse, 2461 Ross Millville Rd. , Hamilton, Ohio. Tract #4 consists of a well-maintained country home offering over 1,600 square feet of living space with 3 bedrooms and 1 bathroom, situated on 5.02 acres. The property includes a bank barn and several additional outbuildings, providing excellent utility for storage, hobby farming, or livestock. This home is selling as Tract #4 within a multi-tract land auction also offering additional acreage. An additional contiguous 160+ acres are selling at the same auction. Great location and perfect country setting! OPE
Key facts
- 5.02 acre lot
- 3 garage spots
- Built 1918
Neighborhood map
What this means for you Summary
Snapshot
- This is a 3-bed/1.0-bath single-family listed at $100k.
Deal economics
- At list price, monthly cash flow is $-1k ($-12k/yr) — negative.
- The deal already cash-flows at list — no discount required.
- Meets the 1% rule at list price ($2k rent vs $100k).
- Recommended offer: $97k (3.0% below list) — sets the bar for market timing.
- Cap rate 3.2% vs local median 5.1% in Hamilton — below-typical yield; the buyer is paying a premium for something (appreciation thesis, condition, location) that the cap rate doesn't capture.
Location & tenants
- Location reads 73/100 on livability (#332 in OH) — a middle-class / working-renter tenant base. Strengths: cost of living A+, housing A+; Watch: crime C-, amenities C-, employment D.
- Ross Local (rural): math 71% / reading 76% proficiency, ranked #95 of 656 in OH (top 14%) — strong family-tenant draw, lease renewals of 3-5y typical; only 20% free/reduced lunch — higher-income household profile.
- Zoned schools: Elda Elementary School (math 81% / reading 69%, grade A, #266 of 1,584 statewide, top 17%, 375 students, 28% FRL); Ross Middle School (math 65% / reading 75%, grade A, #136 of 654 statewide, top 22%, 726 students, 24% FRL); Ross High School (math 71% / reading 84%, grade A-, #52 of 781 statewide, top 7%, 933 students, 20% FRL) — zoned schools at 24% FRL track the district average.
- Market conditions: Rents rising (+3.7%/yr); 121 active listings in the ZIP; 2 comparable units currently listed for rent nearby; 1,163 units permitted in Butler County in 2024 (356 in 5+ unit buildings).
- This rent runs 30% of the median local income ($74k/yr) — at the standard rent-burdened threshold; future hikes will face affordability resistance.
Forward outlook
- Local home prices are declining (-3.0%/yr); year-one equity from $3k of loan paydown is wiped out by about $12k of value loss. Plan a longer hold.
Negotiation context
- It's been on market 54 days — a 3% lower offer ($97k) is reasonable based on typical stale-listing flexibility.
Risks & watch-outs
- Watch-outs: property tax is 2.9% of price; built in 1918 — expect roof / HVAC / electrical / plumbing capex.
Questions for the listing agent
- What do current leases actually rent for vs. the listed asking? Can we see a recent rent roll and the last 12 months of T-12 income?
- It's been on market 54 days. Have you received any prior offers? Is the seller open to a 3% concession, seller financing, or rate buy-down credit?
- Built in 1918 — when were the roof, HVAC, electrical panel, plumbing, and water heater last replaced?
- Property tax is high relative to price — has the assessment been appealed recently, and will the sale trigger a re-assessment?
- Is there a deadline driving the sale (1031 exchange, divorce, estate, relocation)? That informs how much negotiation room exists.
- Schools are B-rated — typically a magnet for longer-tenancy family renters. What's the average tenant stay here, and is there a school-zone premium baked into asking?
- The area grade is low — what's the realistic commute time and amenity access for the typical tenant pool here? Any planned neighborhood developments (good or bad) we should know about?
- What's the average days-on-market for RENTAL listings here right now (not sales)? A rising rental-DOM trend means longer vacancies and softer asking-rent achievability than the comps imply.
- What's the recent tenant-quality profile in this submarket — average credit score on applications, eviction rate, late-payment / NSF rate, and stable-employment percentage? A property-management company in the area should have these aggregated.
- How much new for-sale + rental construction is in the pipeline within 1–3 miles? Heavy new supply typically softens prices + rents 12–24 months out; constrained supply supports both.
Investment metrics
- 1% rule
- 0.47% ✗
- Cap rate
- 3.24%
- Cash-on-cash
- -10.92%
- DSCR
- 0.51
- GRM
- 17.6
CMA / ARV
- ARV (on-the-fly)
- $394,584
- Comps found
- 1
Show comp detail 1 sale within ~0.75 mi
| Address | Dist | Beds/Ba | Sqft | Sold | Price | $/sf | Match |
|---|---|---|---|---|---|---|---|
| 1082 Warvel Rd | 0.00mi | 3/1.0 | 1,604 (0%) | 0mo | $395,000 | $246 | 100 |
Match score weights: distance 35% · size 25% · config 20% · recency 20%. Top-matched comps best support the ARV.
Projected returns pro-forma
-3.0% appreciation · 3.69% rent growth · sell at horizon
- IRR
- -35.6%
- Equity multiple
- -0.15×
- Total profit
- $-126,795
- Equity at exit
- $58,834
- IRR
- -44.6%
- Equity multiple
- -0.70×
- Total profit
- $-187,944
- Equity at exit
- $34,116
Cash invested: $110,484 (down + closing). Projections, not guarantees.
Landlord ↔ Tenant lean methodology
- Overall (STATE)
- 73 Landlord-Friendly
- State Ohio
- 73 Landlord-Friendly · R+6
- County
- — inherits STATE
- City
- — inherits STATE
ZIP-level market 45013
- Rents YoY
- 3.7%
- Active inventory
- 121
- Price-to-rent
- 4.5×
Monthly cashflow live
- Estimated rent
- $1,865 medium interval (Pro) →
- Mortgage (P&I)
- −$2,069
- Tax from tax record
- −$245 /mo · $2,944/yr
- Insurance
- −$164
- HOA
- −$0
- Vacancy / Maint / Mgmt
- −$392
- Net cashflow
- $-1,005
Break-even live
Sensitivity live
| Price | -10% $-782 | -5% $-894 | +0% $-1,005 | +5% $-1,117 | +10% $-1,229 |
|---|---|---|---|---|---|
| Rent | -10% $-1,153 | -5% $-1,079 | +0% $-1,005 | +5% $-932 | +10% $-858 |
| Rate | -1.0pp $-807 | -0.5pp $-905 | base $-1,005 | +0.5pp $-1,108 | +1.0pp $-1,212 |
UW: 25.0% down · 7.5% · 30yr · 1.5% tax · 5.0% vac · 8.0% maint · 8.0% mgmt
Financing live
Cash to close
- Down payment
- $98,646
- Closing costs
- $11,838
- Reserves months
- —
- Total cash needed
- —
Loan-product check · same deal, 3 products live
Conventional
25% down · 7.5% · 30yr
- Down + closing
- —
- Monthly P&I
- —
- Monthly cashflow
- —
- DSCR
- —
- Eligible?
- —
Personal DTI + credit; lowest rate.
DSCR
20% down · 8.5% · 30yr
- Down + closing
- —
- Monthly P&I
- —
- Monthly cashflow
- —
- DSCR
- —
- Eligible?
- —
No personal income docs; deal must DSCR.
Hard money
10% down · 12.0% · 12mo
- Down + closing
- —
- Monthly P&I
- —
- Monthly cashflow
- —
- DSCR
- —
- Eligible?
- —
Short-term bridge; refi at stabilization.
Rent comps 2 comps
| Address | Beds | Baths | Sqft | Rent | $/sqft | DOM | Units | Dist |
|---|---|---|---|---|---|---|---|---|
| 1024 Golfview Dr Hamilton, OH | 4.0 | 2.5 | 1722 | $2,025 | $1.18 | 3d | 1 | 1.14mi |
| 794 Carriage Hill Ln Hamilton, OH | 4.0 | 2.5 | 1646 | $1,895 | $1.15 | 3d | 1 | 1.24mi |
Listing history 3 events
-
2026-04-03status Pending
-
2026-02-08$100,000 Active
-
2026-01-27historical $100,000
ⓘ Source: listings_history table (triggers on properties + properties_extension) + one-shot
backfill from property_details.listing_events for pre-trigger history.
Tax reassessment forecast OH · Partial reset (capped growth)
- Current annual tax
- $2,944 · $245/mo
- Projected year-2 tax
- $2,944 · $245/mo
- Expected delta
- $0/yr ($0/mo · 0.0%)
ⓘ Screening estimate from a state-policy table — verify with the county assessor before closing.
Climate risk First Street
- Flood 1/10 Low FEMA zone X (unshaded) · 0% chance over 30 yrs
- Wildfire 1/10 Low
- Heat 4/10 Moderate 7 d/yr ≥105°F today · 19 d/yr by 30 yrs out
- Wind 2/10 Low 100% chance of damaging wind over 30 yrs
- Air quality 3/10 Moderate 2 unhealthy d/yr today · 3 by 30 yrs out
Nearby sold comps map
Loading sold comps map…
Walkable amenities ~0.75 mi
Loading nearby amenities…
Taxation est. · year 1
- Rental income
- $22,384
- − Mortgage interest
- −$22,103
- − Property taxes
- −$2,944
- − Insurance
- −$1,973
- − Repairs & maintenance
- −$1,791
- − Management
- −$1,791
- − Depreciation
- −$11,479
- Taxable loss
- −$19,696
- Est. tax savings @ 24.0%
- +$4,727
- After-tax cash flow
- $-7,338/yr
For passive investors: Depreciation is non-cash, so a rental often shows a tax loss while cash-flowing — sheltering income. Rental losses are passive: they offset passive income freely, and up to $25,000/yr can offset ordinary (W-2) income if you actively participate and your MAGI is under $100k (phasing out to $0 by $150k); unused losses carry forward. On sale, claimed depreciation is recaptured at up to 25%, and gains may owe capital-gains tax (a 1031 exchange can defer both). Figures are a year-1 estimate at your 24.0% rate — not tax advice; consult a CPA.
Schools (NCES district)
- District
- Ross Local
- NCES district ID
- 3904614
- Math proficiency
- 71% ▼ -9.00%
- Reading proficiency
- 76% ▼ -3.00%
- Median HH income
- $70,035
- Composite
- 64.17/100
- National rank
- #567
- State rank
- #95 of 656 in OH
Livability — Hamilton
- Score
- 73/100
- State rank
- #332
- US rank
- #5467
Category grades
Schools grade is shown separately in the Schools card above.
Census & demographics
- County
- Butler County · 381,674 people
- City population
- 140,900
- Metro
- Cincinnati, OH-KY-IN
- Population (ZIP)
- 53,998
- Household income
- $73,633
- Rent vs Own
- Severe rent burden
- 1047.0
Population outlook (Butler County) Hauer SSP2
- Today (2025)
- 387,706 people
- By 2030
- 392,028 · +1.1%
- By 2040
- 395,307 · +2.0%
- By 2050
- 391,116 · +0.9%
- By 2075
- 378,642 · -2.3%
- By 2100
- 343,248 · -11.5%
Race, ethnicity, and origin ACS 2023
- Neighborhood character
- Predominantly White (88%)
- Race & ethnicity
- White 88% Two or more races 6% Hispanic / Latino 4% Black 3%
- Common ancestry
- Lithuanian 2% Romanian 2% Slovak 2%
- Foreign-born
- 2% · Canada
- Languages at home
- 97% English-only · Spanish 2%
Political lean MEDSL · Butler
- 2024 margin
- Strong R (+26.3) · D 36.4% · R 62.7%
- 2008→2024 swing
- -3.6pp toward R · 2008: -22.6pp · 2024: -26.3pp
- All cycles
- 2024: R+26.3 2020: R+24.0 2016: R+28.3 2012: R+26.2 2008: R+22.6
Not yet ingested
- Civics
- —
Market trends
- HPI YoY
- ▼ -210.85%
- Current HPI
- 237.0239
- Rent YoY
- ▲ 3.69%
- Metro
- Cincinnati, OH-KY-IN
- State GDP YoY
- ▲ 1.98%
- F500 in state
- 48
Industry mix (Fortune 500 HQ in OH)
| Industry | F500 HQs | Revenue |
|---|---|---|
| Insurance | 3 | $145B |
|
||
| Industrial Machinery | 3 | $49B |
|
||
| Financial Services | 3 | $24B |
|
||
| Consumer Goods | 2 | $93B |
|
||
| Aerospace / Defense | 2 | $47B |
|
||
| Utilities | 2 | $33B |
|
||
Price history
+0.0% since first listed3 events — show timeline
- 2026-04-03 Pending — NORIS
- 2026-02-08 Listed $100,000 NORIS
- 2026-01-27 Coming Soon $100,000 NORIS
Property tax history
+18.5%/yrLatest (2025): $2,944 · +18.5% YoY. Source: county tax records.
Cash-flow waterfall
monthlySold comps — $/sqft
last 12 mo · ≤1 miLoading sold comps…