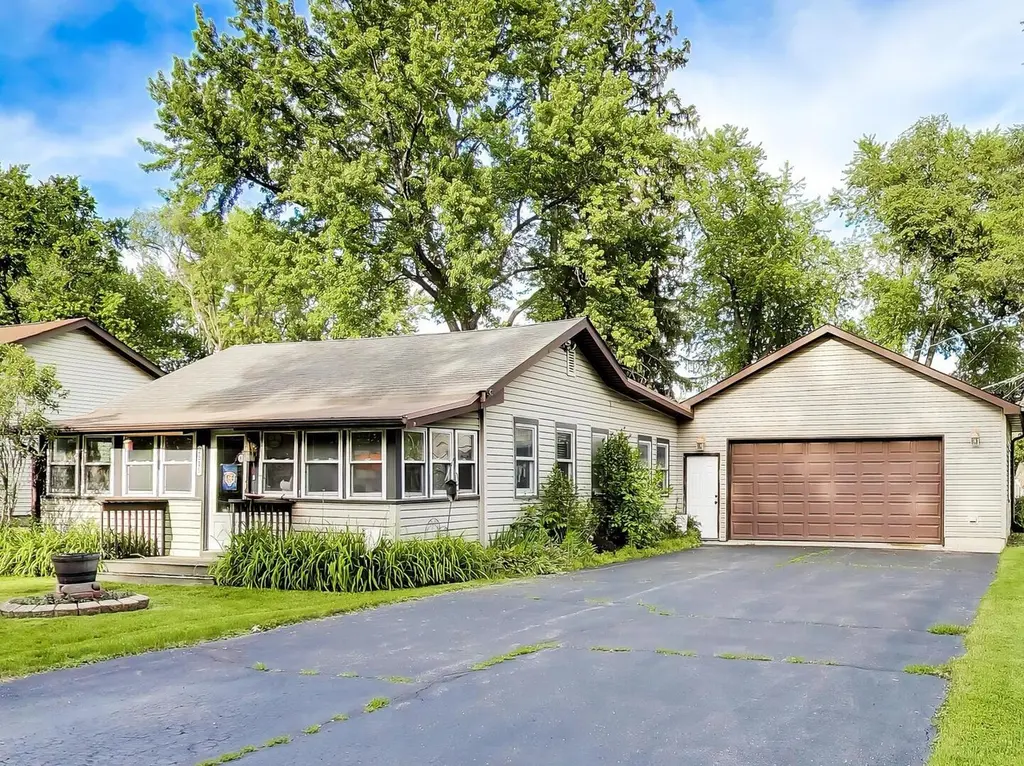
2516 Bittersweet Ave · Holiday Hills, IL
Flood risk 1/10 · Minimal
- FEMA flood zone
- X (unshaded)
- Chance of flooding over 30 yrs
- 0.0%
- Est. flood insurance / yr
- $507 – $1,088
Fire risk 2/10 · Minimal
- Est. fire insurance / yr
- $804 – $1,492
Heat risk 2/10 · Minimal
- Hot days now (above 100°F)
- 7 days/yr
- Hot days in 30 yrs
- 14 days/yr
Wind risk 2/10 · Minimal
- Chance of severe wind over 30 yrs
- —
Air-quality risk 2/10 · Minimal
- Unhealthy air days now
- 1 days/yr
- Unhealthy air days in 30 yrs
- 2 days/yr
Risk factors via First Street. Map © Google.
Why this score? — see what drove the C grade
The composite is a weighted blend of 9 inputs, each scored 0–100. Each bar is that input's sub-score; the figure is the points it added to the 100-point composite (weight × sub-score).
- ARV discount +15.0/15.0
- Cash flow +14.5/30.0
- Appreciation +10.0/10.0
- DSCR +4.4/10.0
- 1% rule +4.0/10.0
- Livability +3.1/5.0
- Schools +2.7/10.0
- Rent growth +2.5/5.0
- Condition / age +2.5/5.0
$219,000
🖨 Deal sheet 📄 Offer letter ✓ Due diligence
Listing remarks
Being sold as an Estate Sale/Property AS iS!! This charming 2 bedroom, one bath home is perhaps what you've been looking for as a primary resident or as a weekend get-away. The over-sized garage is perfect for any auto enthusiast and someone who would love a workshop. Situated on a quiet tree-lined street, this house has such potential with a bit of TLC. From the front porch, one can see the lake views of Griswold Lake a block away. A large kitchen and a separate living room and dining room allows for a lot of living space. Outside is an ample yard, just waiting for your lounge chairs and fire pit! Since this is an estate sale, many of the items can be left in the house and garage, if you d
Key facts
- Lake views
- Over-sized garage
- Large kitchen
Tags
Property features AI
Finance
- Other: Tax exemptions: Homeowner
- HOA & community: Annual association fee of $100 (includes other items)
Exterior
- Parking: Attached garage (heated), garage owned; Asphalt driveway; Two parking spaces / two garage spaces
- Utilities: Well water; Septic tank sewer; 60 amp electric service
- Home design: Detached single-family home; One-story; Fee simple ownership; Custom model; Built before 1978
- Construction: Shake siding; Crawl space basement
- Exterior features: Lot dimensions approximately 84 x 125 x 50 x 100; Less than 0.25 acre lot; School bus service; Water rights (community feature)
Interior
- Kitchen: Kitchen with eating area/table space (about 12 x 11); Range; Refrigerator
- Bedrooms: Two bedrooms (both on main level); Bedroom 2 approximately 10 x 8; Master bedroom approximately 11 x 8
- Flooring: Plank flooring in enclosed porch; Carpet in living room and bedrooms; Vinyl in kitchen
- Bathrooms: One full bathroom
- Heating & cooling: Natural gas forced air heating
- Interior features: Five total rooms; Enclosed porch (23 x 7)
- Laundry & utility: In-unit laundry; Washer; Dryer
Neighborhood map
What this means for you Summary
Snapshot
- This is a 2-bed/1.0-bath single-family listed at $219k.
Deal economics
- At list price, monthly cash flow is $48 ($573/yr) — positive.
- The deal already cash-flows at list — no discount required.
- To meet the 1% rule (rent ≥ 1% of price), the offer needs to be $198k (9.8% below list).
- Recommended offer: $198k (9.8% below list) — sets the bar for 1% rule.
Location & tenants
- Location reads 61/100 on livability (#892 in IL) — a middle-class / working-renter tenant base. Strengths: housing A+, employment A-, cost of living A-; Watch: schools F, amenities F, commute F.
- Mchenry Chsd 156 (suburban): math 27% / reading 30% proficiency, ranked #244 of 620 in IL (top 39%) — low school quality limits family demand, transient renter base, plan for 1-2y turnover.
- Market conditions: 152 active listings in the ZIP; 1 comparable units currently listed for rent nearby; 1,595 units permitted in McHenry County in 2024 (485 in 5+ unit buildings).
Forward outlook
- In year one you build about $23k of equity ($2k loan paydown + $22k appreciation (10.0% local appreciation)).
- McHenry County population projected at -12% by 2050 — secular population decline; favor cash flow + early exit over multi-decade hold.
- At projected returns (10.0% appreciation + 3.0% rent growth), your $61k cash investment doubles in ~3 years — after that, you're playing with house money.
- By year 2, paydown + projected appreciation supports a ~$38k cash-out refi (75% LTV) — recoverable capital for the next deal without selling this one.
Negotiation context
- Only 14 days on market — expect competitive offers; lowballing is unlikely to land.
- Current owner paid $110k; list at $219k implies a 99% gain — meaningful room to come down on a strong offer.
Risks & watch-outs
- Watch-outs: built in 1920 — expect roof / HVAC / electrical / plumbing capex.
Questions for the listing agent
- Built in 1920 — when were the roof, HVAC, electrical panel, plumbing, and water heater last replaced?
- What does the HOA fee cover, when was the last increase, and are there any pending special assessments or reserve-fund shortfalls?
- Is there a deadline driving the sale (1031 exchange, divorce, estate, relocation)? That informs how much negotiation room exists.
- Schools are F-rated, which usually means shorter tenancies and higher turnover. Who's the typical renter profile here, and what's been the actual vacancy rate?
- What's the average days-on-market for RENTAL listings here right now (not sales)? A rising rental-DOM trend means longer vacancies and softer asking-rent achievability than the comps imply.
- What's the recent tenant-quality profile in this submarket — average credit score on applications, eviction rate, late-payment / NSF rate, and stable-employment percentage? A property-management company in the area should have these aggregated.
- How much new for-sale + rental construction is in the pipeline within 1–3 miles? Heavy new supply typically softens prices + rents 12–24 months out; constrained supply supports both.
Investment metrics
- 1% rule
- 0.90% ✗
- Cap rate
- 6.55%
- Cash-on-cash
- 0.93%
- DSCR
- 1.04
- GRM
- 9.2
CMA / ARV
- ARV (on-the-fly)
- $262,944
- Comps found
- 12
Show comp detail 12 sales within ~0.75 mi
| Address | Dist | Beds/Ba | Sqft | Sold | Price | $/sf | Match |
|---|---|---|---|---|---|---|---|
| 2408 Driftwood Dr | 0.18mi | 3/1.0 (+1) | 1,040 (-2%) | 10mo | $167,000 | $161 | 76 |
| 2510 S Birchwood Ave | 0.08mi | 3/1.5 (+1) | 1,134 (+7%) | 3mo | $287,000 | $253 | 74 |
| 2509 S Birchwood Ave | 0.05mi | 3/1.5 (+1) | 1,153 (+9%) | 4mo | $287,000 | $249 | 73 |
| 2809 Tower Dr | 0.31mi | 3/1.5 (+1) | 1,008 (-4%) | 13mo | $285,000 | $283 | 60 |
| 2505 S Harriet Ln | 0.41mi | 3/2.0 (+1) | 1,100 (+4%) | 12mo | $310,000 | $282 | 55 |
| 3203 S Bergman Dr | 0.65mi | 3/1.0 (+1) | 1,110 (+5%) | 2mo | $163,000 | $147 | 54 |
| 3108 S Waterview Ave | 0.58mi | 3/1.0 (+1) | 1,060 (+0%) | 17mo | $195,000 | $184 | 54 |
| 1006 W Wood St | 0.69mi | 3/2.0 (+1) | 1,059 (+0%) | 9mo | $280,500 | $265 | 51 |
| 1506 W Pine St | 0.24mi | 3/2.0 (+1) | 1,124 (+6%) | 22mo | $300,000 | $267 | 51 |
| 2602 Holiday Dr | 0.31mi | 3/2.0 (+1) | 1,158 (+10%) | 19mo | $235,000 | $203 | 45 |
| 1512 Catalpa Dr | 0.45mi | 3/1.0 (+1) | 936 (-11%) | 22mo | $230,000 | $246 | 37 |
| 2605 Highwood Rd | 0.67mi | 3/1.0 (+1) | 965 (-9%) | 18mo | $230,000 | $238 | 34 |
Match score weights: distance 35% · size 25% · config 20% · recency 20%. Top-matched comps best support the ARV.
Projected returns pro-forma
10.0% appreciation · 3.0% rent growth · sell at horizon
- IRR
- 25.0%
- Equity multiple
- 3.00×
- Total profit
- $122,341
- Equity at exit
- $197,293
- IRR
- 22.0%
- Equity multiple
- 6.84×
- Total profit
- $357,944
- Equity at exit
- $425,469
Cash invested: $61,320 (down + closing). Projections, not guarantees.
Landlord ↔ Tenant lean methodology
- Overall (STATE)
- 43 Moderately Tenant-Leaning
- State Illinois
- 43 Moderately Tenant-Leaning · D+7
- County
- — inherits STATE
- City
- — inherits STATE
ZIP-level market 60051
- Home prices YoY
- 4.9%
- Active inventory
- 152
- Price-to-rent
- 9.2×
Monthly cashflow live
- Estimated rent
- $1,975 medium interval (Pro) →
- Mortgage (P&I)
- −$1,148
- Tax from tax record
- −$265 /mo · $3,178/yr
- Insurance
- −$91
- HOA
- −$8
- Vacancy / Maint / Mgmt
- −$415
- Net cashflow
- $48
Break-even live
UW: 25.0% down · 7.5% · 30yr · 1.5% tax · 5.0% vac · 8.0% maint · 8.0% mgmt
Financing live
Cash to close
- Down payment
- $54,750
- Closing costs
- $6,570
- Reserves months
- —
- Total cash needed
- —
Loan-product check · same deal, 3 products live
Conventional
25% down · 7.5% · 30yr
- Down + closing
- —
- Monthly P&I
- —
- Monthly cashflow
- —
- DSCR
- —
- Eligible?
- —
Personal DTI + credit; lowest rate.
DSCR
20% down · 8.5% · 30yr
- Down + closing
- —
- Monthly P&I
- —
- Monthly cashflow
- —
- DSCR
- —
- Eligible?
- —
No personal income docs; deal must DSCR.
Hard money
10% down · 12.0% · 12mo
- Down + closing
- —
- Monthly P&I
- —
- Monthly cashflow
- —
- DSCR
- —
- Eligible?
- —
Short-term bridge; refi at stabilization.
Rent comps 1 comps
| Address | Beds | Baths | Sqft | Rent | $/sqft | DOM | Units | Dist |
|---|---|---|---|---|---|---|---|---|
| 3416 Greenwich Ln Island Lake, IL | 3.0 | 1.5 | 1309 | $1,975 | $1.51 | 20d | 1 | 0.79mi |
HOA detail
- Monthly dues
- $8 · $96/yr
Listing history 12 events
-
2026-06-17status $219,000 Pending 14 DOM
-
2026-06-17days on market $219,000 Contingent - No Showings 14 DOM
-
2026-06-16days on market $219,000 Contingent - No Showings 13 DOM
-
2026-06-15days on market $219,000 Contingent - No Showings 12 DOM
-
2026-06-13days on market $219,000 Contingent - No Showings 10 DOM
-
2026-06-13days on market $219,000 Contingent - No Showings 9 DOM
-
2026-06-10status $219,000 Contingent - No Showings 6 DOM
-
2026-06-09days on market $219,000 Active 6 DOM
-
2026-06-08days on market $219,000 Active 5 DOM
-
2026-06-07days on market $219,000 Active 4 DOM
-
2026-06-04remarks 699-char remark
-
2026-06-04$219,000 Active 1 DOM
ⓘ Source: listings_history table (triggers on properties + properties_extension) + one-shot
backfill from property_details.listing_events for pre-trigger history.
Tax reassessment forecast IL · Partial reset (capped growth)
- Current annual tax
- $3,178 · $265/mo
- Projected year-2 tax
- $4,075 · $340/mo
- Expected delta
- +$897/yr (+$75/mo · 28.2%)
ⓘ Screening estimate from a state-policy table — verify with the county assessor before closing.
Climate risk First Street
- Flood 1/10 Low FEMA zone X (unshaded) · 0% chance over 30 yrs
- Wildfire 2/10 Low
- Heat 2/10 Low 7 d/yr ≥100°F today · 14 d/yr by 30 yrs out
- Wind 2/10 Low
- Air quality 2/10 Low 1 unhealthy d/yr today · 2 by 30 yrs out
Nearby sold comps map
Loading sold comps map…
Walkable amenities ~0.75 mi
Loading nearby amenities…
Taxation est. · year 1
- Rental income
- $23,700
- − Mortgage interest
- −$12,267
- − Property taxes
- −$3,178
- − Insurance
- −$1,095
- − Repairs & maintenance
- −$1,896
- − Management
- −$1,896
- − HOA
- −$96
- − Depreciation
- −$6,371
- Taxable loss
- −$3,099
- Est. tax savings @ 24.0%
- +$744
- After-tax cash flow
- $1,316/yr
For passive investors: Depreciation is non-cash, so a rental often shows a tax loss while cash-flowing — sheltering income. Rental losses are passive: they offset passive income freely, and up to $25,000/yr can offset ordinary (W-2) income if you actively participate and your MAGI is under $100k (phasing out to $0 by $150k); unused losses carry forward. On sale, claimed depreciation is recaptured at up to 25%, and gains may owe capital-gains tax (a 1031 exchange can defer both). Figures are a year-1 estimate at your 24.0% rate — not tax advice; consult a CPA.
Schools (NCES district)
- District
- Mchenry Chsd 156
- NCES district ID
- 1725320
- Math proficiency
- 27% ▼ -7.00%
- Reading proficiency
- 30% ▼ -7.00%
- Median HH income
- $66,681
- Composite
- 26.55/100
- National rank
- #7188
- State rank
- #244 of 620 in IL
Livability — Holiday Hills
- Score
- 61/100
- State rank
- #892
- US rank
- #17393
Category grades
Schools grade is shown separately in the Schools card above.
Census & demographics
- Population (ZIP)
- 23,931
Population outlook (McHenry County) Hauer SSP2
- Today (2025)
- 305,342 people
- By 2030
- 301,491 · -1.3%
- By 2040
- 288,211 · -5.6%
- By 2050
- 268,430 · -12.1%
- By 2075
- 226,209 · -25.9%
- By 2100
- 181,247 · -40.6%
Race, ethnicity, and origin ACS 2023
- Neighborhood character
- Predominantly White (84%)
- Race & ethnicity
- White 84% Hispanic / Latino 10% Two or more races 6% Asian 2%
- Hispanic origin (detail)
- Mexican 8%
- Common ancestry
- Romanian 12% Slovak 2% Lithuanian 2%
- Foreign-born
- 5% · Canada
- Languages at home
- 92% English-only · Spanish 5% Other Indo-European 2% Russian/Polish/Slavic 1%
Political lean MEDSL · McHenry
- 2024 margin
- Lean R (+5.3) · D 46.6% · R 51.9% · Other 1.5%
- 2008→2024 swing
- -10.6pp toward R · 2008: 5.3pp · 2024: -5.3pp
- All cycles
- 2024: R+5.3 2020: R+2.5 2016: R+8.1 2012: R+8.8 2008: D+5.3
Not yet ingested
- Civics
- —
Market trends
- HPI YoY
- ▲ 28.50%
- Current HPI
- 612.07
- Rent YoY
- —
- Metro
- —
- State GDP YoY
- ▲ 1.59%
- F500 in state
- 60
Industry mix (Fortune 500 HQ in IL)
| Industry | F500 HQs | Revenue |
|---|---|---|
| Insurance | 4 | $201B |
|
||
| Consumer Goods | 4 | $87B |
|
||
| Industrial Machinery | 3 | $64B |
|
||
| Healthcare | 2 | $55B |
|
||
| Retail / Pharmacy | 1 | $148B |
|
||
| Agriculture / Food | 1 | $86B |
|
||
Price history
+274.4% since first listed3 events — show timeline
- 2026-06-03 Listed $219,000 MRED as Distributed by MLS Grid
- 2001-08-13 Sold (Public Records) $110,000 Public Records
- 2000-05-12 Sold (Public Records) $58,500 Public Records
Property tax history
+3.8%/yrLatest (2024): $3,178 · +4.5% YoY. Source: county tax records.
Cash-flow waterfall
monthlySold comps — $/sqft
last 12 mo · ≤1 miLoading sold comps…