 🏗️ New Construction
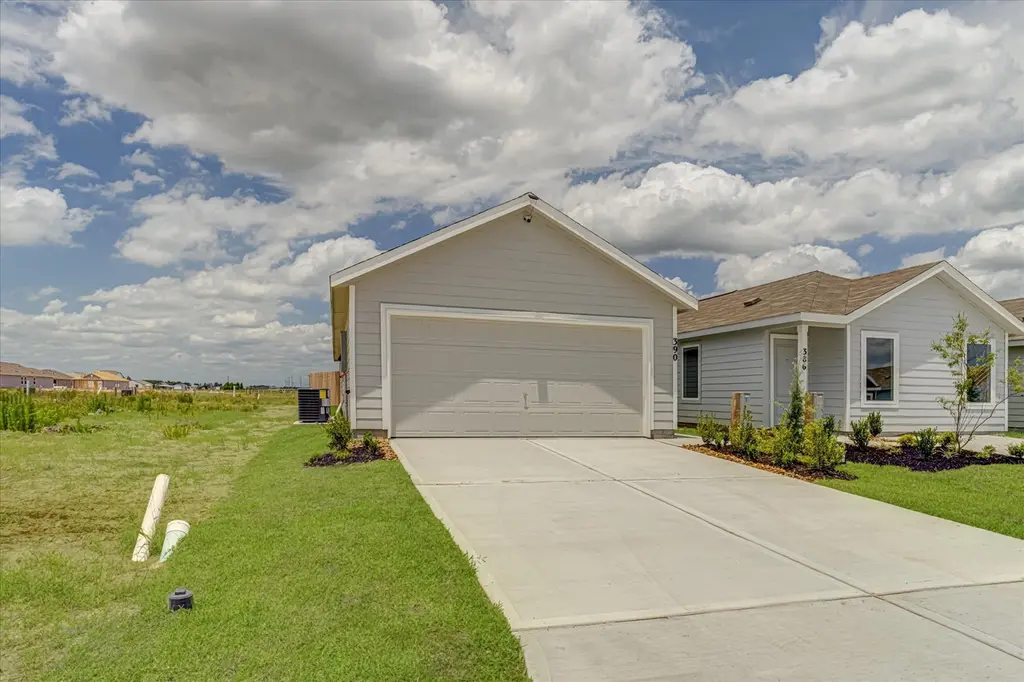
390 Lucia Way · Cleveland, TX
Flood risk No data
- FEMA flood zone
- —
- Chance of flooding over 30 yrs
- —
- Est. flood insurance / yr
- —
Fire risk No data
- Est. fire insurance / yr
- —
Heat risk No data
- Hot days now (above threshold)
- —
- Hot days in 30 yrs
- —
Wind risk No data
- Chance of severe wind over 30 yrs
- —
Air-quality risk No data
- Unhealthy air days now
- —
- Unhealthy air days in 30 yrs
- —
Risk factors via First Street. Map © Google.
Why this score? — see what drove the D+ grade
The composite is a weighted blend of 9 inputs, each scored 0–100. Each bar is that input's sub-score; the figure is the points it added to the 100-point composite (weight × sub-score).
- Cash flow +18.7/30.0
- ARV discount +7.5/15.0
- DSCR +5.9/10.0
- 1% rule +5.1/10.0
- Condition / age +4.2/5.0
- Rent growth +3.5/5.0
- Livability +3.1/5.0
- Schools +2.1/10.0
- Appreciation +0.0/10.0
$149,999
🖨 Deal sheet 📄 Offer letter ✓ Due diligence
Listing remarks MLS
NEW in the Santa Fe Village Community! Lennar Crestmore Collection "Whiles" Plan with Elevation "B". This new single-level home boasts a modern, low-maintenance layout. An inviting open-concept layout can be found off the entry, combining the kitchen, living and dining areas to simplify everyday multitasking. Three bedrooms are tucked away at the back of the home, including the luxurious owner’s suite with a generous walk-in closet and en-suite bathroom.
Key facts
- 2 garage spots
- Built 2025
- Listed 19 days
Property features AI
Finance
- Financial info: Lease considered
- HOA & community: Houston El Norte Property Association; Annual association fee of $120
Exterior
- Parking: Attached garage (2 spaces)
- Utilities: Public water; Public sewer
- Home design: Residential property; New construction (2025); Slab foundation
- Construction: Built by Lennar; Cement siding; Composition roof; Slab foundation
- Exterior features: Fully fenced private yard; Back yard fencing
Interior
- Kitchen: Dishwasher; Disposal; Gas range; Microwave; ENERGY STAR qualified appliances
- Bedrooms: Primary bedroom on the first floor (14 x 11); Bedroom on the first floor (10 x 10); Bedroom on the first floor (10 x 10)
- Flooring: Carpet; Tile
- Bathrooms: 2 full bathrooms
- Heating & cooling: Central heating (electric); Central air (gas)
- Interior features: Quartz counters; Walk-in pantry; Ceiling fans; Kitchen/dining combo
- Laundry & utility: Washer hookup; Electric dryer hookup; Gas dryer hookup
Neighborhood map
What this means for you Summary
Snapshot
- This is a 3-bed/2.0-bath single-family listed at $150k. Condition is rated good.
Deal economics
- At list price, monthly cash flow is $154 ($2k/yr) — positive.
- The deal already cash-flows at list — no discount required.
- Meets the 1% rule at list price ($2k rent vs $150k).
- Recommended offer: $148k (1.5% below list) — sets the bar for market timing.
- Cap rate 7.5% vs local median 4.7% in Cleveland — top-decile yield for the area; either an underpriced asset or a hidden risk that comps aren't pricing in. Stress-test before assuming the spread holds.
Location & tenants
- Location reads 61/100 on livability (#1,013 in TX) — a middle-class / working-renter tenant base. Strengths: cost of living A+, housing A+; Watch: crime D-, amenities F, commute F.
- Cleveland ISD (town): math 24% / reading 25% proficiency, ranked #723 of 826 in TX (top 88%) — low school quality limits family demand, transient renter base, plan for 1-2y turnover; 71% free/reduced lunch — lower-income household profile, screen leases tightly.
- Zoned schools: Southside El (math 17% / reading 20%, grade F, #3,759 of 4,322 statewide, top 88%, 905 students, 95% FRL); Cleveland Middle (math 22% / reading 25%, grade F, #1,317 of 1,662 statewide, top 80%, 1,696 students, 98% FRL); Cleveland H S (math 30% / reading 32%, grade F, #1,077 of 1,632 statewide, top 66%, 3,310 students, 92% FRL) — zoned schools average 95% FRL vs 71% district-wide (24 pts higher); higher-poverty schools than district average — tighter screening recommended.
- Market conditions: Rents rising fast (+4.0%/yr); 1574 active listings in the ZIP; 7 comparable units currently listed for rent nearby; rentals leasing fast (median 7d on market — plan ~1-2 weeks tenant-placement turnaround); 1,321 units permitted in Liberty County in 2024 (0 in 5+ unit buildings).
- This rent runs 31% of the median local income ($62k/yr) — at the standard rent-burdened threshold; future hikes will face affordability resistance.
Forward outlook
- Local home prices are declining (-3.0%/yr); year-one equity from $1k of loan paydown is wiped out by about $5k of value loss. Plan a longer hold.
- Liberty County population projected at +24% by 2050 — long-run rental-demand tailwind backs the buy-and-hold thesis.
Negotiation context
- It's been on market 20 days — a 2% lower offer ($148k) is reasonable based on typical stale-listing flexibility.
- 2 sale attempts with the ask held roughly flat each time — persistent listings suggest the price (not the market) is what's stuck; bring a comps-based counter.
Questions for the listing agent
- What does the HOA fee cover, when was the last increase, and are there any pending special assessments or reserve-fund shortfalls?
- Is there a deadline driving the sale (1031 exchange, divorce, estate, relocation)? That informs how much negotiation room exists.
- Schools are F-rated, which usually means shorter tenancies and higher turnover. Who's the typical renter profile here, and what's been the actual vacancy rate?
- Crime grade is D in this area — have there been break-ins, vandalism, or insurance claims at this property in the last 3 years? What carrier currently insures it and at what premium?
- The area grade is low — what's the realistic commute time and amenity access for the typical tenant pool here? Any planned neighborhood developments (good or bad) we should know about?
- What's the average days-on-market for RENTAL listings here right now (not sales)? A rising rental-DOM trend means longer vacancies and softer asking-rent achievability than the comps imply.
- What's the recent tenant-quality profile in this submarket — average credit score on applications, eviction rate, late-payment / NSF rate, and stable-employment percentage? A property-management company in the area should have these aggregated.
- How much new for-sale + rental construction is in the pipeline within 1–3 miles? Heavy new supply typically softens prices + rents 12–24 months out; constrained supply supports both.
Investment metrics
- 1% rule
- 1.01% ✓
- Cap rate
- 7.47%
- Cash-on-cash
- 4.21%
- DSCR
- 1.19
- GRM
- 8.3
CMA / ARV
- ARV (on-the-fly)
- $157,040
- Comps found
- 12
Show comp detail 12 sales within ~0.75 mi
| Address | Dist | Beds/Ba | Sqft | Sold | Price | $/sf | Match |
|---|---|---|---|---|---|---|---|
| 390 Lucia Way | 0.00mi | 3/2.0 | 1,208 (0%) | 1mo | $172,990 | $143 | 99 |
| 386 Lucia Way | 0.00mi | 3/2.0 | 1,192 (-1%) | 1mo | $163,990 | $138 | 97 |
| 678 Maria Elena Way | 0.00mi | 3/2.0 | 1,266 (+5%) | 2mo | $178,990 | $141 | 91 |
| 803 Hays St | 0.33mi | 3/2.0 | 1,200 (-1%) | 6mo | $125,000 | $104 | 79 |
| 393 Lucia Way | 0.00mi | 4/2.0 (+1) | 1,375 (+14%) | 1mo | $170,990 | $124 | 71 |
| 405 Lucia Way | 0.00mi | 4/2.0 (+1) | 1,375 (+14%) | 1mo | $170,990 | $124 | 71 |
| 1000 Crescent Blvd | 0.57mi | 3/2.0 | 1,132 (-6%) | 2mo | $159,000 | $140 | 61 |
| 218 N Franklin Ave | 0.25mi | 2/1.0 (-1) | 1,062 (-12%) | 3mo | $165,000 | $155 | 57 |
| 907 Linia Alfred St | 0.68mi | 3/1.0 | 1,225 (+1%) | 8mo | $59,500 | $49 | 56 |
| 605 Arvon St | 0.60mi | 2/1.0 (-1) | 1,260 (+4%) | 1mo | $82,200 | $65 | 55 |
| 1204 Crescent Blvd | 0.73mi | 3/1.0 | 1,156 (-4%) | 4mo | $149,900 | $130 | 51 |
| 1105 S Fenner Ave | 0.70mi | 3/2.0 | 1,345 (+11%) | 8mo | $172,900 | $129 | 42 |
Match score weights: distance 35% · size 25% · config 20% · recency 20%. Top-matched comps best support the ARV.
Projected returns pro-forma
-3.0% appreciation · 4.0% rent growth · sell at horizon
- IRR
- -8.6%
- Equity multiple
- 0.68×
- Total profit
- $-13,979
- Equity at exit
- $23,415
- IRR
- 2.2%
- Equity multiple
- 1.17×
- Total profit
- $7,339
- Equity at exit
- $13,578
Cash invested: $43,971 (down + closing). Projections, not guarantees.
Landlord ↔ Tenant lean methodology
- Overall (STATE)
- 87 Strongly Landlord-Friendly
- State Texas
- 87 Strongly Landlord-Friendly · R+5
- County
- — inherits STATE
- City
- — inherits STATE
ZIP-level market 77327
- Home prices YoY
- -5.2%
- Rents YoY
- 4.0%
- Active inventory
- 1574
- Price-to-rent
- 7.9×
Monthly cashflow live
- Estimated rent
- $1,582 high interval (Pro) →
- Mortgage (P&I)
- −$824
- Tax est. 1.5%
- −$196 /mo · $2,356/yr
- Insurance
- −$65
- HOA
- −$10
- Vacancy / Maint / Mgmt
- −$332
- Net cashflow
- $154
Break-even live
UW: 25.0% down · 7.5% · 30yr · 1.5% tax · 5.0% vac · 8.0% maint · 8.0% mgmt
Financing live
Cash to close
- Down payment
- $39,260
- Closing costs
- $4,711
- Reserves months
- —
- Total cash needed
- —
Loan-product check · same deal, 3 products live
Conventional
25% down · 7.5% · 30yr
- Down + closing
- —
- Monthly P&I
- —
- Monthly cashflow
- —
- DSCR
- —
- Eligible?
- —
Personal DTI + credit; lowest rate.
DSCR
20% down · 8.5% · 30yr
- Down + closing
- —
- Monthly P&I
- —
- Monthly cashflow
- —
- DSCR
- —
- Eligible?
- —
No personal income docs; deal must DSCR.
Hard money
10% down · 12.0% · 12mo
- Down + closing
- —
- Monthly P&I
- —
- Monthly cashflow
- —
- DSCR
- —
- Eligible?
- —
Short-term bridge; refi at stabilization.
Rent comps 7 comps
| Address | Beds | Baths | Sqft | Rent | $/sqft | DOM | Units | Dist |
|---|---|---|---|---|---|---|---|---|
| 309 Johnson ST Unit J Cleveland, TX | 4.0 | 1.0 | 1346 | $1,350 | $1.00 | 7d | 1 | 0.04mi |
| 511 S Roosevelt Ave Cleveland, TX | 3.0 | 1.0 | 960 | $1,600 | $1.67 | 43d | 1 | 0.39mi |
| 700 Lyle West Ave Cleveland, TX | 3.0 | 2.0 | 1080 | $1,195 | $1.11 | 1d | 1 | 0.66mi |
| 307 Sleepy Hollow Dr Cleveland, TX | 1.0–2.0 | 1.0–2.0 | 738 | $1,440 | $1.95 | 1d | 4 | 0.78mi |
| 1018 Green Ave Cleveland, TX | 4.0 | 2.0 | 1337 | $1,500 | $1.12 | 22d | 1 | 0.96mi |
| 201 Pine Bend Ct Cleveland, TX | 3.0 | 1.0 | 1040 | $1,200 | $1.15 | 43d | 1 | 0.98mi |
| 1301 Nevell St Cleveland, TX | 1.0–3.0 | 1.0–2.0 | 827 | $1,255 | $1.52 | 1d | 4 | 1.02mi |
HOA detail
- Monthly dues
- $10 · $120/yr
Listing history 7 events
-
2026-06-18days on market $149,999 Active 20 DOM
-
2026-06-17days on market $149,999 Active 19 DOM
-
2026-06-16days on market $149,999 Active 18 DOM
-
2026-06-15days on market $149,999 Active 17 DOM
-
2026-06-13days on market $149,999 Active 15 DOM
-
2026-06-10pricedays on market $149,999 Active 11 DOM
-
2026-05-31days on market $150,000 Active 2 DOM
ⓘ Source: listings_history table (triggers on properties + properties_extension) + one-shot
backfill from property_details.listing_events for pre-trigger history.
Nearby sold comps map
Loading sold comps map…
Walkable amenities ~0.75 mi
Loading nearby amenities…
Taxation est. · year 1
- Rental income
- $18,982
- − Mortgage interest
- −$8,797
- − Property taxes
- −$2,356
- − Insurance
- −$785
- − Repairs & maintenance
- −$1,519
- − Management
- −$1,519
- − HOA
- −$120
- − Depreciation
- −$4,568
- Taxable loss
- −$681
- Est. tax savings @ 24.0%
- +$164
- After-tax cash flow
- $2,016/yr
For passive investors: Depreciation is non-cash, so a rental often shows a tax loss while cash-flowing — sheltering income. Rental losses are passive: they offset passive income freely, and up to $25,000/yr can offset ordinary (W-2) income if you actively participate and your MAGI is under $100k (phasing out to $0 by $150k); unused losses carry forward. On sale, claimed depreciation is recaptured at up to 25%, and gains may owe capital-gains tax (a 1031 exchange can defer both). Figures are a year-1 estimate at your 24.0% rate — not tax advice; consult a CPA.
Condition & rehab AI · 13 photos
This move-in-ready home in Santa Fe Village offers a modern, low-maintenance layout with a spacious floor plan and well-maintained exterior. Simple updates like painting the exterior and trimming the landscaping can further enhance its value.
Value-add opportunities
- Resale Paint exterior siding — Enhances curb appeal and value
- Rental Trim landscaping — Improves curb appeal and rental appeal
Renovation cost estimate screening
Value-add ROI direction
- Resale Paint exterior siding — Enhances curb appeal and value ↑
- Rental Trim landscaping — Improves curb appeal and rental appeal ↑
ⓘ Cost ranges are severity-bucket heuristics (US national rule-of-thumb). Get contractor quotes + a written scope before underwriting a rehab budget.
Schools (NCES district)
- District
- Cleveland ISD
- NCES district ID
- 4814370
- Math proficiency
- 24% ▼ -13.00%
- Reading proficiency
- 25% ▼ -4.00%
- Median HH income
- $39,173
- Composite
- 20.61/100
- National rank
- #8549
- State rank
- #723 of 826 in TX
Livability — Cleveland
- Score
- 61/100
- State rank
- #1013
- US rank
- #17943
Category grades
Schools grade is shown separately in the Schools card above.
Census & demographics
- Census place
- Cleveland, TX
- County
- Liberty County · 82,189 people
- City population
- 17,208
- Metro
- Houston-The Woodlands-Sugar Land, TX
- Population (ZIP)
- 42,685
- Household income
- $62,219
- Rent vs Own
- Severe rent burden
- 437.0
Population outlook (Liberty County) Hauer SSP2
- Today (2025)
- 87,956 people
- By 2030
- 92,161 · +4.8%
- By 2040
- 100,784 · +14.6%
- By 2050
- 109,471 · +24.5%
- By 2075
- 133,470 · +51.7%
- By 2100
- 147,372 · +67.6%
Race, ethnicity, and origin ACS 2023
- Neighborhood character
- Diverse neighborhood (Simpson 0.57)
- Race & ethnicity
- Hispanic / Latino 54% White 36% Two or more races 18% Black 8% Native American 2%
- Hispanic origin (detail)
- Mexican 42%
- Common ancestry
- Lithuanian 2% Serbian 1% Slovak 0%
- Foreign-born
- 22% · Canada
- Languages at home
- 51% English-only · Spanish 48%
Political lean MEDSL · Liberty
- 2024 margin
- Solid R (+61.6) · D 19.0% · R 80.6%
- 2008→2024 swing
- -17.9pp toward R · 2008: -43.7pp · 2024: -61.6pp
- All cycles
- 2024: R+61.6 2020: R+59.7 2016: R+58.0 2012: R+53.3 2008: R+43.7
Not yet ingested
- Civics
- —
Market trends
- HPI YoY
- ▼ -12.39%
- Current HPI
- 224.9222
- Rent YoY
- ▲ 4.00%
- Metro
- Houston-The Woodlands-Sugar Land, TX
- State GDP YoY
- ▲ 3.95%
- F500 in state
- 110
Industry mix (Fortune 500 HQ in TX)
| Industry | F500 HQs | Revenue |
|---|---|---|
| Energy | 16 | $1,198B |
|
||
| Technology | 5 | $198B |
|
||
| Engineering / Construction | 4 | $72B |
|
||
| Energy Services | 3 | $60B |
|
||
| Utilities | 3 | $41B |
|
||
| Healthcare | 2 | $330B |
|
||
Price history
+0.8% since first listed7 events — show timeline
- 2026-05-29 Listed $150,000 HARMLS
- 2026-05-20 Sold (MLS) — HARMLS
- 2026-04-20 Pending — HARMLS
- 2026-04-20 Price Changed $172,990 HARMLS
- 2026-04-17 Price Changed $129,040 HARMLS
- 2026-04-13 Price Changed $136,240 HARMLS
- 2026-04-02 Listed $148,740 HARMLS
Cash-flow waterfall
monthlySold comps — $/sqft
last 12 mo · ≤1 miLoading sold comps…