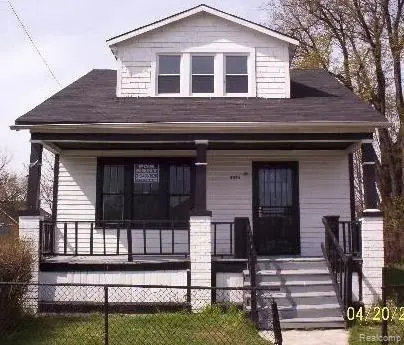
5573 Montclair St · Detroit, MI
Flood risk 1/10 · Minimal
- FEMA flood zone
- X (unshaded)
- Chance of flooding over 30 yrs
- 0.0%
- Est. flood insurance / yr
- $473 – $860
Fire risk 1/10 · Minimal
- Est. fire insurance / yr
- $784 – $1,456
Heat risk 3/10 · Minor
- Hot days now (above 96°F)
- 7 days/yr
- Hot days in 30 yrs
- 15 days/yr
Wind risk 2/10 · Minimal
- Chance of severe wind over 30 yrs
- —
Air-quality risk 3/10 · Minor
- Unhealthy air days now
- 2 days/yr
- Unhealthy air days in 30 yrs
- 5 days/yr
Risk factors via First Street. Map © Google.
Why this score? — see what drove the B grade
The composite is a weighted blend of 9 inputs, each scored 0–100. Each bar is that input's sub-score; the figure is the points it added to the 100-point composite (weight × sub-score).
- Cash flow +30.0/30.0
- ARV discount +13.1/15.0
- 1% rule +10.0/10.0
- DSCR +10.0/10.0
- Livability +3.7/5.0
- Rent growth +2.5/5.0
- Condition / age +2.5/5.0
- Schools +1.3/10.0
- Appreciation +0.0/10.0
$100,000
🖨 Deal sheet (PDF) 📄 Offer letter ✓ Due diligence
Listing remarks MLS
Finally, a Detroit home with room for everyone and space for everything. 5573 Montclair offers five bedrooms, two full baths, and roughly 2,000 square feet of comfortable, move-in-ready living. It has the kind of space that lets your life breathe. Step inside to fresh paint and new carpet throughout, giving every room a clean, welcoming feel that's ready for your furniture and your style. The layout works hard for the way people actually live today: use the extra bedrooms for kids, guests, a home office, a playroom, or a quiet hobby space without ever crowding your main living areas. The kitchen has been refreshed with new flooring, making it an easy, inviting place to start the morning, cook dinner, or gather with the people who matter most. Two full bathrooms keep busy mornings running smoothly, and the generous living space makes everyday routines feel more organized. Behind the cosmetics, the important updates are done: updated plumbing, updated electrical, and a good roof mean you can move in with confidence and skip the surprise expenses. The manageable lot offers outdoor space to enjoy, garden, or personalize over time without the weekends-long upkeep of a sprawling yard. And if you're an investor, there's smart long-term upside here too. This property has a rental potential of up to $1800/m.
Key facts
- Updated electrical
- Fresh paint
- Manageable lot
Tags
Property features AI
Exterior
- Parking: No garage
- Utilities: Public water; Public sewer
- Home design: Single-family residence; Two stories; Ground-level entry with steps
- Construction: Cedar and vinyl siding; Block foundation; Built with approximately 2,000 above-grade finished square feet
- Exterior features: Paved road access; Pets allowed
Interior
- Kitchen: Gas water heater
- Bedrooms: Total rooms: 8
- Bathrooms: 2 full bathrooms
- Heating & cooling: Forced air heating (natural gas); No central cooling
- Interior features: High speed internet
Neighborhood map
What this means for you Summary
Snapshot
- This is a 5-bed/1.0-bath single-family listed at $100k.
Deal economics
- At list price, monthly cash flow is $861 ($10k/yr) — positive.
- The deal already cash-flows at list — no discount required.
- Meets the 1% rule at list price ($2k rent vs $100k).
- Recommended offer: $97k (3.0% below list) — sets the bar for market timing.
- Cap rate 16.6% vs local median 10.0% in Detroit — top-decile yield for the area; either an underpriced asset or a hidden risk that comps aren't pricing in. Stress-test before assuming the spread holds.
Location & tenants
- Location reads 73/100 on livability (#218 in MI) — a middle-class / working-renter tenant base. Strengths: amenities A+, commute A+, cost of living A+; Watch: crime F, employment F.
- Detroit Public Schools Community District (urban): math 10% / reading 24% proficiency, ranked #499 of 540 in MI (top 92%) — low school quality limits family demand, transient renter base, plan for 1-2y turnover; 90% free/reduced lunch — lower-income household profile, screen leases tightly.
- Zoned schools: Hutchinson Elementarymiddle School (329 students, 92% FRL); Southeastern High School (math 5% / reading 15%, grade F, #659 of 713 statewide, top 97%, 644 students, 87% FRL) — zoned schools at 89% FRL track the district average.
- Market conditions: 192 active listings in the ZIP; 4 comparable units currently listed for rent nearby; rentals lingering (median 46d on market — plan ~5-8 weeks vacancy on turnover, expect pricing pressure); 75% of comp listings sitting > 30 days — soft ceiling on asking rent; lower-income renter base — watch delinquency; 2,639 units permitted in Wayne County in 2024 (1,216 in 5+ unit buildings).
- At $1,997/mo this rent would consume 70% of the median local household income ($34k/yr) (locally 1202% of renters already pay >50% of income on rent) — very limited rent-growth headroom before tenants either downsize or default.
Forward outlook
- Local home prices are declining (-3.0%/yr); year-one equity from $691 of loan paydown is wiped out by about $3k of value loss. Plan a longer hold.
- Wayne County population projected at -17% by 2050 — secular population decline; favor cash flow + early exit over multi-decade hold.
- At projected returns (-3.0% appreciation + 3.0% rent growth), your $28k cash investment doubles in ~4 years — after that, you're playing with house money.
Negotiation context
- It's been on market 32 days — a 3% lower offer ($97k) is reasonable based on typical stale-listing flexibility.
- 15 sale attempts since 21y ago with the ask held roughly flat each time — persistent listings suggest the price (not the market) is what's stuck; bring a comps-based counter.
- Current owner paid $15k; list at $100k implies a 567% gain — meaningful room to come down on a strong offer.
Risks & watch-outs
- Watch-outs: built in 1921 — expect roof / HVAC / electrical / plumbing capex.
Questions for the listing agent
- It's been on market 32 days. Have you received any prior offers? Is the seller open to a 3% concession, seller financing, or rate buy-down credit?
- Built in 1921 — when were the roof, HVAC, electrical panel, plumbing, and water heater last replaced?
- Is there a deadline driving the sale (1031 exchange, divorce, estate, relocation)? That informs how much negotiation room exists.
- Schools are F-rated, which usually means shorter tenancies and higher turnover. Who's the typical renter profile here, and what's been the actual vacancy rate?
- Crime grade is F in this area — have there been break-ins, vandalism, or insurance claims at this property in the last 3 years? What carrier currently insures it and at what premium?
- What's the average days-on-market for RENTAL listings here right now (not sales)? A rising rental-DOM trend means longer vacancies and softer asking-rent achievability than the comps imply.
- What's the recent tenant-quality profile in this submarket — average credit score on applications, eviction rate, late-payment / NSF rate, and stable-employment percentage? A property-management company in the area should have these aggregated.
- How much new for-sale + rental construction is in the pipeline within 1–3 miles? Heavy new supply typically softens prices + rents 12–24 months out; constrained supply supports both.
Investment metrics
- 1% rule
- 2.00% ✓
- Cap rate
- 16.63%
- Cash-on-cash
- 36.91%
- DSCR
- 2.64
- GRM
- 4.2
CMA / ARV
- ARV (median comp)
- $114,088
- List price
- $100,000
- Delta
- 5.09%
- Verdict
- FAIR
- Comps
- 10 within 2.0 mi
Show comp detail 7 sales within ~0.75 mi
| Address | Dist | Beds/Ba | Sqft | Sold | Price | $/sf | Match |
|---|---|---|---|---|---|---|---|
| 4688 French Rd | 0.46mi | 4/2.0 (-1) | 1,458 (+8%) | 4mo | $170,000 | $117 | 52 |
| 6080 Beniteau St | 0.40mi | 4/2.5 (-1) | 1,437 (+6%) | 10mo | $185,000 | $129 | 51 |
| 4667 Beniteau St | 0.53mi | 5/2.0 | 1,396 (+4%) | 24mo | $45,000 | $32 | 46 |
| 4780 Hurlbut St | 0.62mi | 4/2.0 (-1) | 1,489 (+10%) | 2mo | $155,000 | $104 | 43 |
| 5326 Belvidere St | 0.69mi | 4/1.5 (-1) | 1,469 (+9%) | 5mo | $82,500 | $56 | 42 |
| 4791 Saint Clair St | 0.51mi | 4/1.0 (-1) | 1,494 (+11%) | 17mo | $30,000 | $20 | 39 |
| 5086 Belvidere St | 0.74mi | 4/1.0 (-1) | 1,540 (+14%) | 22mo | $54,900 | $36 | 19 |
Match score weights: distance 35% · size 25% · config 20% · recency 20%. Top-matched comps best support the ARV.
Projected returns pro-forma
-3.0% appreciation · 3.0% rent growth · sell at horizon
- IRR
- 32.8%
- Equity multiple
- 2.38×
- Total profit
- $38,701
- Equity at exit
- $14,910
- IRR
- 39.8%
- Equity multiple
- 4.73×
- Total profit
- $104,525
- Equity at exit
- $8,646
Cash invested: $28,000 (down + closing). Projections, not guarantees.
Landlord ↔ Tenant lean methodology
- Overall (STATE)
- 62 Landlord-Friendly
- State Michigan
- 62 Landlord-Friendly · EVEN
- County
- — inherits STATE
- City
- — inherits STATE
ZIP-level market 48213
- Active inventory
- 192
- Price-to-rent
- 4.2×
Monthly cashflow live
- Estimated rent
- $1,997 medium interval (Pro) →
- Mortgage (P&I)
- −$524
- Tax from tax record
- −$150 /mo · $1,803/yr
- Insurance
- −$42
- HOA
- −$0
- Vacancy / Maint / Mgmt
- −$419
- Net cashflow
- $861
Break-even live
Sensitivity live
| Price | -10% $918 | -5% $890 | +0% $861 | +5% $833 | +10% $805 |
|---|---|---|---|---|---|
| Rent | -10% $704 | -5% $782 | +0% $861 | +5% $940 | +10% $1,019 |
| Rate | -1.0pp $912 | -0.5pp $887 | base $861 | +0.5pp $835 | +1.0pp $809 |
UW: 25.0% down · 7.5% · 30yr · 1.5% tax · 5.0% vac · 8.0% maint · 8.0% mgmt
Financing live
Cash to close
- Down payment
- $25,000
- Closing costs
- $3,000
- Reserves months
- —
- Total cash needed
- —
Loan-product check · same deal, 3 products live
Conventional
25% down · 7.5% · 30yr
- Down + closing
- —
- Monthly P&I
- —
- Monthly cashflow
- —
- DSCR
- —
- Eligible?
- —
Personal DTI + credit; lowest rate.
DSCR
20% down · 8.5% · 30yr
- Down + closing
- —
- Monthly P&I
- —
- Monthly cashflow
- —
- DSCR
- —
- Eligible?
- —
No personal income docs; deal must DSCR.
Hard money
10% down · 12.0% · 12mo
- Down + closing
- —
- Monthly P&I
- —
- Monthly cashflow
- —
- DSCR
- —
- Eligible?
- —
Short-term bridge; refi at stabilization.
Rent comps 4 comps
| Address | Beds | Baths | Sqft | Rent | $/sqft | DOM | Units | Dist |
|---|---|---|---|---|---|---|---|---|
| 4667 Beniteau St Detroit, MI | 5.0 | 2.0 | 1396 | $1,700 | $1.22 | 46d | 1 | 0.49mi |
| 4487 French Rd Detroit, MI | 4.0 | 2.0 | 1280 | $1,800 | $1.41 | 46d | 1 | 0.62mi |
| 8843 E Canfield St Detroit, MI | 4.0 | 2.0 | 1200 | $2,400 | $2.00 | 46d | 1 | 1.09mi |
| 4169 Burns St Detroit, MI | 4.0 | 2.5 | 1326 | $2,300 | $1.73 | 26d | 1 | 1.29mi |
Listing history 42 events
-
2026-06-21days on market $100,000 Active 32 DOM
-
2026-06-18days on market $100,000 Active 29 DOM
-
2026-06-17days on market $100,000 Active 28 DOM
-
2026-06-15days on market $100,000 Active 26 DOM
-
2026-06-13days on market $100,000 Active 24 DOM
-
2026-06-13days on market $100,000 Active 23 DOM
-
2026-06-09days on market $100,000 Active 20 DOM
-
2026-06-08days on market $100,000 Active 19 DOM
-
2026-06-07days on market $100,000 Active 18 DOM
-
2026-06-04days on market $100,000 Active 15 DOM
-
2026-06-03days on market $100,000 Active 14 DOM
-
2026-06-02days on market $100,000 Active 13 DOM
-
2026-06-01days on market $100,000 Active 12 DOM
-
2026-05-31days on market $100,000 Active 11 DOM
-
2026-05-04historical
-
2026-04-04$119,900 Active
-
2026-04-04$119,900 Active
-
2026-03-20historical
-
2026-03-20historical
-
2026-01-26$179,000 Active
-
2026-01-26$179,000 Active
-
2026-01-20historical
-
2026-01-20historical
-
2025-12-02$179,000 Active
-
2025-12-02$179,000 Active
-
2017-06-05soldstatus $15,000 Sold
-
2017-06-05soldstatus $15,000 Closed
-
2017-05-17status Pending
-
2017-05-16status Pending
-
2016-10-17$15,000 Active
-
2016-10-17$15,000 Active
-
2006-04-29soldstatus $9,000
-
2006-03-26historical
-
2006-03-25$9,400
-
2006-03-23soldstatus $8,750
-
2006-01-30$9,400
-
2006-01-26historical
-
2005-12-30historical
-
2005-12-27$12,500
-
2005-09-29historical
-
2005-09-26$12,500
-
2005-09-26$19,900
ⓘ Source: listings_history table (triggers on properties + properties_extension) + one-shot
backfill from property_details.listing_events for pre-trigger history.
Tax reassessment forecast MI · Partial reset (capped growth)
- Current annual tax
- $1,803 · $150/mo
- Projected year-2 tax
- $1,803 · $150/mo
- Expected delta
- $0/yr ($0/mo · 0.0%)
ⓘ Screening estimate from a state-policy table — verify with the county assessor before closing.
Climate risk First Street
- Flood 1/10 Low FEMA zone X (unshaded) · 0% chance over 30 yrs
- Wildfire 1/10 Low
- Heat 3/10 Moderate 7 d/yr ≥96°F today · 15 d/yr by 30 yrs out
- Wind 2/10 Low
- Air quality 3/10 Moderate 2 unhealthy d/yr today · 5 by 30 yrs out
Nearby sold comps map
Loading sold comps map…
Walkable amenities ~0.75 mi
Loading nearby amenities…
Taxation est. · year 1
- Rental income
- $23,965
- − Mortgage interest
- −$5,602
- − Property taxes
- −$1,803
- − Insurance
- −$500
- − Repairs & maintenance
- −$1,917
- − Management
- −$1,917
- − Depreciation
- −$2,909
- Taxable income
- $9,317
- Est. tax owed @ 24.0%
- −$2,236
- After-tax cash flow
- $8,100/yr
For passive investors: Depreciation is non-cash, so a rental often shows a tax loss while cash-flowing — sheltering income. Rental losses are passive: they offset passive income freely, and up to $25,000/yr can offset ordinary (W-2) income if you actively participate and your MAGI is under $100k (phasing out to $0 by $150k); unused losses carry forward. On sale, claimed depreciation is recaptured at up to 25%, and gains may owe capital-gains tax (a 1031 exchange can defer both). Figures are a year-1 estimate at your 24.0% rate — not tax advice; consult a CPA.
Schools (NCES district)
- District
- Detroit Public Schools Community District
- NCES district ID
- 2601103
- Math proficiency
- 10% ▼ -2.00%
- Reading proficiency
- 24% ▲ 6.00%
- Median HH income
- $25,815
- Composite
- 13.06/100
- National rank
- #9564
- State rank
- #499 of 540 in MI
Livability — Detroit
- Score
- 73/100
- State rank
- #218
- US rank
- #5427
Category grades
Schools grade is shown separately in the Schools card above.
Census & demographics
- Census place
- Detroit, MI
- County
- Wayne County · 1,562,939 people
- City population
- 572,865
- Metro
- Detroit-Warren-Dearborn, MI
- Population (ZIP)
- 20,075
- Household income
- $34,003
- Rent vs Own
- Severe rent burden
- 1202.0
Population outlook (Wayne County) Hauer SSP2
- Today (2025)
- 1,675,273 people
- By 2030
- 1,620,300 · -3.3%
- By 2040
- 1,502,341 · -10.3%
- By 2050
- 1,384,039 · -17.4%
- By 2075
- 1,124,592 · -32.9%
- By 2100
- 881,193 · -47.4%
Race, ethnicity, and origin ACS 2023
- Neighborhood character
- Predominantly Black (92%)
- Race & ethnicity
- Black 92% White 4% Hispanic / Latino 2% Two or more races 1%
- Common ancestry
- Slovak 1%
- Foreign-born
- 2% · Canada
- Languages at home
- 97% English-only · Arabic 1% Spanish 1%
Political lean MEDSL · Wayne
- 2024 margin
- Strong D (+29.0) · D 62.7% · R 33.7% · Other 3.6%
- 2008→2024 swing
- -20.5pp toward R · 2008: 49.5pp · 2024: 29.0pp
- All cycles
- 2024: D+29.0 2020: D+38.1 2016: D+37.3 2012: D+46.9 2008: D+49.5
Not yet ingested
- Civics
- —
Market trends
- HPI YoY
- ▼ -122.86%
- Current HPI
- 217.2037
- Rent YoY
- —
- Metro
- Detroit-Warren-Dearborn, MI
- State GDP YoY
- ▲ 1.37%
- F500 in state
- 28
Industry mix (Fortune 500 HQ in MI)
| Industry | F500 HQs | Revenue |
|---|---|---|
| Automotive Parts | 3 | $48B |
|
||
| Automotive | 2 | $372B |
|
||
| Chemicals | 1 | $45B |
|
||
| Automotive Retail | 1 | $29B |
|
||
| Healthcare / Medical Devices | 1 | $23B |
|
||
| Automotive Technology | 1 | $20B |
|
||
Price history
+700.0% since first listed30 events — show timeline
- 2026-05-20 Listed $100,000 REALCOMP
- 2026-05-20 Listed $100,000 MiRealSource-MiMLS
- 2026-05-04 Listing Removed — MiRealSource-MiMLS
- 2026-04-04 Listed $119,900 REALCOMP
- 2026-04-04 Listed $119,900 MiRealSource-MiMLS
- 2026-03-20 Listing Removed — MiRealSource-MiMLS
- 2026-03-20 Listing Removed — REALCOMP
- 2026-01-26 Listed $179,000 REALCOMP
- 2026-01-26 Listed $179,000 MiRealSource-MiMLS
- 2026-01-20 Listing Removed — MiRealSource-MiMLS
- 2026-01-20 Listing Removed — REALCOMP
- 2025-12-02 Listed $179,000 MiRealSource-MiMLS
- 2025-12-02 Listed $179,000 REALCOMP
- 2017-06-05 Sold (MLS) $15,000 MiRealSource-MiMLS
- 2017-06-05 Sold (MLS) $15,000 REALCOMP
- 2017-05-17 Pending — MiRealSource-MiMLS
- 2017-05-16 Pending — REALCOMP
- 2016-10-17 Listed $15,000 MiRealSource-MiMLS
- 2016-10-17 Listed $15,000 REALCOMP
- 2006-04-29 Sold (MLS) $9,000 MiRealSource-MiMLS
- 2006-03-26 Listing Removed — MiRealSource-MiMLS
- 2006-03-25 Listed $9,400 MiRealSource-MiMLS
- 2006-03-23 Sold (MLS) $8,750 REALCOMP
- 2006-01-30 Listed $9,400 REALCOMP
- 2006-01-26 Listing Removed — MiRealSource-MiMLS
- 2005-12-30 Listing Removed — MiRealSource-MiMLS
- 2005-12-27 Listed $12,500 MiRealSource-MiMLS
- 2005-09-29 Listing Removed — REALCOMP
- 2005-09-26 Listed $19,900 REALCOMP
- 2005-09-26 Listed $12,500 MiRealSource-MiMLS
Property tax history
+13.4%/yrLatest (2025): $1,803 · -0.2% YoY. Source: county tax records.
Cash-flow waterfall
monthlySold comps — $/sqft
last 12 mo · ≤1 miLoading sold comps…