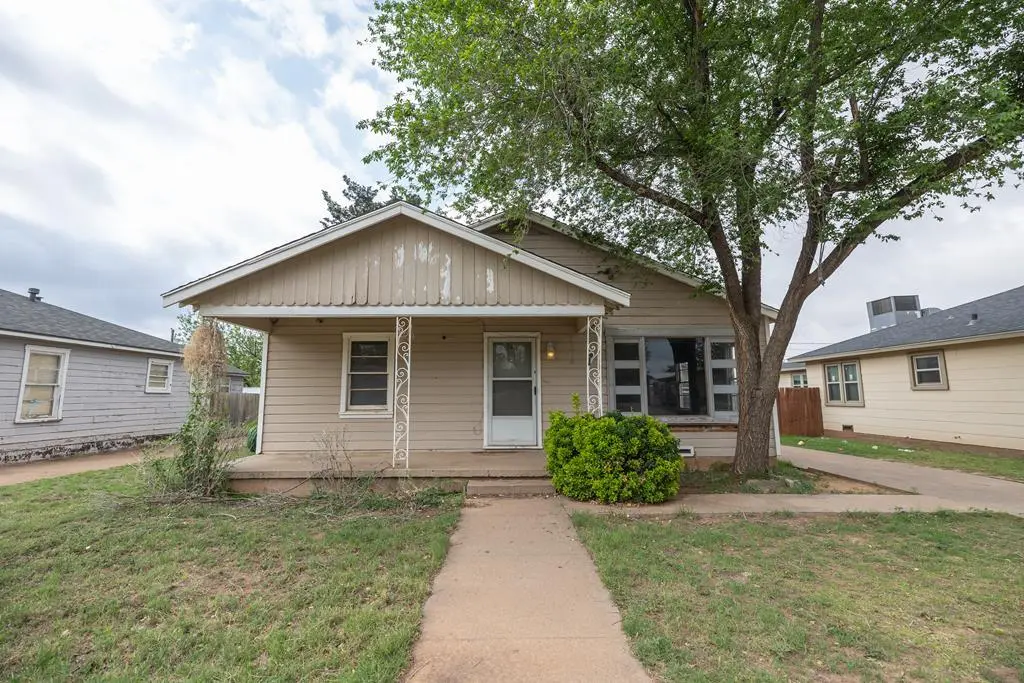
306 33rd St · Snyder, TX
Flood risk 1/10 · Minimal
- FEMA flood zone
- X
- Chance of flooding over 30 yrs
- 0.0%
- Est. flood insurance / yr
- $507 – $1,088
Fire risk 8/10 · Major
- Est. fire insurance / yr
- $1,222 – $2,270
Heat risk 6/10 · Moderate
- Hot days now (above 103°F)
- 7 days/yr
- Hot days in 30 yrs
- 21 days/yr
Wind risk 2/10 · Minimal
- Chance of severe wind over 30 yrs
- 4.0%
Air-quality risk 1/10 · Minimal
- Unhealthy air days now
- 0 days/yr
- Unhealthy air days in 30 yrs
- 0 days/yr
Risk factors via First Street. Map © Google.
Why this score? — see what drove the C+ grade
The composite is a weighted blend of 9 inputs, each scored 0–100. Each bar is that input's sub-score; the figure is the points it added to the 100-point composite (weight × sub-score).
- Cash flow +30.0/30.0
- 1% rule +10.0/10.0
- DSCR +10.0/10.0
- Livability +3.1/5.0
- Schools +2.8/10.0
- Rent growth +2.5/5.0
- Condition / age +2.5/5.0
- ARV discount +0.0/15.0
- Appreciation +0.0/10.0
$75,000
🖨 Deal sheet 📄 Offer letter ✓ Due diligence
Listing remarks MLS
Great opportunity for investors or buyers looking for a project with potential. This 2 bedroom, 1 bathroom home offers approximately 1,200 sq ft of space with a functional layout that includes a separate utility room, kitchen, and dining area. With solid bones and plenty of room to make it your own, this property is ready for someone with vision. It does need some TLC, making it a great chance to add value and create something special. Whether you're looking for a rental, flip, or affordable home to personalize, this one is worth a look.
Key facts
- 7,405 sq ft lot
- Garage
- Built 1948
Neighborhood map
What this means for you Summary
Snapshot
- This is a 2-bed/1.0-bath single-family listed at $75k.
Deal economics
- At list price, monthly cash flow is $458 ($5k/yr) — positive.
- The deal already cash-flows at list — no discount required.
- Meets the 1% rule at list price ($1k rent vs $75k).
- Recommended offer: $73k (3.0% below list) — sets the bar for market timing.
Location & tenants
- Location reads 61/100 on livability (#1,008 in TX) — a middle-class / working-renter tenant base. Strengths: cost of living A+, housing A+; Watch: health & safety C-, employment D+, schools F.
- Snyder ISD (town): math 33% / reading 31% proficiency, ranked #577 of 826 in TX (top 70%) — families likely to look elsewhere, expect single-tenant / working-renter base with shorter leases.
- Market conditions: 107 active listings in the ZIP; 4 comparable units currently listed for rent nearby; rentals lingering (median 44d on market — plan ~5-8 weeks vacancy on turnover, expect pricing pressure); 100% of comp listings sitting > 30 days — soft ceiling on asking rent; 32 units permitted in Scurry County in 2024 (0 in 5+ unit buildings).
Forward outlook
- Local home prices are declining (-3.0%/yr); year-one equity from $519 of loan paydown is wiped out by about $2k of value loss. Plan a longer hold.
- Scurry County population projected at +22% by 2050 — long-run rental-demand tailwind backs the buy-and-hold thesis.
- At projected returns (-3.0% appreciation + 3.0% rent growth), your $21k cash investment doubles in ~5 years — after that, you're playing with house money.
Negotiation context
- It's been on market 59 days — a 3% lower offer ($73k) is reasonable based on typical stale-listing flexibility.
Risks & watch-outs
- Watch-outs: built in 1948 — expect roof / HVAC / electrical / plumbing capex.
- Climate carrying-cost: severe wildfire risk; extreme-heat days projected 7→21/yr by 2055 (HVAC capex compounding) — expect insurance premiums to compound above CPI over the hold.
Questions for the listing agent
- It's been on market 59 days. Have you received any prior offers? Is the seller open to a 3% concession, seller financing, or rate buy-down credit?
- Built in 1948 — when were the roof, HVAC, electrical panel, plumbing, and water heater last replaced?
- Is there a deadline driving the sale (1031 exchange, divorce, estate, relocation)? That informs how much negotiation room exists.
- Schools are F-rated, which usually means shorter tenancies and higher turnover. Who's the typical renter profile here, and what's been the actual vacancy rate?
- Crime grade is F in this area — have there been break-ins, vandalism, or insurance claims at this property in the last 3 years? What carrier currently insures it and at what premium?
- What's the average days-on-market for RENTAL listings here right now (not sales)? A rising rental-DOM trend means longer vacancies and softer asking-rent achievability than the comps imply.
- What's the recent tenant-quality profile in this submarket — average credit score on applications, eviction rate, late-payment / NSF rate, and stable-employment percentage? A property-management company in the area should have these aggregated.
- How much new for-sale + rental construction is in the pipeline within 1–3 miles? Heavy new supply typically softens prices + rents 12–24 months out; constrained supply supports both.
Investment metrics
- 1% rule
- 1.64% ✓
- Cap rate
- 13.62%
- Cash-on-cash
- 26.18%
- DSCR
- 2.16
- GRM
- 5.1
CMA / ARV
- ARV (median comp)
- $56,071
- List price
- $75,000
- Delta
- 33.76%
- Verdict
- OVERPRICED
- Comps
- 2 within 2.0 mi
Projected returns pro-forma
-3.0% appreciation · 3.0% rent growth · sell at horizon
- IRR
- 19.9%
- Equity multiple
- 1.81×
- Total profit
- $17,043
- Equity at exit
- $11,183
- IRR
- 28.2%
- Equity multiple
- 3.50×
- Total profit
- $52,479
- Equity at exit
- $6,485
Cash invested: $21,000 (down + closing). Projections, not guarantees.
Landlord ↔ Tenant lean methodology
- Overall (STATE)
- 87 Strongly Landlord-Friendly
- State Texas
- 87 Strongly Landlord-Friendly · R+5
- County
- — inherits STATE
- City
- — inherits STATE
ZIP-level market 79549
- Active inventory
- 107
- Price-to-rent
- 5.1×
Monthly cashflow live
- Estimated rent
- $1,231 medium interval (Pro) →
- Mortgage (P&I)
- −$393
- Tax from tax record
- −$90 /mo · $1,075/yr
- Insurance
- −$31
- HOA
- −$0
- Vacancy / Maint / Mgmt
- −$258
- Net cashflow
- $458
Break-even live
UW: 25.0% down · 7.5% · 30yr · 1.5% tax · 5.0% vac · 8.0% maint · 8.0% mgmt
Financing live
Cash to close
- Down payment
- $18,750
- Closing costs
- $2,250
- Reserves months
- —
- Total cash needed
- —
Loan-product check · same deal, 3 products live
Conventional
25% down · 7.5% · 30yr
- Down + closing
- —
- Monthly P&I
- —
- Monthly cashflow
- —
- DSCR
- —
- Eligible?
- —
Personal DTI + credit; lowest rate.
DSCR
20% down · 8.5% · 30yr
- Down + closing
- —
- Monthly P&I
- —
- Monthly cashflow
- —
- DSCR
- —
- Eligible?
- —
No personal income docs; deal must DSCR.
Hard money
10% down · 12.0% · 12mo
- Down + closing
- —
- Monthly P&I
- —
- Monthly cashflow
- —
- DSCR
- —
- Eligible?
- —
Short-term bridge; refi at stabilization.
Rent comps 4 comps
| Address | Beds | Baths | Sqft | Rent | $/sqft | DOM | Units | Dist |
|---|---|---|---|---|---|---|---|---|
| 307 34th St Snyder, TX | 3.0 | 1.0 | 1108 | $1,200 | $1.08 | 43d | 1 | 0.04mi |
| 2807 Avenue E Snyder, TX | 2.0 | 2.0 | 1420 | $1,300 | $0.92 | 44d | 1 | 0.40mi |
| 1021 37th St Snyder, TX | 3.0 | 2.0 | 1300 | $1,248 | $0.96 | 43d | 1 | 0.69mi |
| 3710 Avenue V Snyder, TX | 2.0 | 1.0 | 1239 | $1,400 | $1.13 | 43d | 1 | 1.44mi |
Listing history 19 events
-
2026-06-18days on market $75,000 Active 59 DOM
-
2026-06-17days on market $75,000 Active 58 DOM
-
2026-06-16days on market $75,000 Active 57 DOM
-
2026-06-15days on market $75,000 Active 56 DOM
-
2026-06-15days on market $75,000 Active 55 DOM
-
2026-06-13days on market $75,000 Active 54 DOM
-
2026-06-12days on market $75,000 Active 53 DOM
-
2026-06-09days on market $75,000 Active 50 DOM
-
2026-06-08days on market $75,000 Active 49 DOM
-
2026-06-08days on market $75,000 Active 48 DOM
-
2026-06-07days on market $75,000 Active 47 DOM
-
2026-06-03days on market $75,000 Active 44 DOM
-
2026-06-02days on market $75,000 Active 43 DOM
-
2026-06-01days on market $75,000 Active 42 DOM
-
2026-05-31days on market $75,000 Active 41 DOM
-
2026-05-17price $75,000 543-char remark
Show marketing remark (543 chars)
Great opportunity for investors or buyers looking for a project with potential. This 2 bedroom, 1 bathroom home offers approximately 1,200 sq ft of space with a functional layout that includes a separate utility room, kitchen, and dining area. With solid bones and plenty of room to make it your own, this property is ready for someone with vision. It does need some TLC, making it a great chance to add value and create something special. Whether you're looking for a rental, flip, or affordable home to personalize, this one is worth a look.
-
2026-04-28price $82,000 543-char remark
Show marketing remark (543 chars)
Great opportunity for investors or buyers looking for a project with potential. This 2 bedroom, 1 bathroom home offers approximately 1,200 sq ft of space with a functional layout that includes a separate utility room, kitchen, and dining area. With solid bones and plenty of room to make it your own, this property is ready for someone with vision. It does need some TLC, making it a great chance to add value and create something special. Whether you're looking for a rental, flip, or affordable home to personalize, this one is worth a look.
-
2026-04-20$90,000 Active 543-char remark
Show marketing remark (543 chars)
Great opportunity for investors or buyers looking for a project with potential. This 2 bedroom, 1 bathroom home offers approximately 1,200 sq ft of space with a functional layout that includes a separate utility room, kitchen, and dining area. With solid bones and plenty of room to make it your own, this property is ready for someone with vision. It does need some TLC, making it a great chance to add value and create something special. Whether you're looking for a rental, flip, or affordable home to personalize, this one is worth a look.
-
2003-10-16soldstatus
ⓘ Source: listings_history table (triggers on properties + properties_extension) + one-shot
backfill from property_details.listing_events for pre-trigger history.
Tax reassessment forecast TX · Resets to sale price
- Current annual tax
- $1,075 · $90/mo
- Projected year-2 tax
- $1,372 · $114/mo
- Expected delta
- +$298/yr (+$25/mo · 27.7%)
ⓘ Screening estimate from a state-policy table — verify with the county assessor before closing.
Climate risk First Street
- Flood 1/10 Low FEMA zone X · 0% chance over 30 yrs
- Wildfire 8/10 Severe
- Heat 6/10 Major 7 d/yr ≥103°F today · 21 d/yr by 30 yrs out
- Wind 2/10 Low 4% chance of damaging wind over 30 yrs
- Air quality 1/10 Low 0 unhealthy d/yr today · 0 by 30 yrs out
Nearby sold comps map
Loading sold comps map…
Walkable amenities ~0.75 mi
Loading nearby amenities…
Taxation est. · year 1
- Rental income
- $14,769
- − Mortgage interest
- −$4,201
- − Property taxes
- −$1,075
- − Insurance
- −$375
- − Repairs & maintenance
- −$1,181
- − Management
- −$1,181
- − Depreciation
- −$2,182
- Taxable income
- $4,573
- Est. tax owed @ 24.0%
- −$1,098
- After-tax cash flow
- $4,400/yr
For passive investors: Depreciation is non-cash, so a rental often shows a tax loss while cash-flowing — sheltering income. Rental losses are passive: they offset passive income freely, and up to $25,000/yr can offset ordinary (W-2) income if you actively participate and your MAGI is under $100k (phasing out to $0 by $150k); unused losses carry forward. On sale, claimed depreciation is recaptured at up to 25%, and gains may owe capital-gains tax (a 1031 exchange can defer both). Figures are a year-1 estimate at your 24.0% rate — not tax advice; consult a CPA.
Schools (NCES district)
- District
- Snyder ISD
- NCES district ID
- 4840650
- Math proficiency
- 33% ▼ -4.00%
- Reading proficiency
- 31% ▼ -1.00%
- Median HH income
- $48,075
- Composite
- 27.69/100
- National rank
- #6912
- State rank
- #577 of 826 in TX
Livability — Snyder
- Score
- 61/100
- State rank
- #1008
- US rank
- #17920
Category grades
Schools grade is shown separately in the Schools card above.
Census & demographics
- Census place
- Snyder, TX
- Population (ZIP)
- 15,505
Population outlook (Scurry County) Hauer SSP2
- Today (2025)
- 18,819 people
- By 2030
- 19,548 · +3.9%
- By 2040
- 21,178 · +12.5%
- By 2050
- 22,980 · +22.1%
- By 2075
- 27,055 · +43.8%
- By 2100
- 28,065 · +49.1%
Race, ethnicity, and origin ACS 2023
- Neighborhood character
- Diverse neighborhood (Simpson 0.58)
- Race & ethnicity
- White 48% Hispanic / Latino 44% Two or more races 14% Black 3% Native American 1%
- Hispanic origin (detail)
- Mexican 40%
- Common ancestry
- Slovak 1% Italian 1%
- Foreign-born
- 5% · Canada
- Languages at home
- 75% English-only · Spanish 25%
Political lean MEDSL · Scurry
- 2024 margin
- Solid R (+73.6) · D 12.8% · R 86.5%
- 2008→2024 swing
- -13.9pp toward R · 2008: -59.7pp · 2024: -73.6pp
- All cycles
- 2024: R+73.6 2020: R+71.0 2016: R+69.8 2012: R+65.4 2008: R+59.7
Not yet ingested
- Civics
- —
Market trends
- HPI YoY
- ▼ -96.76%
- Current HPI
- 137.2297
- Rent YoY
- —
- Metro
- —
- State GDP YoY
- ▲ 3.95%
- F500 in state
- 110
Industry mix (Fortune 500 HQ in TX)
| Industry | F500 HQs | Revenue |
|---|---|---|
| Energy | 16 | $1,198B |
|
||
| Technology | 5 | $198B |
|
||
| Engineering / Construction | 4 | $72B |
|
||
| Energy Services | 3 | $60B |
|
||
| Utilities | 3 | $41B |
|
||
| Healthcare | 2 | $330B |
|
||
Price history
-16.7% since first listed4 events — show timeline
- 2026-05-17 Price Changed $75,000 PBBOR
- 2026-04-28 Price Changed $82,000 PBBOR
- 2026-04-20 Listed $90,000 PBBOR
- 2003-10-16 Sold (Public Records) — Public Records
Property tax history
+6.0%/yrLatest (2025): $1,075 · +3.4% YoY. Source: county tax records.
Cash-flow waterfall
monthlySold comps — $/sqft
last 12 mo · ≤1 miLoading sold comps…