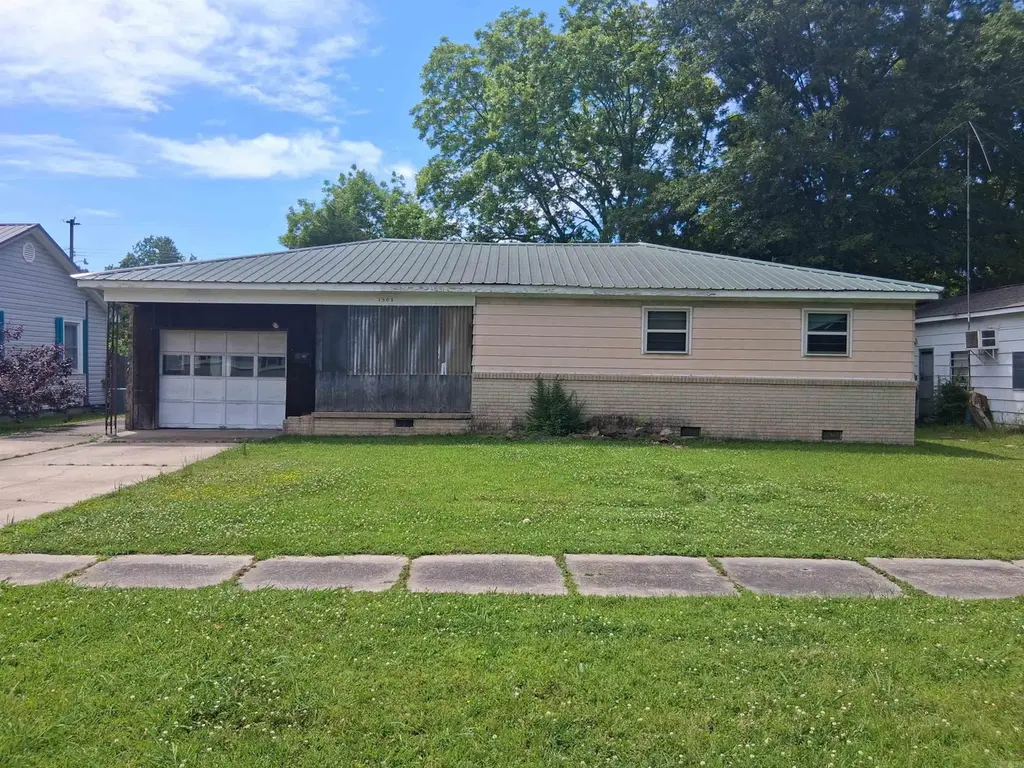
1508 S Porter St · Stuttgart, AR
Flood risk 1/10 · Minimal
- FEMA flood zone
- X (unshaded)
- Chance of flooding over 30 yrs
- 0.0%
- Est. flood insurance / yr
- $507 – $1,088
Fire risk 1/10 · Minimal
- Est. fire insurance / yr
- $1,499 – $2,785
Heat risk 6/10 · Moderate
- Hot days now (above 109°F)
- 7 days/yr
- Hot days in 30 yrs
- 19 days/yr
Wind risk 4/10 · Minor
- Chance of severe wind over 30 yrs
- 16.0%
Air-quality risk 1/10 · Minimal
- Unhealthy air days now
- 0 days/yr
- Unhealthy air days in 30 yrs
- 0 days/yr
Risk factors via First Street. Map © Google.
Why this score? — see what drove the B- grade
The composite is a weighted blend of 9 inputs, each scored 0–100. Each bar is that input's sub-score; the figure is the points it added to the 100-point composite (weight × sub-score).
- Cash flow +30.0/30.0
- 1% rule +10.0/10.0
- DSCR +10.0/10.0
- ARV discount +7.5/15.0
- Livability +3.2/5.0
- Rent growth +2.5/5.0
- Condition / age +2.5/5.0
- Schools +2.2/10.0
- Appreciation +0.0/10.0
$47,900
🖨 Deal sheet 📄 Offer letter ✓ Due diligence
Listing remarks
Opportunity awaits at 1508 S Porter Street in Stuttgart, AR! This 3 bedroom, 1 bathroom home offers approximately 1,812 square feet of living space with strong after-renovation value potential for investors, flippers, or buyers looking to add their personal touch. Inside you’ll find a spacious living room, large dining area, separate laundry room, and a functional layout with plenty of room to reimagine the space. Additional features include a 1-car garage, enclosed back porch situated on a concrete slab, and a large storage shed in the backyard for extra storage or workspace needs. Conveniently located with plenty of upside potential, this property is ready for its next chapter. Sche
Key facts
- Enclosed back porch
- Large dining area
- Functional layout
Tags
Property features AI
Finance
- Financial info: Financing: Conventional loan or cash
Exterior
- Parking: Parking for 3 cars
- Utilities: Public sewer; Public water; Electric service: Municipal (Entergy); Natural gas
- Home design: Inside city limits; Subdivision: Smith
- Construction: Brick and wood exterior; Metal roof; Crawl space foundation; Built on a 65x140 (0.2 acre) lot
- Exterior features: Partially fenced yard; Paved road access; Level lot
Interior
- Kitchen: Electric range; Refrigerator stays
- Flooring: Carpet; Vinyl; Tile
- Bathrooms: 1 full bathroom
- Heating & cooling: Heating/air: Other (see remarks)
- Interior features: Carpet, vinyl, and tile flooring; Den/Family room
Neighborhood map
What this means for you Summary
Snapshot
- This is a 3-bed/2.0-bath single-family listed at $48k.
Deal economics
- At list price, monthly cash flow is $666 ($8k/yr) — positive.
- The deal already cash-flows at list — no discount required.
- Meets the 1% rule at list price ($1k rent vs $48k).
- Recommended offer: $46k (3.0% below list) — sets the bar for market timing.
Location & tenants
- Location reads 64/100 on livability (#163 in AR) — a middle-class / working-renter tenant base. Strengths: cost of living A+, housing A+, health & safety A+; Watch: employment D, schools F, crime F.
- Stuttgart School District (town): math 28% / reading 24% proficiency, ranked #180 of 238 in AR (top 76%) — low school quality limits family demand, transient renter base, plan for 1-2y turnover.
- Market conditions: 39 active listings in the ZIP; 17 units permitted in Arkansas County in 2024 (0 in 5+ unit buildings).
Forward outlook
- Local home prices are declining (-3.0%/yr); year-one equity from $331 of loan paydown is wiped out by about $1k of value loss. Plan a longer hold.
- Arkansas County population projected at -19% by 2050 — secular population decline; favor cash flow + early exit over multi-decade hold.
- At projected returns (-3.0% appreciation + 3.0% rent growth), your $13k cash investment doubles in ~2 years — after that, you're playing with house money.
Negotiation context
- It's been on market 38 days — a 3% lower offer ($46k) is reasonable based on typical stale-listing flexibility.
Risks & watch-outs
- Climate carrying-cost: extreme-heat days projected 7→19/yr by 2055 (HVAC capex compounding) — expect insurance premiums to compound above CPI over the hold.
Questions for the listing agent
- It's been on market 38 days. Have you received any prior offers? Is the seller open to a 3% concession, seller financing, or rate buy-down credit?
- Is there a deadline driving the sale (1031 exchange, divorce, estate, relocation)? That informs how much negotiation room exists.
- Schools are F-rated, which usually means shorter tenancies and higher turnover. Who's the typical renter profile here, and what's been the actual vacancy rate?
- Crime grade is F in this area — have there been break-ins, vandalism, or insurance claims at this property in the last 3 years? What carrier currently insures it and at what premium?
- What's the average days-on-market for RENTAL listings here right now (not sales)? A rising rental-DOM trend means longer vacancies and softer asking-rent achievability than the comps imply.
- What's the recent tenant-quality profile in this submarket — average credit score on applications, eviction rate, late-payment / NSF rate, and stable-employment percentage? A property-management company in the area should have these aggregated.
- How much new for-sale + rental construction is in the pipeline within 1–3 miles? Heavy new supply typically softens prices + rents 12–24 months out; constrained supply supports both.
Investment metrics
- 1% rule
- 2.50% ✓
- Cap rate
- 22.97%
- Cash-on-cash
- 59.57%
- DSCR
- 3.65
- GRM
- 3.3
CMA / ARV
- ARV (median comp)
- $135,605
- List price
- $47,900
- Delta
- -64.68%
- Verdict
- UNDERPRICED
- Comps
- 20 within 1.0 mi
Show comp detail 12 sales within ~0.75 mi
| Address | Dist | Beds/Ba | Sqft | Sold | Price | $/sf | Match |
|---|---|---|---|---|---|---|---|
| 312 W 18th | 0.13mi | 3/2.0 | 1,752 (-3%) | 0mo | $140,000 | $80 | 88 |
| 1209 Crockett St | 0.31mi | 3/2.0 | 1,761 (-3%) | 16mo | $230,000 | $131 | 68 |
| 1210 W 16th | 0.57mi | 3/2.5 | 1,836 (+1%) | 8mo | $90,000 | $49 | 62 |
| 1702 S Prairie St | 0.43mi | 2/2.0 (-1) | 1,764 (-3%) | 17mo | $95,000 | $54 | 56 |
| 1618 South Pr | 0.42mi | 4/3.0 (+1) | 1,918 (+6%) | 9mo | $130,000 | $68 | 54 |
| 413 W 5th St | 0.65mi | 3/2.0 | 1,789 (-1%) | 16mo | $106,000 | $59 | 54 |
| 2110 S Prairie St | 0.70mi | 3/2.0 | 1,967 (+9%) | 0mo | $120,000 | $61 | 53 |
| 404 E 7th St | 0.64mi | 3/2.0 | 1,700 (-6%) | 13mo | $35,000 | $21 | 49 |
| 610 W 5th St | 0.72mi | 3/2.0 | 1,813 (+0%) | 20mo | $68,000 | $38 | 49 |
| 808 S College St | 0.50mi | 4/2.0 (+1) | 2,020 (+12%) | 8mo | $119,000 | $59 | 46 |
| 1814 Beumer St | 0.70mi | 3/2.0 | 1,962 (+8%) | 11mo | $232,000 | $118 | 44 |
| 1820 Beumer St | 0.71mi | 3/2.0 | 1,602 (-12%) | 5mo | $152,000 | $95 | 43 |
Match score weights: distance 35% · size 25% · config 20% · recency 20%. Top-matched comps best support the ARV.
Projected returns pro-forma
-3.0% appreciation · 3.0% rent growth · sell at horizon
- IRR
- 58.2%
- Equity multiple
- 3.58×
- Total profit
- $34,627
- Equity at exit
- $7,142
- IRR
- 63.1%
- Equity multiple
- 7.32×
- Total profit
- $84,703
- Equity at exit
- $4,142
Cash invested: $13,412 (down + closing). Projections, not guarantees.
Landlord ↔ Tenant lean methodology
- Overall (STATE)
- 92 Strongly Landlord-Friendly
- State Arkansas
- 92 Strongly Landlord-Friendly · R+14
- County
- — inherits STATE
- City
- — inherits STATE
ZIP-level market 72160
- Home prices YoY
- -31.9%
- Active inventory
- 39
- Price-to-rent
- 3.3×
Monthly cashflow live
- Estimated rent
- $1,200 medium interval (Pro) →
- Mortgage (P&I)
- −$251
- Tax from tax record
- −$11 /mo · $131/yr
- Insurance
- −$20
- HOA
- −$0
- Vacancy / Maint / Mgmt
- −$252
- Net cashflow
- $666
Break-even live
UW: 25.0% down · 7.5% · 30yr · 1.5% tax · 5.0% vac · 8.0% maint · 8.0% mgmt
Financing live
Cash to close
- Down payment
- $11,975
- Closing costs
- $1,437
- Reserves months
- —
- Total cash needed
- —
Loan-product check · same deal, 3 products live
Conventional
25% down · 7.5% · 30yr
- Down + closing
- —
- Monthly P&I
- —
- Monthly cashflow
- —
- DSCR
- —
- Eligible?
- —
Personal DTI + credit; lowest rate.
DSCR
20% down · 8.5% · 30yr
- Down + closing
- —
- Monthly P&I
- —
- Monthly cashflow
- —
- DSCR
- —
- Eligible?
- —
No personal income docs; deal must DSCR.
Hard money
10% down · 12.0% · 12mo
- Down + closing
- —
- Monthly P&I
- —
- Monthly cashflow
- —
- DSCR
- —
- Eligible?
- —
Short-term bridge; refi at stabilization.
Listing history 17 events
-
2026-06-19days on market $47,900 Active 38 DOM
-
2026-06-18days on market $47,900 Active 37 DOM
-
2026-06-17days on market $47,900 Active 36 DOM
-
2026-06-16days on market $47,900 Active 35 DOM
-
2026-06-15days on market $47,900 Active 34 DOM
-
2026-06-14days on market $47,900 Active 32 DOM
-
2026-06-12days on market $47,900 Active 31 DOM
-
2026-06-09days on market $47,900 Active 28 DOM
-
2026-06-08days on market $47,900 Active 27 DOM
-
2026-06-07days on market $47,900 Active 26 DOM
-
2026-06-07days on market $47,900 Active 25 DOM
-
2026-06-04days on market $47,900 Active 22 DOM
-
2026-06-02days on market $47,900 Active 21 DOM
-
2026-06-01days on market $47,900 Active 20 DOM
-
2026-05-31days on market $47,900 Active 19 DOM
-
2026-05-31days on market $47,900 Active 18 DOM
-
2026-05-10$47,900 New Listing 723-char remark
ⓘ Source: listings_history table (triggers on properties + properties_extension) + one-shot
backfill from property_details.listing_events for pre-trigger history.
Tax reassessment forecast AR · Resets to sale price
- Current annual tax
- $131 · $11/mo
- Projected year-2 tax
- $307 · $26/mo
- Expected delta
- +$175/yr (+$15/mo · 133.6%)
ⓘ Screening estimate from a state-policy table — verify with the county assessor before closing.
Climate risk First Street
- Flood 1/10 Low FEMA zone X (unshaded) · 0% chance over 30 yrs
- Wildfire 1/10 Low
- Heat 6/10 Major 7 d/yr ≥109°F today · 19 d/yr by 30 yrs out
- Wind 4/10 Moderate 16% chance of damaging wind over 30 yrs
- Air quality 1/10 Low 0 unhealthy d/yr today · 0 by 30 yrs out
Nearby sold comps map
Loading sold comps map…
Walkable amenities ~0.75 mi
Loading nearby amenities…
Taxation est. · year 1
- Rental income
- $14,397
- − Mortgage interest
- −$2,683
- − Property taxes
- −$131
- − Insurance
- −$240
- − Repairs & maintenance
- −$1,152
- − Management
- −$1,152
- − Depreciation
- −$1,393
- Taxable income
- $7,646
- Est. tax owed @ 24.0%
- −$1,835
- After-tax cash flow
- $6,154/yr
For passive investors: Depreciation is non-cash, so a rental often shows a tax loss while cash-flowing — sheltering income. Rental losses are passive: they offset passive income freely, and up to $25,000/yr can offset ordinary (W-2) income if you actively participate and your MAGI is under $100k (phasing out to $0 by $150k); unused losses carry forward. On sale, claimed depreciation is recaptured at up to 25%, and gains may owe capital-gains tax (a 1031 exchange can defer both). Figures are a year-1 estimate at your 24.0% rate — not tax advice; consult a CPA.
Schools (NCES district)
- District
- Stuttgart School District
- NCES district ID
- 0512960
- Math proficiency
- 28% ▼ -15.00%
- Reading proficiency
- 24% ▼ -6.00%
- Median HH income
- $38,851
- Composite
- 21.85/100
- National rank
- #8240
- State rank
- #180 of 238 in AR
Livability — Stuttgart
- Score
- 64/100
- State rank
- #163
- US rank
- #13757
Category grades
Schools grade is shown separately in the Schools card above.
Census & demographics
- Census place
- Stuttgart, AR
- Population (ZIP)
- 8,895
Population outlook (Arkansas County) Hauer SSP2
- Today (2025)
- 17,211 people
- By 2030
- 16,520 · -4.0%
- By 2040
- 15,158 · -11.9%
- By 2050
- 13,916 · -19.1%
- By 2075
- 11,278 · -34.5%
- By 2100
- 8,805 · -48.8%
Race, ethnicity, and origin ACS 2023
- Neighborhood character
- Majority White (57%)
- Race & ethnicity
- White 57% Black 38% Two or more races 4% Hispanic / Latino 2%
- Common ancestry
- Lithuanian 1% Slovak 1% Italian 1%
- Foreign-born
- 1% · Canada
- Languages at home
- 99% English-only · Spanish 1%
Political lean MEDSL · Arkansas
- 2024 margin
- Solid R (+44.1) · D 27.1% · R 71.2% · Other 1.7%
- 2008→2024 swing
- -21.7pp toward R · 2008: -22.4pp · 2024: -44.1pp
- All cycles
- 2024: R+44.1 2020: R+39.5 2016: R+30.6 2012: R+22.2 2008: R+22.4
Not yet ingested
- Civics
- —
Market trends
- HPI YoY
- ▼ -74.76%
- Current HPI
- 159.9216
- Rent YoY
- —
- Metro
- —
- State GDP YoY
- ▲ 3.80%
- F500 in state
- 10
Industry mix (Fortune 500 HQ in AR)
| Industry | F500 HQs | Revenue |
|---|---|---|
| Retail | 1 | $681B |
|
||
| Food / Agriculture | 1 | $53B |
|
||
| Retail / Energy | 1 | $22B |
|
||
| Transportation / Logistics | 1 | $12B |
|
||
| Energy | 1 | $4B |
|
||
Price history
1 event — show timeline
- 2026-05-10 Listed $47,900 CARMLS
Property tax history
-6.4%/yrLatest (2025): $131 · -43.2% YoY. Source: county tax records.
Cash-flow waterfall
monthlySold comps — $/sqft
last 12 mo · ≤1 miLoading sold comps…