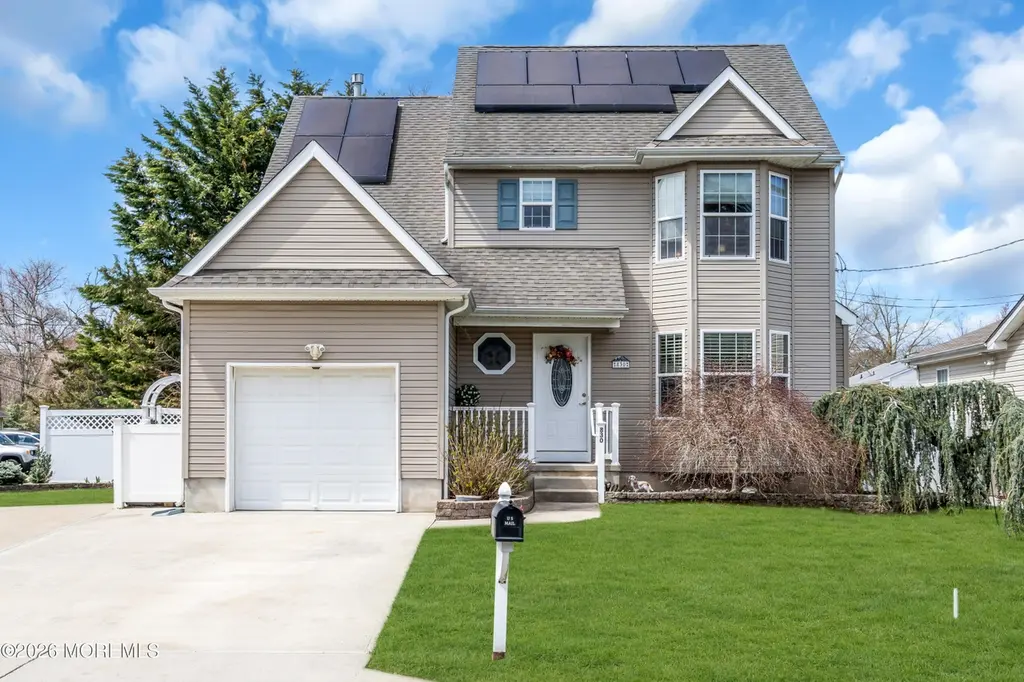
830 Deguise St · Forked River, NJ
Flood risk 8/10 · Major
- FEMA flood zone
- AE
- Chance of flooding over 30 yrs
- 0.99%
- Est. flood insurance / yr
- $1,737 – $8,500
Fire risk 4/10 · Minor
- Est. fire insurance / yr
- $526 – $976
Heat risk 7/10 · Major
- Hot days now (above 98°F)
- 7 days/yr
- Hot days in 30 yrs
- 15 days/yr
Wind risk 8/10 · Major
- Chance of severe wind over 30 yrs
- 80.0%
Air-quality risk 3/10 · Minor
- Unhealthy air days now
- 3 days/yr
- Unhealthy air days in 30 yrs
- 3 days/yr
Risk factors via First Street. Map © Google.
Why this score? — see what drove the B- grade
The composite is a weighted blend of 9 inputs, each scored 0–100. Each bar is that input's sub-score; the figure is the points it added to the 100-point composite (weight × sub-score).
- Cash flow +30.0/30.0
- 1% rule +10.0/10.0
- DSCR +10.0/10.0
- ARV discount +7.7/15.0
- Livability +3.1/5.0
- Schools +3.0/10.0
- Rent growth +2.5/5.0
- Condition / age +2.5/5.0
- Appreciation +0.0/10.0
$599,999
🖨 Deal sheet 📄 Offer letter ✓ Due diligence
Listing remarks MLS
Another Quality built Eastport home. New 4 bedroom 2.5 bath colonial with stone driveway in Lanoka Harbor. Loads of Extras! Ready for occupancy. MUST SEE!!
Key facts
- 8,276 sq ft lot
- Garage
- Built 2006
Property features AI
Exterior
- Parking: Attached garage with 1 parking space
- Utilities: Public sewer
- Home design: Fee simple ownership
- Exterior features: Timberline roof
Interior
- Kitchen: Dishwasher; Microwave; Gas cooking
- Bedrooms: 4 bedrooms
- Bathrooms: 2 full bathrooms and 1 half bathroom (2.5 total)
- Heating & cooling: Forced air heating; Central air conditioning
- Interior features: Includes blinds/shades; Hot tub
- Laundry & utility: Washer; Dryer; Refrigerator
Neighborhood map
What this means for you Summary
Snapshot
- This is a 4-bed/3.0-bath single-family listed at $600k.
Deal economics
- At list price, monthly cash flow is $3k ($34k/yr) — positive.
- The deal already cash-flows at list — no discount required.
- Meets the 1% rule at list price ($9k rent vs $600k).
- Cap rate 12.8% vs local median 3.2% in Forked River — top-decile yield for the area; either an underpriced asset or a hidden risk that comps aren't pricing in. Stress-test before assuming the spread holds.
Location & tenants
- Location reads 61/100 on livability (#464 in NJ) — a middle-class / working-renter tenant base. Strengths: housing A+, crime A-, employment A-; Watch: amenities F, commute F, cost of living F.
- Lacey Township School District (suburban): math 22% / reading 43% proficiency, ranked #299 of 472 in NJ (top 63%) — families likely to look elsewhere, expect single-tenant / working-renter base with shorter leases; only 19% free/reduced lunch — higher-income household profile.
- Market conditions: 57 active listings in the ZIP; 3 comparable units currently listed for rent nearby; rentals at typical pace (median 21d on market — plan ~3-4 weeks tenant-placement turnaround); 4,434 units permitted in Ocean County in 2024 (868 in 5+ unit buildings).
Forward outlook
- Local home prices are declining (-3.0%/yr); year-one equity from $4k of loan paydown is wiped out by about $18k of value loss. Plan a longer hold.
- Ocean County population projected to shrink 8% by 2050 — rents likely to lag national; underwrite the cash flow, not the appreciation.
- At projected returns (-3.0% appreciation + 3.0% rent growth), your $168k cash investment doubles in ~6 years — after that, you're playing with house money.
Negotiation context
- Only 12 days on market — expect competitive offers; lowballing is unlikely to land.
- 2 sale attempts since 20y ago with the ask held roughly flat each time — persistent listings suggest the price (not the market) is what's stuck; bring a comps-based counter.
- Current owner paid $315k; list at $600k implies a 90% gain — meaningful room to come down on a strong offer.
Risks & watch-outs
- Watch-outs: flood insurance adds $427/mo.
- Climate carrying-cost: in FEMA flood zone AE (mandatory federal flood insurance); severe wind risk, 80% chance of damaging wind over 30y; extreme-heat days projected 7→15/yr by 2055 (HVAC capex compounding) — expect insurance premiums to compound above CPI over the hold.
Questions for the listing agent
- What's the actual annual flood-insurance premium (NFIP or private), and is the property in a SFHA with mandatory coverage?
- Is there a deadline driving the sale (1031 exchange, divorce, estate, relocation)? That informs how much negotiation room exists.
- What's the average days-on-market for RENTAL listings here right now (not sales)? A rising rental-DOM trend means longer vacancies and softer asking-rent achievability than the comps imply.
- What's the recent tenant-quality profile in this submarket — average credit score on applications, eviction rate, late-payment / NSF rate, and stable-employment percentage? A property-management company in the area should have these aggregated.
- How much new for-sale + rental construction is in the pipeline within 1–3 miles? Heavy new supply typically softens prices + rents 12–24 months out; constrained supply supports both.
Investment metrics
- 1% rule
- 1.54% ✓
- Cap rate
- 12.82%
- Cash-on-cash
- 23.32%
- DSCR
- 2.04
- GRM
- 5.4
CMA / ARV
- ARV (on-the-fly)
- $603,288
- Comps found
- 12
Show comp detail 12 sales within ~0.75 mi
| Address | Dist | Beds/Ba | Sqft | Sold | Price | $/sf | Match |
|---|---|---|---|---|---|---|---|
| 830 Deguise St | 0.00mi | 4/2.5 | 1,862 (0%) | 1mo | $625,000 | $336 | 97 |
| 906 Bowsprit Pt | 0.27mi | 4/2.0 | 1,761 (-5%) | 0mo | $855,000 | $486 | 74 |
| 602 Drew Ave | 0.23mi | 3/2.5 (-1) | 1,701 (-9%) | 3mo | $450,000 | $265 | 65 |
| 409 Atlantic City Ct | 0.38mi | 4/2.0 | 1,760 (-6%) | 11mo | $740,000 | $420 | 60 |
| 935 Mallard Dr | 0.26mi | 3/2.0 (-1) | 1,699 (-9%) | 8mo | $537,000 | $316 | 57 |
| 406 Lawrence Dr | 0.49mi | 3/2.0 (-1) | 1,836 (-1%) | 11mo | $475,000 | $259 | 57 |
| 714 Laurel Blvd | 0.27mi | 3/2.5 (-1) | 2,083 (+12%) | 10mo | $710,000 | $341 | 52 |
| 307 Clairmore Ave | 0.54mi | 4/2.0 | 1,715 (-8%) | 12mo | $487,500 | $284 | 48 |
| 834 E Hickory Dr | 0.32mi | 3/1.5 (-1) | 1,603 (-14%) | 4mo | $520,000 | $324 | 47 |
| 308 Predmore Ave | 0.70mi | 3/2.0 (-1) | 1,794 (-4%) | 8mo | $465,000 | $259 | 45 |
| 409 Sinclair Ave | 0.40mi | 3/2.0 (-1) | 1,598 (-14%) | 5mo | $491,000 | $307 | 44 |
| 321 Lawrence Dr | 0.61mi | 3/2.0 (-1) | 1,702 (-9%) | 7mo | $579,000 | $340 | 42 |
Match score weights: distance 35% · size 25% · config 20% · recency 20%. Top-matched comps best support the ARV.
Projected returns pro-forma
-3.0% appreciation · 3.0% rent growth · sell at horizon
- IRR
- 12.5%
- Equity multiple
- 1.50×
- Total profit
- $83,873
- Equity at exit
- $89,462
- IRR
- 21.5%
- Equity multiple
- 2.83×
- Total profit
- $307,122
- Equity at exit
- $51,877
Cash invested: $168,000 (down + closing). Projections, not guarantees.
Landlord ↔ Tenant lean methodology
- Overall (STATE)
- 21 Tenant-Leaning
- State New Jersey
- 21 Tenant-Leaning · D+6
- County
- — inherits STATE
- City
- — inherits STATE
ZIP-level market 08734
- Active inventory
- 57
- Price-to-rent
- 5.4×
Monthly cashflow live
- Estimated rent
- $9,219 medium interval (Pro) →
- Mortgage (P&I)
- −$3,146
- Tax from tax record
- −$621 /mo · $7,456/yr
- Insurance
- −$250
- Flood insurance flood zone
- −$427 /mo · $5,118/yr
- HOA
- −$0
- Vacancy / Maint / Mgmt
- −$1,936
- Net cashflow
- $2,838
Break-even live
UW: 25.0% down · 7.5% · 30yr · 1.5% tax · 5.0% vac · 8.0% maint · 8.0% mgmt
Financing live
Cash to close
- Down payment
- $150,000
- Closing costs
- $18,000
- Reserves months
- —
- Total cash needed
- —
Loan-product check · same deal, 3 products live
Conventional
25% down · 7.5% · 30yr
- Down + closing
- —
- Monthly P&I
- —
- Monthly cashflow
- —
- DSCR
- —
- Eligible?
- —
Personal DTI + credit; lowest rate.
DSCR
20% down · 8.5% · 30yr
- Down + closing
- —
- Monthly P&I
- —
- Monthly cashflow
- —
- DSCR
- —
- Eligible?
- —
No personal income docs; deal must DSCR.
Hard money
10% down · 12.0% · 12mo
- Down + closing
- —
- Monthly P&I
- —
- Monthly cashflow
- —
- DSCR
- —
- Eligible?
- —
Short-term bridge; refi at stabilization.
Rent comps 3 comps
| Address | Beds | Baths | Sqft | Rent | $/sqft | DOM | Units | Dist |
|---|---|---|---|---|---|---|---|---|
| 406 Lawrence Dr Lanoka Harbor, NJ | 3.0 | 2.0 | 1836 | $16,000 | $8.71 | 1d | 1 | 0.49mi |
| 209 Sinclair Ave Lanoka Harbor, NJ | 3.0 | 1.0 | 1352 | $3,000 | $2.22 | 43d | 1 | 0.64mi |
| 209 Sinclair Ave Lanoka Harbor, NJ | 3.0 | 1.0 | 1352 | $3,300 | $2.44 | 20d | 1 | 0.64mi |
Listing history 7 events
-
2026-04-21status Pending
-
2026-04-16price $599,999
-
2026-04-09$625,000 Active
-
2026-04-04historical $625,000
-
2007-05-01soldstatus $315,000 155-char remark
Show marketing remark (155 chars)
Another Quality built Eastport home. New 4 bedroom 2.5 bath colonial with stone driveway in Lanoka Harbor. Loads of Extras! Ready for occupancy. MUST SEE!!
-
2007-05-01soldstatus $37,500
Show marketing remark (155 chars)
Another Quality built Eastport home. New 4 bedroom 2.5 bath colonial with stone driveway in Lanoka Harbor. Loads of Extras! Ready for occupancy. MUST SEE!!
-
2006-02-09$323,000 155-char remark
Show marketing remark (155 chars)
Another Quality built Eastport home. New 4 bedroom 2.5 bath colonial with stone driveway in Lanoka Harbor. Loads of Extras! Ready for occupancy. MUST SEE!!
ⓘ Source: listings_history table (triggers on properties + properties_extension) + one-shot
backfill from property_details.listing_events for pre-trigger history.
Tax reassessment forecast NJ · Partial reset (capped growth)
- Current annual tax
- $7,456 · $621/mo
- Projected year-2 tax
- $11,198 · $933/mo
- Expected delta
- +$3,742/yr (+$312/mo · 50.2%)
ⓘ Screening estimate from a state-policy table — verify with the county assessor before closing.
Climate risk First Street
- Flood 8/10 Severe FEMA zone AE · 99% chance over 30 yrs
- Wildfire 4/10 Moderate
- Heat 7/10 Severe 7 d/yr ≥98°F today · 15 d/yr by 30 yrs out
- Wind 8/10 Severe 80% chance of damaging wind over 30 yrs
- Air quality 3/10 Moderate 3 unhealthy d/yr today · 3 by 30 yrs out
Nearby sold comps map
Loading sold comps map…
Walkable amenities ~0.75 mi
Loading nearby amenities…
Taxation est. · year 1
- Rental income
- $110,623
- − Mortgage interest
- −$33,609
- − Property taxes
- −$7,456
- − Insurance
- −$8,118
- − Repairs & maintenance
- −$8,850
- − Management
- −$8,850
- − Depreciation
- −$17,455
- Taxable income
- $26,285
- Est. tax owed @ 24.0%
- −$6,308
- After-tax cash flow
- $27,752/yr
For passive investors: Depreciation is non-cash, so a rental often shows a tax loss while cash-flowing — sheltering income. Rental losses are passive: they offset passive income freely, and up to $25,000/yr can offset ordinary (W-2) income if you actively participate and your MAGI is under $100k (phasing out to $0 by $150k); unused losses carry forward. On sale, claimed depreciation is recaptured at up to 25%, and gains may owe capital-gains tax (a 1031 exchange can defer both). Figures are a year-1 estimate at your 24.0% rate — not tax advice; consult a CPA.
Schools (NCES district)
- District
- Lacey Township School District
- NCES district ID
- 3408100
- Math proficiency
- 22% ▼ -18.00%
- Reading proficiency
- 43% ▼ -11.00%
- Median HH income
- $73,331
- Composite
- 30.42/100
- National rank
- #6242
- State rank
- #299 of 472 in NJ
Livability — Forked River
- Score
- 61/100
- State rank
- #464
- US rank
- #17753
Category grades
Schools grade is shown separately in the Schools card above.
Census & demographics
- Population (ZIP)
- 8,028
Population outlook (Ocean County) Hauer SSP2
- Today (2025)
- 586,991 people
- By 2030
- 581,403 · -1.0%
- By 2040
- 564,913 · -3.8%
- By 2050
- 538,149 · -8.3%
- By 2075
- 468,845 · -20.1%
- By 2100
- 350,297 · -40.3%
Race, ethnicity, and origin ACS 2023
- Neighborhood character
- Predominantly White (93%)
- Race & ethnicity
- White 93% Hispanic / Latino 5% Two or more races 3%
- Common ancestry
- Romanian 7% Subsaharan African 3% Slovak 3%
- Foreign-born
- 2% · Canada
- Languages at home
- 98% English-only · Spanish 1%
Political lean MEDSL · Ocean
- 2024 margin
- Solid R (+36.0) · D 31.4% · R 67.4% · Other 1.2%
- 2008→2024 swing
- -17.6pp toward R · 2008: -18.4pp · 2024: -36.0pp
- All cycles
- 2024: R+36.0 2020: R+28.7 2016: R+34.0 2012: R+17.7 2008: R+18.4
Not yet ingested
- Civics
- —
Market trends
- HPI YoY
- ▼ -225.83%
- Current HPI
- 368.8557
- Rent YoY
- —
- Metro
- —
- State GDP YoY
- ▲ 2.05%
- F500 in state
- 34
Industry mix (Fortune 500 HQ in NJ)
| Industry | F500 HQs | Revenue |
|---|---|---|
| Consumer Goods | 3 | $31B |
|
||
| Pharmaceuticals | 2 | $153B |
|
||
| Technology | 2 | $21B |
|
||
| Insurance | 2 | $20B |
|
||
| Healthcare | 2 | $19B |
|
||
| Financial Services | 1 | $70B |
|
||
Price history
+85.8% since first listed7 events — show timeline
- 2026-04-21 Pending — MOMLS
- 2026-04-16 Price Changed $599,999 MOMLS
- 2026-04-09 Listed $625,000 MOMLS
- 2026-04-04 Coming Soon $625,000 MOMLS
- 2007-05-01 Sold (Public Records) $37,500 Public Records
- 2007-05-01 Sold (MLS) $315,000 BRIGHT MLS
- 2006-02-09 Listed $323,000 BRIGHT MLS
Property tax history
+3.5%/yrLatest (2025): $7,456 · +7.9% YoY. Source: county tax records.
Cash-flow waterfall
monthlySold comps — $/sqft
last 12 mo · ≤1 miLoading sold comps…