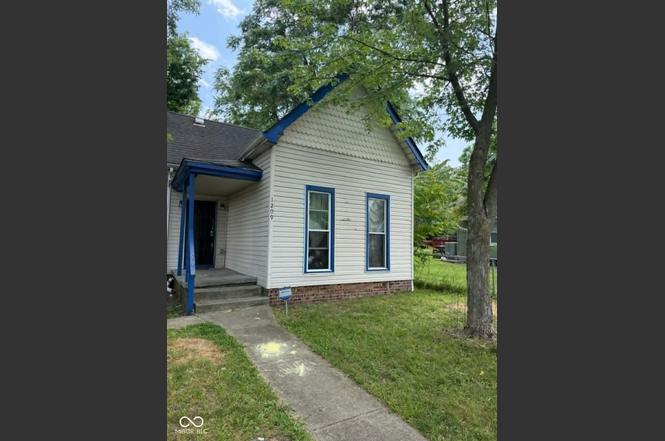
1209 W 29th · Indianapolis city (balance), IN
Flood risk 5/10 · Moderate
- FEMA flood zone
- X (unshaded)
- Chance of flooding over 30 yrs
- 0.66%
- Est. flood insurance / yr
- $507 – $1,088
Fire risk 1/10 · Minimal
- Est. fire insurance / yr
- $717 – $1,331
Heat risk 4/10 · Minor
- Hot days now (above 101°F)
- 7 days/yr
- Hot days in 30 yrs
- 19 days/yr
Wind risk 2/10 · Minimal
- Chance of severe wind over 30 yrs
- 0.0%
Air-quality risk 4/10 · Minor
- Unhealthy air days now
- 5 days/yr
- Unhealthy air days in 30 yrs
- 7 days/yr
Risk factors via First Street. Map © Google.
Why this score? — see what drove the B grade
The composite is a weighted blend of 9 inputs, each scored 0–100. Each bar is that input's sub-score; the figure is the points it added to the 100-point composite (weight × sub-score).
- Cash flow +29.8/30.0
- ARV discount +15.0/15.0
- DSCR +10.0/10.0
- 1% rule +8.5/10.0
- Rent growth +4.1/5.0
- Livability +2.5/5.0
- Condition / age +2.5/5.0
- Schools +1.4/10.0
- Appreciation +0.0/10.0
$83,500
🖨 Deal sheet (PDF) 📄 Offer letter ✓ Due diligence
Listing remarks MLS
PRICED TO SELL FOR THE INVESTOR, HOME NEEDS SOME REPAIRS, HAS NICE 1C-D GARAGE, WAS LISTED AT $35,000. BASEMENT HAS OUTSIDE ACCESS. MUST PROVIDE PROOF OF FUNDS OR PREQUAL. LTR WITH OFFER. ALL OFFERS SUBJECT TO SELLER AD DENDUMS.
Key facts
- Spacious yard
- Easy access
- Conveniently located
Tags
Property features AI
Exterior
- Parking: Detached 1-car garage (approx. 240 sq ft)
- Utilities: Public water; Municipal sewer connected; Solid waste service available
- Home design: Single family residence; One story
- Construction: Aluminum siding; Other type foundation
- Exterior features: Less than 1/4 acre lot; Lot size approximately 0.09 acres
Interior
- Kitchen: Kitchen on main level (10x10); No appliances included
- Bedrooms: 2 bedrooms on the main level (one is 10x10)
- Bathrooms: 1 full bathroom
- Heating & cooling: Forced air heating (natural gas); Central air conditioning
- Interior features: Attic access
- Laundry & utility: No specific laundry or utility appliances listed
Neighborhood map
What this means for you Summary
Snapshot
- This is a 2-bed/1.0-bath single-family listed at $84k.
Deal economics
- At list price, monthly cash flow is $307 ($4k/yr) — positive.
- The deal already cash-flows at list — no discount required.
- Meets the 1% rule at list price ($1k rent vs $84k).
- Cap rate 10.7% vs local median 4.4% in Indianapolis city (balance) — top-decile yield for the area; either an underpriced asset or a hidden risk that comps aren't pricing in. Stress-test before assuming the spread holds.
Location & tenants
- Location reads: area grade B — affects rentability + tenant quality, not the cash-flow math above.
- Indianapolis Public Schools (urban): math 14% / reading 20% proficiency, ranked #286 of 301 in IN (top 95%) — low school quality limits family demand, transient renter base, plan for 1-2y turnover; 77% free/reduced lunch — lower-income household profile, screen leases tightly.
- Zoned schools: Center For Inquiry School 27 (math 25% / reading 29%, grade F, #737 of 994 statewide, top 76%, 525 students, 51% FRL); H L Harshman Middle School (math 3% / reading 16%, grade F, #316 of 330 statewide, top 96%, 549 students, 84% FRL).
- Market conditions: Rents rising fast (+6.4%/yr); 283 active listings in the ZIP; 40 comparable units currently listed for rent nearby; rentals at typical pace (median 26d on market — plan ~3-4 weeks tenant-placement turnaround); 40% of comp listings sitting > 30 days — soft ceiling on asking rent; 1,906 units permitted in Marion County in 2024 (621 in 5+ unit buildings).
Forward outlook
- Local home prices are declining (-3.0%/yr); year-one equity from $577 of loan paydown is wiped out by about $3k of value loss. Plan a longer hold.
- Marion County population projected at +18% by 2050 — long-run rental-demand tailwind backs the buy-and-hold thesis.
- At projected returns (-3.0% appreciation + 6.4% rent growth), your $23k cash investment doubles in ~7 years — after that, you're playing with house money.
Negotiation context
- Only 5 days on market — expect competitive offers; lowballing is unlikely to land.
- 3 sale attempts since 25y ago with the ask held roughly flat each time — persistent listings suggest the price (not the market) is what's stuck; bring a comps-based counter.
- Current owner paid $15k; list at $84k implies a 457% gain — meaningful room to come down on a strong offer.
Risks & watch-outs
- Watch-outs: built in 1900 — expect roof / HVAC / electrical / plumbing capex.
- Climate carrying-cost: moderate flood risk — expect insurance premiums to compound above CPI over the hold.
Questions for the listing agent
- Built in 1900 — when were the roof, HVAC, electrical panel, plumbing, and water heater last replaced?
- Is there a deadline driving the sale (1031 exchange, divorce, estate, relocation)? That informs how much negotiation room exists.
- What's the average days-on-market for RENTAL listings here right now (not sales)? A rising rental-DOM trend means longer vacancies and softer asking-rent achievability than the comps imply.
- What's the recent tenant-quality profile in this submarket — average credit score on applications, eviction rate, late-payment / NSF rate, and stable-employment percentage? A property-management company in the area should have these aggregated.
- How much new for-sale + rental construction is in the pipeline within 1–3 miles? Heavy new supply typically softens prices + rents 12–24 months out; constrained supply supports both.
Investment metrics
- 1% rule
- 1.35% ✓
- Cap rate
- 10.71%
- Cash-on-cash
- 15.77%
- DSCR
- 1.70
- GRM
- 6.2
CMA / ARV
- ARV (on-the-fly)
- $127,500
- Comps found
- 3
Show comp detail 3 sales within ~0.75 mi
| Address | Dist | Beds/Ba | Sqft | Sold | Price | $/sf | Match |
|---|---|---|---|---|---|---|---|
| 1156 Udell St | 0.07mi | 2/1.0 | 808 (+8%) | 15mo | $137,000 | $170 | 72 |
| 1352 Edgemont Ave | 0.46mi | 3/1.5 (+1) | 690 (-8%) | 20mo | $185,000 | $268 | 41 |
| 2173 Gent Ave | 0.74mi | 2/1.0 | 660 (-12%) | 10mo | $60,000 | $91 | 37 |
Match score weights: distance 35% · size 25% · config 20% · recency 20%. Top-matched comps best support the ARV.
Projected returns pro-forma
-3.0% appreciation · 6.43% rent growth · sell at horizon
- IRR
- 10.5%
- Equity multiple
- 1.43×
- Total profit
- $10,089
- Equity at exit
- $12,450
- IRR
- 22.2%
- Equity multiple
- 3.22×
- Total profit
- $51,800
- Equity at exit
- $7,220
Cash invested: $23,380 (down + closing). Projections, not guarantees.
Landlord ↔ Tenant lean methodology
- Overall (STATE)
- 90 Strongly Landlord-Friendly
- State Indiana
- 90 Strongly Landlord-Friendly · R+11
- County
- — inherits STATE
- City
- — inherits STATE
ZIP-level market 46208
- Rents YoY
- 6.4%
- Active inventory
- 283
- Price-to-rent
- 6.2×
Monthly cashflow live
- Estimated rent
- $1,128 high interval (Pro) →
- Mortgage (P&I)
- −$438
- Tax from tax record
- −$111 /mo · $1,330/yr
- Insurance
- −$35
- HOA
- −$0
- Vacancy / Maint / Mgmt
- −$237
- Net cashflow
- $307
Break-even live
Sensitivity live
| Price | -10% $355 | -5% $331 | +0% $307 | +5% $284 | +10% $260 |
|---|---|---|---|---|---|
| Rent | -10% $218 | -5% $263 | +0% $307 | +5% $352 | +10% $396 |
| Rate | -1.0pp $349 | -0.5pp $329 | base $307 | +0.5pp $286 | +1.0pp $264 |
UW: 25.0% down · 7.5% · 30yr · 1.5% tax · 5.0% vac · 8.0% maint · 8.0% mgmt
Financing live
Cash to close
- Down payment
- $20,875
- Closing costs
- $2,505
- Reserves months
- —
- Total cash needed
- —
Loan-product check · same deal, 3 products live
Conventional
25% down · 7.5% · 30yr
- Down + closing
- —
- Monthly P&I
- —
- Monthly cashflow
- —
- DSCR
- —
- Eligible?
- —
Personal DTI + credit; lowest rate.
DSCR
20% down · 8.5% · 30yr
- Down + closing
- —
- Monthly P&I
- —
- Monthly cashflow
- —
- DSCR
- —
- Eligible?
- —
No personal income docs; deal must DSCR.
Hard money
10% down · 12.0% · 12mo
- Down + closing
- —
- Monthly P&I
- —
- Monthly cashflow
- —
- DSCR
- —
- Eligible?
- —
Short-term bridge; refi at stabilization.
Rent comps 40 comps
| Address | Beds | Baths | Sqft | Rent | $/sqft | DOM | Units | Dist |
|---|---|---|---|---|---|---|---|---|
| 1227 W 29th St Indianapolis, IN | 3.0 | 1.5 | 1056 | $1,250 | $1.18 | 25d | 1 | 0.03mi |
| 1319 W 27th St Indianapolis, IN | 2.0 | 1.0 | 651 | $900 | $1.38 | 14d | 1 | 0.24mi |
| 1341 W Congress Ave Unit 1343 Indianapolis, IN | 1.0 | 1.0 | 600 | $750 | $1.25 | 46d | 1 | 0.33mi |
| 1457 W 29th St Indianapolis, IN | 2.0 | 1.0 | 686 | $995 | $1.45 | 22d | 1 | 0.34mi |
| 1214 W 25th St Indianapolis, IN | 1.0 | 1.0 | 800 | $775 | $0.97 | 25d | 1 | 0.35mi |
| 1261 W 32nd St Indianapolis, IN | 2.0 | 1.0 | 832 | $975 | $1.17 | 46d | 1 | 0.35mi |
| 1519 W 28th St Indianapolis, IN | 2.0 | 1.0 | 816 | $895 | $1.10 | 46d | 1 | 0.40mi |
| 1244 Edgemont Ave Indianapolis, IN | 2.0 | 1.0 | 1092 | $1,275 | $1.17 | 46d | 1 | 0.42mi |
| 1460 W 32nd St Indianapolis, IN | 1.0 | 1.0 | 576 | $847 | $1.47 | 25d | 1 | 0.48mi |
| 1470 W 32nd St Indianapolis, IN | 2.0 | 1.0 | 700 | $1,000 | $1.43 | 46d | 1 | 0.50mi |
| 970 Edgemont Ave Indianapolis, IN | 2.0 | 1.0 | 740 | $845 | $1.14 | 6d | 1 | 0.50mi |
| 970 Edgemont Ave Indianapolis, IN | 2.0 | 1.0 | 740 | $845 | $1.14 | 0d | 1 | 0.50mi |
| 926 W 32nd St Indianapolis, IN | 3.0 | 2.0 | 1050 | $1,295 | $1.23 | 9d | 1 | 0.50mi |
| 3440 N Harding St Indianapolis, IN | 2.0 | 1.0 | 754 | $1,275 | $1.69 | 22d | 1 | 0.59mi |
| 3440 N Harding St Indianapolis, IN | 2.0 | 1.0 | 754 | $1,325 | $1.76 | 46d | 1 | 0.59mi |
| 906 Burdsal Pkwy Indianapolis, IN | 2.0 | 1.0 | 936 | $1,295 | $1.38 | 25d | 1 | 0.61mi |
| 908 Burdsal Pkwy Marion, IN | 2.0 | 1.0 | 936 | $1,300 | $1.39 | 25d | 1 | 0.61mi |
| 1039 W 36th St Indianapolis, IN | 2.0 | 1.0 | 864 | $995 | $1.15 | 46d | 1 | 0.66mi |
| 1138 36th St Unit 1 Indianapolis, IN | 1.0 | 1.0 | 900 | $885 | $0.98 | 22d | 1 | 0.66mi |
| 819 Edgemont Ave Apt 115 Indianapolis, IN | 1.0 | 1.0 | 540 | $915 | $1.69 | 46d | 1 | 0.67mi |
| 2248 N Harding St Indianapolis, IN | 2.0 | 1.0 | 1100 | $899 | $0.82 | 25d | 1 | 0.68mi |
| 1367 W Pruitt St Indianapolis, IN | 3.0 | 1.0 | 1088 | $1,450 | $1.33 | 46d | 1 | 0.69mi |
| 541 W 29th St Indianapolis, IN | 1.0 | 1.0 | 740 | $900 | $1.22 | 22d | 1 | 0.72mi |
| 538 W 29th St Unit B Indianapolis, IN | 3.0 | 1.0 | 1031 | $1,349 | $1.31 | 0d | 1 | 0.72mi |
| 1415 W Pruitt St Indianapolis, IN | 3.0 | 1.0 | 1001 | $1,249 | $1.25 | 25d | 1 | 0.73mi |
| 516 W 28th St Indianapolis, IN | 2.0 | 1.0 | 1005 | $1,100 | $1.09 | 25d | 1 | 0.77mi |
| 3017 Ethel Ave Indianapolis, IN | 3.0 | 1.5 | 1079 | $1,400 | $1.30 | 25d | 1 | 0.78mi |
| 2937 Shriver Ave Indianapolis, IN | 1.0 | 1.0 | 564 | $850 | $1.51 | 46d | 1 | 0.94mi |
| 524 W 23rd St Indianapolis, IN | 2.0 | 1.0 | 664 | $949 | $1.43 | 46d | 1 | 0.95mi |
| 524 W 23rd St Unit 2 Indianapolis, IN | 2.0 | 1.0 | 669 | $949 | $1.42 | 0d | 1 | 0.95mi |
| 2316 Indianapolis Ave Indianapolis, IN | 1.0 | 1.0 | 550 | $800 | $1.45 | 16d | 1 | 0.97mi |
| 2235 Doctor Martin Luther King Junior St Indianapolis, IN | 3.0 | 1.5 | 948 | $1,700 | $1.79 | 46d | 1 | 0.99mi |
| 2818 N Capitol Ave Apt 1 Indianapolis, IN | 1.0 | 1.0 | 600 | $2,000 | $3.33 | 46d | 1 | 1.14mi |
| 2808 N Capitol Ave Indianapolis, IN | 2.0 | 1.0 | 900 | $975 | $1.08 | 25d | 1 | 1.14mi |
| 1228 W 18th St Indianapolis, IN | 2.0 | 1.0 | 1050 | $1,200 | $1.14 | 46d | 1 | 1.15mi |
| 2602 Mansion Dr Indianapolis, IN | 2.0–3.0 | 2.0 | 1850 | $1,379 | $0.75 | 9d | 6 | 1.20mi |
| 2937 N Kenwood Ave Unit A Indianapolis, IN | 1.0 | 1.0 | 672 | $889 | $1.32 | 24d | 1 | 1.23mi |
| 3413 N Capitol Ave Indianapolis, IN | 3.0 | 1.0 | 588 | $1,299 | $2.21 | 25d | 1 | 1.34mi |
| 3469 Graceland Ave Indianapolis, IN | 2.0 | 1.0 | 1000 | $1,200 | $1.20 | 46d | 1 | 1.34mi |
| 55 W Fall Creek Parkway South Dr Unit C Indianapolis, IN | 2.0 | 1.0 | 1000 | $1,035 | $1.03 | 46d | 1 | 1.36mi |
Listing history 4 events
-
2026-06-21days on market $83,500 Active 5 DOM
-
2026-06-18days on market $83,500 Active 2 DOM
-
2026-06-16remarks 437-char remark
-
2026-06-16$83,500 Active 1 DOM
ⓘ Source: listings_history table (triggers on properties + properties_extension) + one-shot
backfill from property_details.listing_events for pre-trigger history.
Tax reassessment forecast IN · Partial reset (capped growth)
- Current annual tax
- $1,330 · $111/mo
- Projected year-2 tax
- $1,330 · $111/mo
- Expected delta
- $0/yr ($0/mo · 0.0%)
ⓘ Screening estimate from a state-policy table — verify with the county assessor before closing.
Climate risk First Street
- Flood 5/10 Major FEMA zone X (unshaded) · 66% chance over 30 yrs
- Wildfire 1/10 Low
- Heat 4/10 Moderate 7 d/yr ≥101°F today · 19 d/yr by 30 yrs out
- Wind 2/10 Low 0% chance of damaging wind over 30 yrs
- Air quality 4/10 Moderate 5 unhealthy d/yr today · 7 by 30 yrs out
Nearby sold comps map
Loading sold comps map…
Walkable amenities ~0.75 mi
Loading nearby amenities…
Taxation est. · year 1
- Rental income
- $13,532
- − Mortgage interest
- −$4,677
- − Property taxes
- −$1,330
- − Insurance
- −$418
- − Repairs & maintenance
- −$1,083
- − Management
- −$1,083
- − Depreciation
- −$2,429
- Taxable income
- $2,513
- Est. tax owed @ 24.0%
- −$603
- After-tax cash flow
- $3,085/yr
For passive investors: Depreciation is non-cash, so a rental often shows a tax loss while cash-flowing — sheltering income. Rental losses are passive: they offset passive income freely, and up to $25,000/yr can offset ordinary (W-2) income if you actively participate and your MAGI is under $100k (phasing out to $0 by $150k); unused losses carry forward. On sale, claimed depreciation is recaptured at up to 25%, and gains may owe capital-gains tax (a 1031 exchange can defer both). Figures are a year-1 estimate at your 24.0% rate — not tax advice; consult a CPA.
Schools (NCES district)
- District
- Indianapolis Public Schools
- NCES district ID
- 1804770
- Math proficiency
- 14% ▼ -7.00%
- Reading proficiency
- 20% ▼ -3.00%
- Median HH income
- $32,034
- Composite
- 13.69/100
- National rank
- #9499
- State rank
- #286 of 301 in IN
Livability — Indianapolis city (balance)
No livability data for this city. (Only ~50 U.S. cities are tracked.)
Census & demographics
- Census place
- Indianapolis city (balance), IN
- County
- Marion County · 998,460 people
- City population
- 881,119
- Metro
- Indianapolis-Carmel-Anderson, IN
- Population (ZIP)
- 22,379
- Household income
- $60,062
- Rent vs Own
- Severe rent burden
- 978.0
Population outlook (Marion County) Hauer SSP2
- Today (2025)
- 1,025,572 people
- By 2030
- 1,065,727 · +3.9%
- By 2040
- 1,141,577 · +11.3%
- By 2050
- 1,208,920 · +17.9%
- By 2075
- 1,367,288 · +33.3%
- By 2100
- 1,438,201 · +40.2%
Race, ethnicity, and origin ACS 2023
- Neighborhood character
- Diverse neighborhood (Simpson 0.62)
- Race & ethnicity
- White 46% Black 40% Hispanic / Latino 8% Two or more races 6% Asian 2%
- Hispanic origin (detail)
- Mexican 4%
- Common ancestry
- Romanian 2% Slovak 2% Italian 1%
- Foreign-born
- 4% · Canada
- Languages at home
- 93% English-only · Spanish 5% French/Haitian/Cajun 1% Other Indo-European 1%
Political lean MEDSL · Marion
- 2024 margin
- Strong D (+27.7) · D 63.0% · R 35.3% · Other 1.7%
- 2008→2024 swing
- -0.7pp no change · 2008: 28.4pp · 2024: 27.7pp
- All cycles
- 2024: D+27.7 2020: D+29.1 2016: D+22.8 2012: D+22.2 2008: D+28.4
Not yet ingested
- Civics
- —
Market trends
- HPI YoY
- ▼ -324.63%
- Current HPI
- 319.7725
- Rent YoY
- ▲ 6.43%
- Metro
- Indianapolis-Carmel-Anderson, IN
- State GDP YoY
- ▲ 2.90%
- F500 in state
- 18
Industry mix (Fortune 500 HQ in IN)
| Industry | F500 HQs | Revenue |
|---|---|---|
| Industrial Machinery | 2 | $37B |
|
||
| Healthcare | 1 | $177B |
|
||
| Pharmaceuticals | 1 | $45B |
|
||
| Metals / Steel | 1 | $18B |
|
||
| Agriculture | 1 | $17B |
|
||
| Packaging | 1 | $12B |
|
||
Price history
+138.6% since first listed5 events — show timeline
- 2026-06-16 Listed $83,500 MIBOR as Distributed by MLS Grid
- 2002-10-15 Sold (MLS) $15,000 MIBOR as Distributed by MLS Grid
- 2002-08-09 Listed $18,000 MIBOR as Distributed by MLS Grid
- 2002-01-23 Listing Removed — MIBOR as Distributed by MLS Grid
- 2001-07-23 Listed $35,000 MIBOR as Distributed by MLS Grid
Property tax history
+17.3%/yrLatest (2025): $1,330 · +8.7% YoY. Source: county tax records.
Cash-flow waterfall
monthlySold comps — $/sqft
last 12 mo · ≤1 miLoading sold comps…