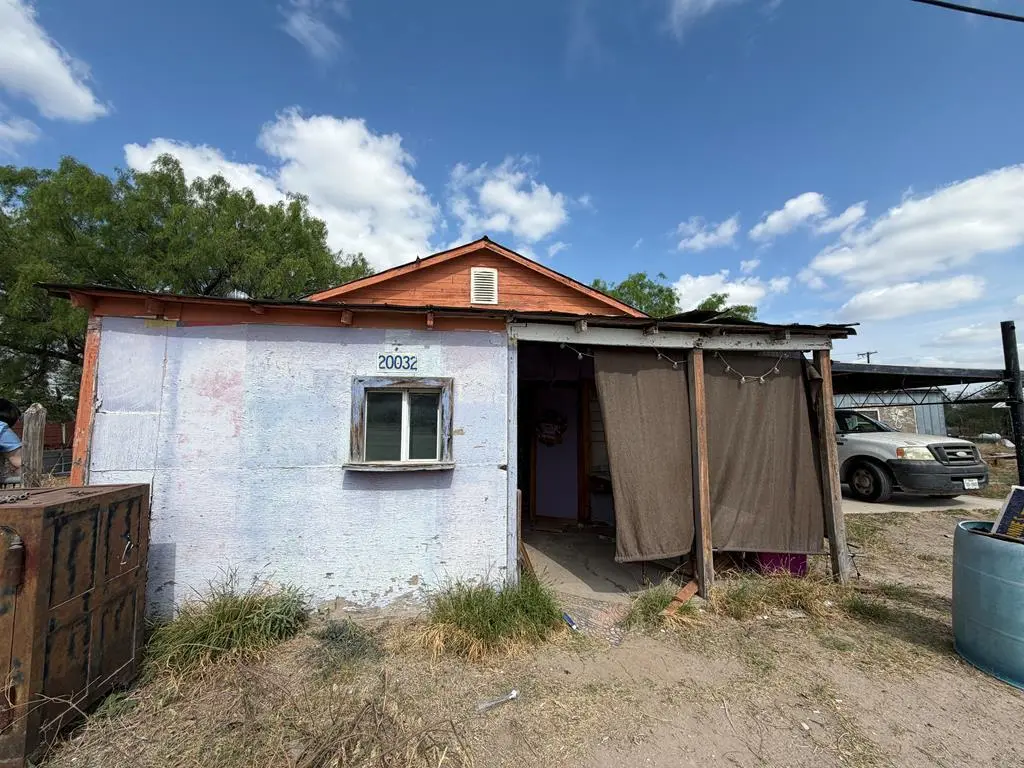
20032 Main St · Quemado, TX
Flood risk No data
- FEMA flood zone
- —
- Chance of flooding over 30 yrs
- —
- Est. flood insurance / yr
- —
Fire risk No data
- Est. fire insurance / yr
- —
Heat risk No data
- Hot days now (above threshold)
- —
- Hot days in 30 yrs
- —
Wind risk No data
- Chance of severe wind over 30 yrs
- —
Air-quality risk No data
- Unhealthy air days now
- —
- Unhealthy air days in 30 yrs
- —
Risk factors via First Street. Map © Google.
Why this score? — see what drove the B- grade
The composite is a weighted blend of 9 inputs, each scored 0–100. Each bar is that input's sub-score; the figure is the points it added to the 100-point composite (weight × sub-score).
- Cash flow +27.9/30.0
- DSCR +9.9/10.0
- 1% rule +7.6/10.0
- ARV discount +7.5/15.0
- Appreciation +6.7/10.0
- Rent growth +2.5/5.0
- Livability +2.5/5.0
- Schools +1.7/10.0
- Condition / age +1.0/5.0
$69,900
🖨 Deal sheet (PDF) 📄 Offer letter ✓ Due diligence
Listing remarks
Investor Opportunity in Quemado! This property features approximately 954 sqft of living space with 2 bedrooms and 1 bathroom, situated on two lots along Main St. (U. S. highway 277). The lots offer great potential for commercial use or the possibility of dividing into two separate properties, providing flexibility for future development. The existing home is in need of remodeling, making it ideal for investors or buyers looking for a project. CASH BUYERS ONLY. For more information, please contact the listing agent. ; Original MLS#: 83266; Age Range: UNKNOWN; Appraisal District ID: 14663; Apx Bsmt SqFt: 0; Apx Lot Size SqFt: 5750.00; Kitchen: Hard Surface, Electric; Living Room: Hard Surfac
Key facts
- Two lots
- Fenced
- Commercial use
Tags
Property features AI
Finance
- Other: Listing broker: Keller Williams Laredo; Listing agent: Gilma Cervera, (830) 325-6647
- Financial info: Down payment assistance not indicated
Exterior
- Utilities: Septic; City water
- Construction: Siding exterior; Metal roof; Slab foundation; Built on a 0.12-acre lot
- Exterior features: Paved street
Interior
- Bathrooms: 1 full bathroom
- Heating & cooling: Window air conditioning
- Interior features: Living area; Eat-in kitchen
Neighborhood map
What this means for you Summary
Snapshot
- This is a 2-bed/1.0-bath single-family listed at $70k. Condition is rated poor.
Deal economics
- At list price, monthly cash flow is $215 ($3k/yr) — positive.
- The deal already cash-flows at list — no discount required.
- Meets the 1% rule at list price ($883 rent vs $70k).
Location & tenants
- Location reads 49/100 on livability (#1,508 in TX) — a working-class tenant base; expect higher turnover. Strengths: cost of living A+, crime A; Watch: health & safety C-, schools F, amenities F.
- Eagle Pass ISD (town): math 15% / reading 28% proficiency, ranked #774 of 826 in TX (top 94%) — low school quality limits family demand, transient renter base, plan for 1-2y turnover.
- Market conditions: 43 active listings in the ZIP; 66 units permitted in Maverick County in 2024 (0 in 5+ unit buildings).
Forward outlook
- In year one you build about $3k of equity ($483 loan paydown + $2k appreciation (3.4% local appreciation)).
- Maverick County population projected at +18% by 2050 — long-run rental-demand tailwind backs the buy-and-hold thesis.
- At projected returns (3.4% appreciation + 3.0% rent growth), your $20k cash investment doubles in ~4 years — after that, you're playing with house money.
Negotiation context
- Only 13 days on market — expect competitive offers; lowballing is unlikely to land.
Questions for the listing agent
- Have any recent inspections been done? Can we get a copy of the seller's disclosures and any deferred-maintenance estimates?
- Is there a deadline driving the sale (1031 exchange, divorce, estate, relocation)? That informs how much negotiation room exists.
- Schools are F-rated, which usually means shorter tenancies and higher turnover. Who's the typical renter profile here, and what's been the actual vacancy rate?
- What's the average days-on-market for RENTAL listings here right now (not sales)? A rising rental-DOM trend means longer vacancies and softer asking-rent achievability than the comps imply.
- What's the recent tenant-quality profile in this submarket — average credit score on applications, eviction rate, late-payment / NSF rate, and stable-employment percentage? A property-management company in the area should have these aggregated.
- How much new for-sale + rental construction is in the pipeline within 1–3 miles? Heavy new supply typically softens prices + rents 12–24 months out; constrained supply supports both.
Investment metrics
- 1% rule
- 1.26% ✓
- Cap rate
- 9.98%
- Cash-on-cash
- 13.17%
- DSCR
- 1.59
- GRM
- 6.6
CMA / ARV
No comps found within radius.
Projected returns pro-forma
3.41% appreciation · 3.0% rent growth · sell at horizon
- IRR
- 20.8%
- Equity multiple
- 2.21×
- Total profit
- $23,647
- Equity at exit
- $33,058
- IRR
- 21.6%
- Equity multiple
- 4.23×
- Total profit
- $63,170
- Equity at exit
- $52,249
Cash invested: $19,572 (down + closing). Projections, not guarantees.
Landlord ↔ Tenant lean methodology
- Overall (STATE)
- 87 Strongly Landlord-Friendly
- State Texas
- 87 Strongly Landlord-Friendly · R+5
- County
- — inherits STATE
- City
- — inherits STATE
ZIP-level market 78877
- Home prices YoY
- 3.0%
- Active inventory
- 43
- Price-to-rent
- 6.6×
Monthly cashflow live
- Estimated rent
- $883 medium interval (Pro) →
- Mortgage (P&I)
- −$367
- Tax est. 1.5%
- −$87 /mo · $1,048/yr
- Insurance
- −$29
- HOA
- −$0
- Vacancy / Maint / Mgmt
- −$186
- Net cashflow
- $215
Break-even live
Sensitivity live
| Price | -10% $263 | -5% $239 | +0% $215 | +5% $191 | +10% $167 |
|---|---|---|---|---|---|
| Rent | -10% $145 | -5% $180 | +0% $215 | +5% $250 | +10% $285 |
| Rate | -1.0pp $250 | -0.5pp $233 | base $215 | +0.5pp $197 | +1.0pp $178 |
UW: 25.0% down · 7.5% · 30yr · 1.5% tax · 5.0% vac · 8.0% maint · 8.0% mgmt
Financing live
Cash to close
- Down payment
- $17,475
- Closing costs
- $2,097
- Reserves months
- —
- Total cash needed
- —
Loan-product check · same deal, 3 products live
Conventional
25% down · 7.5% · 30yr
- Down + closing
- —
- Monthly P&I
- —
- Monthly cashflow
- —
- DSCR
- —
- Eligible?
- —
Personal DTI + credit; lowest rate.
DSCR
20% down · 8.5% · 30yr
- Down + closing
- —
- Monthly P&I
- —
- Monthly cashflow
- —
- DSCR
- —
- Eligible?
- —
No personal income docs; deal must DSCR.
Hard money
10% down · 12.0% · 12mo
- Down + closing
- —
- Monthly P&I
- —
- Monthly cashflow
- —
- DSCR
- —
- Eligible?
- —
Short-term bridge; refi at stabilization.
Listing history 21 events
-
2026-06-21days on market $69,900 Active 13 DOM
-
2026-06-19days on market $69,900 Active 11 DOM
-
2026-06-18days on market $69,900 Active 10 DOM
-
2026-06-17days on market $69,900 Active 9 DOM
-
2026-06-16days on market $69,900 Active 8 DOM
-
2026-06-15days on market $69,900 Active 7 DOM
-
2026-06-14days on market $69,900 Active 5 DOM
-
2026-06-13days on market $69,900 Active 4 DOM
-
2026-06-10days on market $69,900 Active 2 DOM
-
2026-06-09remarks 699-char remark
-
2026-06-09days on market $69,900 Active 1 DOM
-
2026-06-08days on market $69,900 Active 65 DOM
-
2026-06-07days on market $69,900 Active 64 DOM
-
2026-06-05days on market $69,900 Active 61 DOM
-
2026-06-02days on market $69,900 Active 59 DOM
-
2026-06-01days on market $69,900 Active 58 DOM
-
2026-05-31days on market $69,900 Active 57 DOM
-
2026-05-30days on market $69,900 Active 56 DOM
-
2026-05-09price $69,900 521-char remark
-
2026-04-29price $72,500 521-char remark
-
2026-04-03$74,500 Active 521-char remark
ⓘ Source: listings_history table (triggers on properties + properties_extension) + one-shot
backfill from property_details.listing_events for pre-trigger history.
Nearby sold comps map
Loading sold comps map…
Walkable amenities ~0.75 mi
Loading nearby amenities…
Taxation est. · year 1
- Rental income
- $10,601
- − Mortgage interest
- −$3,915
- − Property taxes
- −$1,048
- − Insurance
- −$350
- − Repairs & maintenance
- −$848
- − Management
- −$848
- − Depreciation
- −$2,033
- Taxable income
- $1,558
- Est. tax owed @ 24.0%
- −$374
- After-tax cash flow
- $2,204/yr
For passive investors: Depreciation is non-cash, so a rental often shows a tax loss while cash-flowing — sheltering income. Rental losses are passive: they offset passive income freely, and up to $25,000/yr can offset ordinary (W-2) income if you actively participate and your MAGI is under $100k (phasing out to $0 by $150k); unused losses carry forward. On sale, claimed depreciation is recaptured at up to 25%, and gains may owe capital-gains tax (a 1031 exchange can defer both). Figures are a year-1 estimate at your 24.0% rate — not tax advice; consult a CPA.
Condition & rehab AI · 11 photos
This property requires extensive repairs and maintenance, including roof replacement, exterior siding repair, HVAC system installation, and landscaping. It presents a significant investment opportunity for an investor looking to renovate and improve the property's value.
Repairs flagged
- Major roof — Visible leaks and damage
- Major exterior siding — Peeling paint and structural issues
- Major HVAC system — No visible system
Value-add opportunities
- Both roof replacement — Fixes major structural issue and improves curb appeal
- Both exterior siding repair — Improves curb appeal and structural integrity
- Both HVAC system installation — Improves comfort and energy efficiency
- Both landscaping and yard maintenance — Improves curb appeal and property value
Renovation cost estimate screening
| Repair item | Severity | Est. cost |
|---|---|---|
| roof · Visible leaks and damage | Major | $15,000–50,000 |
| exterior siding · Peeling paint and structural issues | Major | $15,000–50,000 |
| HVAC system · No visible system | Major | $15,000–50,000 |
| Total estimated repair cost · 3 items | $45,000–150,000 |
Value-add ROI direction
- Both roof replacement — Fixes major structural issue and improves curb appeal ↑
- Both exterior siding repair — Improves curb appeal and structural integrity ↑
- Both HVAC system installation — Improves comfort and energy efficiency ↑
- Both landscaping and yard maintenance — Improves curb appeal and property value ↑
ⓘ Cost ranges are severity-bucket heuristics (US national rule-of-thumb). Get contractor quotes + a written scope before underwriting a rehab budget.
Schools (NCES district)
- District
- Eagle Pass ISD
- NCES district ID
- 4817730
- Math proficiency
- 15% ▼ -41.00%
- Reading proficiency
- 28% ▼ -18.00%
- Median HH income
- $32,967
- Composite
- 17.48/100
- National rank
- #9057
- State rank
- #774 of 826 in TX
Livability — Quemado
- Score
- 49/100
- State rank
- #1508
- US rank
- #25790
Category grades
Schools grade is shown separately in the Schools card above.
Census & demographics
- Census place
- Quemado, TX
- Population (ZIP)
- 837
Population outlook (Maverick County) Hauer SSP2
- Today (2025)
- 62,919 people
- By 2030
- 65,440 · +4.0%
- By 2040
- 70,229 · +11.6%
- By 2050
- 74,218 · +18.0%
- By 2075
- 80,765 · +28.4%
- By 2100
- 76,268 · +21.2%
Race, ethnicity, and origin ACS 2023
- Neighborhood character
- Predominantly Hispanic (98%)
- Race & ethnicity
- Hispanic / Latino 98% Two or more races 73% White 2%
- Hispanic origin (detail)
- Mexican 98%
- Foreign-born
- 65% · Canada
- Languages at home
- 3% English-only · Spanish 97%
Political lean MEDSL · Maverick
- 2024 margin
- R (+18.5) · D 40.5% · R 59.0%
- 2008→2024 swing
- -75.5pp toward R · 2008: 57.0pp · 2024: -18.5pp
- All cycles
- 2024: R+18.5 2020: D+9.4 2016: D+55.8 2012: D+58.0 2008: D+57.0
Not yet ingested
- Civics
- —
Market trends
- HPI YoY
- ▲ 3.41%
- Current HPI
- 116.5685
- Rent YoY
- —
- Metro
- —
- State GDP YoY
- ▲ 3.95%
- F500 in state
- 110
Industry mix (Fortune 500 HQ in TX)
| Industry | F500 HQs | Revenue |
|---|---|---|
| Energy | 16 | $1,198B |
|
||
| Technology | 5 | $198B |
|
||
| Engineering / Construction | 4 | $72B |
|
||
| Energy Services | 3 | $60B |
|
||
| Utilities | 3 | $41B |
|
||
| Healthcare | 2 | $330B |
|
||
Price history
1 event — show timeline
- 2026-04-03 Listed $69,900 LERA
Cash-flow waterfall
monthlySold comps — $/sqft
last 12 mo · ≤1 miLoading sold comps…