66 Hillside Dr E · Sag Harbor, NY
Flood risk 1/10 · Minimal
- FEMA flood zone
- X (unshaded)
- Chance of flooding over 30 yrs
- 0.0%
- Est. flood insurance / yr
- $473 – $860
Fire risk 2/10 · Minimal
- Est. fire insurance / yr
- $691 – $1,283
Heat risk 4/10 · Minor
- Hot days now (above 90°F)
- 7 days/yr
- Hot days in 30 yrs
- 18 days/yr
Wind risk 8/10 · Major
- Chance of severe wind over 30 yrs
- 80.0%
Air-quality risk 3/10 · Minor
- Unhealthy air days now
- 2 days/yr
- Unhealthy air days in 30 yrs
- 3 days/yr
Risk factors via First Street. Map © Google.
Why this score? — see what drove the D+ grade
The composite is a weighted blend of 9 inputs, each scored 0–100. Each bar is that input's sub-score; the figure is the points it added to the 100-point composite (weight × sub-score).
- ARV discount +15.0/15.0
- Appreciation +9.6/10.0
- Cash flow +6.0/30.0
- Schools +5.6/10.0
- Rent growth +5.0/5.0
- Livability +3.5/5.0
- Condition / age +2.5/5.0
- 1% rule +1.3/10.0
- DSCR +0.4/10.0
$4,700,000
🖨 Deal sheet (PDF) 📄 Offer letter ✓ Due diligence
Listing remarks MLS
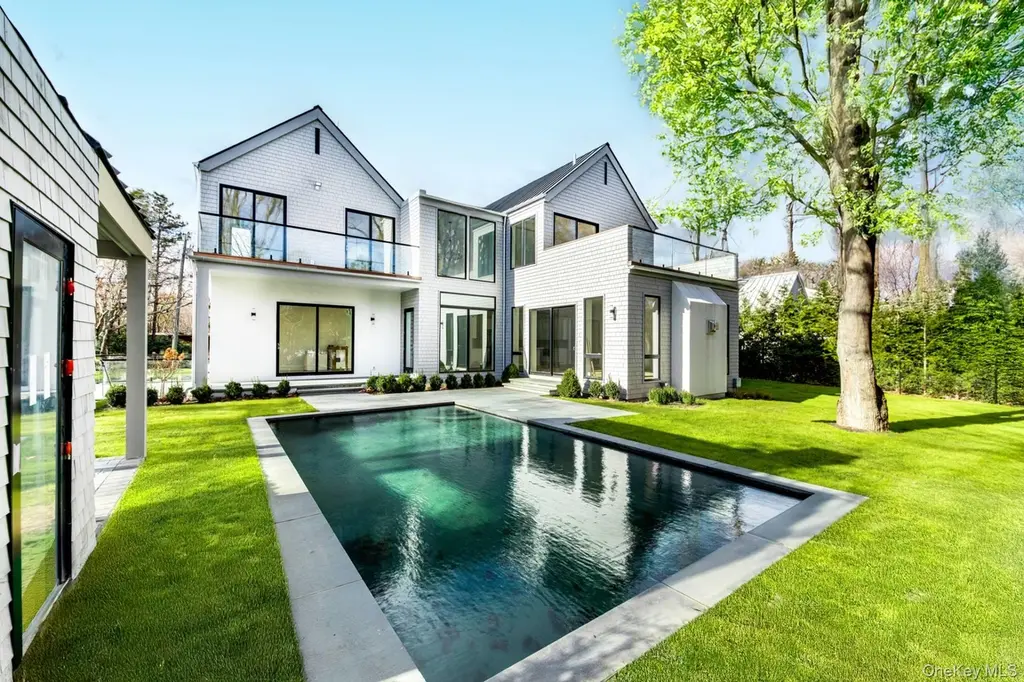
This spectacular new construction home in Sag Harbor, designed by Peter Cook AIA, delivers the best of the Hamptons moments from the water and life in the Village. Just a few houses down from Ninevah bay beach, sited on a clear .35 acre parcel in Sag Harbor Hills, this brand-new home has 6 bedrooms,6 full and 2 half baths, with 4,519 +/- sq. ft. of living space across all 3 levels. Equipped with every luxurious amenity expected in a Hamptons home, including pool, pool house with a fireplace, and a detached 1 car garage. Inside, enjoy open-concept living with great natural light. There is a fabulous gas fireplace in the living room. Outfitted entirely with Viking stainless steel appliances, the kitchen sits at the heart of the home. Ready for everyday luxury living, the spacious lower adds another bedroom and 2 full baths. The two bedrooms upstairs have double vanities and private balconies. Easy indoor-outdoor living is always close at hand with large windows and egress to the covered porch, gunite pool, and pool house. This quiet neighborhood is close to the water and easily access to the exclusive and elevated experiences, shops, and dining in Sag Harbor Village.
Key facts
- Private balconies
- Clear parcel
- Ninevah bay beach
Tags
Neighborhood map
What this means for you Summary
Snapshot
- This is a 6-bed/7.0-bath land listed at $4.70M.
Deal economics
- At list price, monthly cash flow is $-9k ($-107k/yr) — negative.
- To cash-flow at today's rent, offer at most $3.41M (27.4% below list).
- To meet the 1% rule (rent ≥ 1% of price), the offer needs to be $2.98M (36.5% below list).
- Recommended offer: $2.98M (36.5% below list) — sets the bar for 1% rule.
Location & tenants
- Location reads 70/100 on livability (#427 in NY) — a middle-class / working-renter tenant base. Strengths: crime A+, employment A+, health & safety A; Watch: amenities F, commute F, cost of living F.
- Sag Harbor Union Free School District (suburban): math 54% / reading 70% proficiency, ranked #175 of 590 in NY (top 30%) — acceptable for families but not a draw, mixed tenant base, ~2y average lease; only 8% free/reduced lunch — higher-income household profile.
- Market conditions: Rents rising fast (+10.8%/yr); 65 active listings in the ZIP; 1 comparable units currently listed for rent nearby; high-income renter base; 1,366 units permitted in Suffolk County in 2024 (216 in 5+ unit buildings).
- At $29,830/mo this rent would consume 280% of the median local household income ($128k/yr) (locally 95% of renters already pay >50% of income on rent) — very limited rent-growth headroom before tenants either downsize or default.
Forward outlook
- In year one you build about $464k of equity ($32k loan paydown + $432k appreciation (9.2% local appreciation)).
- Suffolk County population projected to shrink 5% by 2050 — rents likely to lag national; underwrite the cash flow, not the appreciation.
- By year 2, paydown + projected appreciation supports a ~$745k cash-out refi (75% LTV) — recoverable capital for the next deal without selling this one.
Negotiation context
- It's been on market 303 days — a 12% lower offer ($4.14M) is reasonable based on typical stale-listing flexibility.
- 3 sale attempts since 3y ago; this cycle's ask has dropped $295k (6%) from the opening price — seller is motivated, your offer sets the floor, not the list.
- Current owner paid $1.43M; list at $4.70M implies a 230% gain — meaningful room to come down on a strong offer.
Risks & watch-outs
- Climate carrying-cost: severe wind risk, 80% chance of damaging wind over 30y — expect insurance premiums to compound above CPI over the hold.
Questions for the listing agent
- What do current leases actually rent for vs. the listed asking? Can we see a recent rent roll and the last 12 months of T-12 income?
- It's been on market 303 days. Have you received any prior offers? Is the seller open to a 37% concession, seller financing, or rate buy-down credit?
- Why hasn't it sold? Are there any deal-killer items the seller is aware of (foundation, flood, title, zoning, code violations)?
- Is there a deadline driving the sale (1031 exchange, divorce, estate, relocation)? That informs how much negotiation room exists.
- Schools are A-rated — typically a magnet for longer-tenancy family renters. What's the average tenant stay here, and is there a school-zone premium baked into asking?
- The area grade is low — what's the realistic commute time and amenity access for the typical tenant pool here? Any planned neighborhood developments (good or bad) we should know about?
- What's the average days-on-market for RENTAL listings here right now (not sales)? A rising rental-DOM trend means longer vacancies and softer asking-rent achievability than the comps imply.
- What's the recent tenant-quality profile in this submarket — average credit score on applications, eviction rate, late-payment / NSF rate, and stable-employment percentage? A property-management company in the area should have these aggregated.
- How much new for-sale + rental construction is in the pipeline within 1–3 miles? Heavy new supply typically softens prices + rents 12–24 months out; constrained supply supports both.
Investment metrics
- 1% rule
- 0.63% ✗
- Cap rate
- 4.02%
- Cash-on-cash
- -8.13%
- DSCR
- 0.64
- GRM
- 13.1
CMA / ARV
- ARV (median comp)
- $6,023,948
- List price
- $4,700,000
- Delta
- -21.98%
- Verdict
- UNDERPRICED
- Comps
- 4 within 2.0 mi
Projected returns pro-forma
9.19% appreciation · 8.0% rent growth · sell at horizon
- IRR
- 18.1%
- Equity multiple
- 2.44×
- Total profit
- $1,890,715
- Equity at exit
- $3,958,246
- IRR
- 18.0%
- Equity multiple
- 5.82×
- Total profit
- $6,349,388
- Equity at exit
- $8,258,625
Cash invested: $1,316,000 (down + closing). Projections, not guarantees.
Landlord ↔ Tenant lean methodology
- Overall (STATE)
- 15 Strongly Tenant-Friendly
- State New York
- 15 Strongly Tenant-Friendly · D+10
- County
- — inherits STATE
- City
- — inherits STATE
ZIP-level market 11963
- Home prices YoY
- 1.9%
- Rents YoY
- 10.8%
- Active inventory
- 65
- Price-to-rent
- 13.1×
Monthly cashflow live
- Estimated rent
- $29,830 medium interval (Pro) →
- Mortgage (P&I)
- −$24,647
- Tax est. 1.5%
- −$5,875 /mo · $70,500/yr
- Insurance
- −$1,958
- HOA
- −$0
- Vacancy / Maint / Mgmt
- −$6,264
- Net cashflow
- $-8,915
Break-even live
Sensitivity live
| Price | -10% $-5,667 | -5% $-7,291 | +0% $-8,915 | +5% $-10,539 | +10% $-12,163 |
|---|---|---|---|---|---|
| Rent | -10% $-11,271 | -5% $-10,093 | +0% $-8,915 | +5% $-7,737 | +10% $-6,558 |
| Rate | -1.0pp $-6,548 | -0.5pp $-7,719 | base $-8,915 | +0.5pp $-10,133 | +1.0pp $-11,372 |
UW: 25.0% down · 7.5% · 30yr · 1.5% tax · 5.0% vac · 8.0% maint · 8.0% mgmt
Financing live
Cash to close
- Down payment
- $1,175,000
- Closing costs
- $141,000
- Reserves months
- —
- Total cash needed
- —
Loan-product check · same deal, 3 products live
Conventional
25% down · 7.5% · 30yr
- Down + closing
- —
- Monthly P&I
- —
- Monthly cashflow
- —
- DSCR
- —
- Eligible?
- —
Personal DTI + credit; lowest rate.
DSCR
20% down · 8.5% · 30yr
- Down + closing
- —
- Monthly P&I
- —
- Monthly cashflow
- —
- DSCR
- —
- Eligible?
- —
No personal income docs; deal must DSCR.
Hard money
10% down · 12.0% · 12mo
- Down + closing
- —
- Monthly P&I
- —
- Monthly cashflow
- —
- DSCR
- —
- Eligible?
- —
Short-term bridge; refi at stabilization.
Rent comps 1 comps
| Address | Beds | Baths | Sqft | Rent | $/sqft | DOM | Units | Dist |
|---|---|---|---|---|---|---|---|---|
| 7 Old Sag Harbor Rd East Hampton, NY | 5.0 | 5.5 | 4000 | $25,000 | $6.25 | 0d | 1 | 1.08mi |
Listing history 20 events
-
2026-06-18days on market $4,700,000 Active 303 DOM
-
2026-06-17days on market $4,700,000 Active 302 DOM
-
2026-06-16days on market $4,700,000 Active 301 DOM
-
2026-06-15days on market $4,700,000 Active 300 DOM
-
2026-06-13days on market $4,700,000 Active 298 DOM
-
2026-06-09days on market $4,700,000 Active 294 DOM
-
2026-06-08days on market $4,700,000 Active 293 DOM
-
2026-06-07days on market $4,700,000 Active 292 DOM
-
2026-06-04days on market $4,700,000 Active 289 DOM
-
2026-06-03days on market $4,700,000 Active 288 DOM
-
2026-06-02days on market $4,700,000 Active 287 DOM
-
2026-06-01days on market $4,700,000 Active 286 DOM
-
2026-05-31days on market $4,700,000 Active 285 DOM
-
2025-08-19$4,995,000 Active 1183-char remark
Show marketing remark (1183 chars)
This spectacular new construction home in Sag Harbor, designed by Peter Cook AIA, delivers the best of the Hamptons moments from the water and life in the Village. Just a few houses down from Ninevah bay beach, sited on a clear .35 acre parcel in Sag Harbor Hills, this brand-new home has 6 bedrooms,6 full and 2 half baths, with 4,519 +/- sq. ft. of living space across all 3 levels. Equipped with every luxurious amenity expected in a Hamptons home, including pool, pool house with a fireplace, and a detached 1 car garage. Inside, enjoy open-concept living with great natural light. There is a fabulous gas fireplace in the living room. Outfitted entirely with Viking stainless steel appliances, the kitchen sits at the heart of the home. Ready for everyday luxury living, the spacious lower adds another bedroom and 2 full baths. The two bedrooms upstairs have double vanities and private balconies. Easy indoor-outdoor living is always close at hand with large windows and egress to the covered porch, gunite pool, and pool house. This quiet neighborhood is close to the water and easily access to the exclusive and elevated experiences, shops, and dining in Sag Harbor Village.
-
2024-05-24historical
-
2023-06-07historical
-
2023-06-07$4,995,000 Active
-
2023-05-30$4,995,000 Active
-
2023-05-04soldstatus $1,425,000
-
2022-11-04soldstatus $1,100,000
ⓘ Source: listings_history table (triggers on properties + properties_extension) + one-shot
backfill from property_details.listing_events for pre-trigger history.
Climate risk First Street
- Flood 1/10 Low FEMA zone X (unshaded) · 0% chance over 30 yrs
- Wildfire 2/10 Low
- Heat 4/10 Moderate 7 d/yr ≥90°F today · 18 d/yr by 30 yrs out
- Wind 8/10 Severe 80% chance of damaging wind over 30 yrs
- Air quality 3/10 Moderate 2 unhealthy d/yr today · 3 by 30 yrs out
Nearby sold comps map
Loading sold comps map…
Walkable amenities ~0.75 mi
Loading nearby amenities…
Taxation est. · year 1
- Rental income
- $357,961
- − Mortgage interest
- −$263,273
- − Property taxes
- −$70,500
- − Insurance
- −$23,500
- − Repairs & maintenance
- −$28,637
- − Management
- −$28,637
- − Depreciation
- −$136,727
- Taxable loss
- −$193,313
- Est. tax savings @ 24.0%
- +$46,395
- After-tax cash flow
- $-60,583/yr
For passive investors: Depreciation is non-cash, so a rental often shows a tax loss while cash-flowing — sheltering income. Rental losses are passive: they offset passive income freely, and up to $25,000/yr can offset ordinary (W-2) income if you actively participate and your MAGI is under $100k (phasing out to $0 by $150k); unused losses carry forward. On sale, claimed depreciation is recaptured at up to 25%, and gains may owe capital-gains tax (a 1031 exchange can defer both). Figures are a year-1 estimate at your 24.0% rate — not tax advice; consult a CPA.
Schools (NCES district)
- District
- Sag Harbor Union Free School District
- NCES district ID
- 3625380
- Math proficiency
- 54% ▼ -13.00%
- Reading proficiency
- 70% ▲ 7.00%
- Median HH income
- $81,547
- Composite
- 55.69/100
- National rank
- #1222
- State rank
- #175 of 590 in NY
Livability — Sag Harbor
- Score
- 70/100
- State rank
- #427
- US rank
- #7428
Category grades
Schools grade is shown separately in the Schools card above.
Census & demographics
- Census place
- Sag Harbor, NY
- County
- Suffolk County · 679,920 people
- City population
- 8,390
- Metro
- New York-Newark-Jersey City, NY-NJ-PA
- Population (ZIP)
- 8,390
- Household income
- $127,746
- Rent vs Own
- Severe rent burden
- 95.0
Population outlook (Suffolk County) Hauer SSP2
- Today (2025)
- 1,505,262 people
- By 2030
- 1,498,318 · -0.5%
- By 2040
- 1,471,101 · -2.3%
- By 2050
- 1,424,848 · -5.3%
- By 2075
- 1,337,157 · -11.2%
- By 2100
- 1,217,720 · -19.1%
Race, ethnicity, and origin ACS 2023
- Neighborhood character
- Predominantly White (78%)
- Race & ethnicity
- White 78% Hispanic / Latino 13% Two or more races 11% Asian 4% Black 2%
- Hispanic origin (detail)
- Mexican 8%
- Common ancestry
- Scotch-Irish 4% Romanian 3% Italian 2%
- Foreign-born
- 13% · Canada, China, Jamaica
- Languages at home
- 81% English-only · Spanish 9% Other Indo-European 5% French/Haitian/Cajun 2%
Political lean MEDSL · Suffolk
- 2024 margin
- Lean R (+10.0) · D 45.0% · R 55.0%
- 2008→2024 swing
- -16.0pp toward R · 2008: 6.0pp · 2024: -10.0pp
- All cycles
- 2024: R+10.0 2020: R+0.0 2016: R+8.2 2012: D+2.9 2008: D+6.0
Not yet ingested
- Civics
- —
Market trends
- HPI YoY
- ▲ 9.19%
- Current HPI
- 499.3304
- Rent YoY
- ▲ 10.76%
- Metro
- New York-Newark-Jersey City, NY-NJ-PA
- State GDP YoY
- ▲ 2.60%
- F500 in state
- 92
Industry mix (Fortune 500 HQ in NY)
| Industry | F500 HQs | Revenue |
|---|---|---|
| Financial Services | 10 | $950B |
|
||
| Consumer Goods | 9 | $162B |
|
||
| Insurance | 4 | $225B |
|
||
| Telecommunications | 2 | $144B |
|
||
| Pharmaceuticals | 2 | $112B |
|
||
| Media / Entertainment | 2 | $69B |
|
||
Price history
+354.1% since first listed7 events — show timeline
- 2025-08-19 Listed $4,995,000 OneKey® MLS as Distributed by MLS Grid
- 2024-05-24 Listing Removed — OneKey® MLS as Distributed by MLS Grid
- 2023-06-07 Listing Removed — OneKey® MLS as Distributed by MLS Grid
- 2023-06-07 Listed $4,995,000 OneKey® MLS as Distributed by MLS Grid
- 2023-05-30 Listed $4,995,000 OneKey® MLS as Distributed by MLS Grid
- 2023-05-04 Sold (Public Records) $1,425,000 Public Records
- 2022-11-04 Sold (Public Records) $1,100,000 Public Records
Property tax history
-14.5%/yrLatest (2025): $326 · +0.0% YoY. Source: county tax records.
Cash-flow waterfall
monthlySold comps — $/sqft
last 12 mo · ≤1 miLoading sold comps…