296 Live Oak Loop · Whitney, TX
Flood risk 1/10 · Minimal
- FEMA flood zone
- X (unshaded)
- Chance of flooding over 30 yrs
- 0.0%
- Est. flood insurance / yr
- $507 – $1,088
Fire risk 5/10 · Moderate
- Est. fire insurance / yr
- $1,222 – $2,270
Heat risk 7/10 · Major
- Hot days now (above 109°F)
- 7 days/yr
- Hot days in 30 yrs
- 23 days/yr
Wind risk 6/10 · Moderate
- Chance of severe wind over 30 yrs
- 27.0%
Air-quality risk 2/10 · Minimal
- Unhealthy air days now
- 1 days/yr
- Unhealthy air days in 30 yrs
- 1 days/yr
Risk factors via First Street. Map © Google.
Why this score? — see what drove the B+ grade
The composite is a weighted blend of 9 inputs, each scored 0–100. Each bar is that input's sub-score; the figure is the points it added to the 100-point composite (weight × sub-score).
- Cash flow +30.0/30.0
- ARV discount +15.0/15.0
- 1% rule +10.0/10.0
- DSCR +10.0/10.0
- Livability +3.6/5.0
- Schools +3.5/10.0
- Rent growth +2.5/5.0
- Condition / age +2.5/5.0
- Appreciation +0.0/10.0
$77,599
🖨 Deal sheet (PDF) 📄 Offer letter ✓ Due diligence
Listing remarks MLS
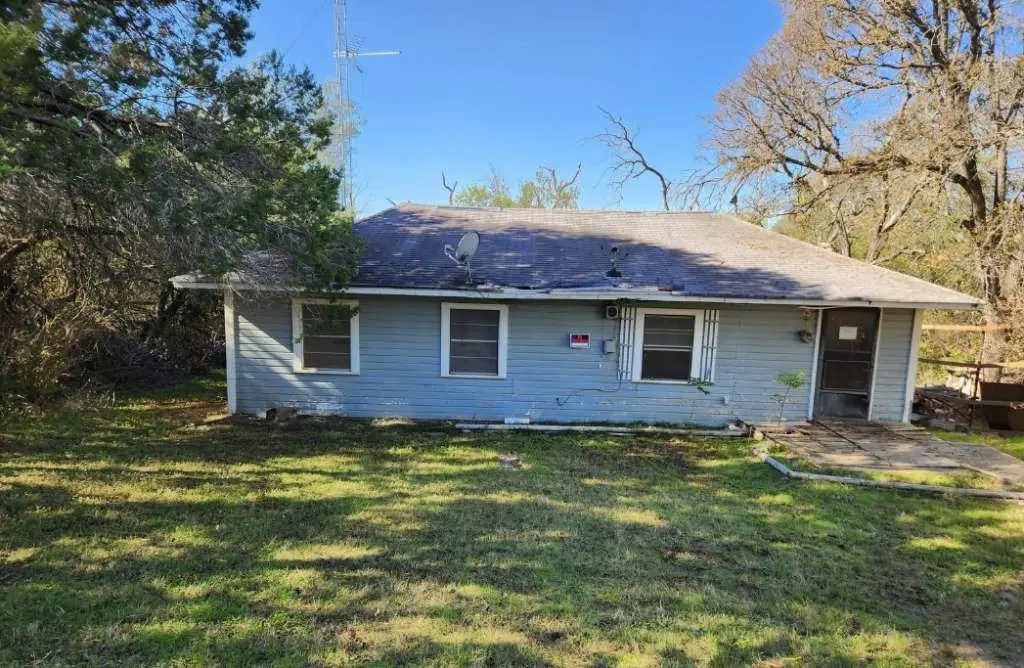
NEW LISTING! Introducing a charming 3-bedroom, 1-bathroom home in Whitney, TX! Situated on 5,880 sq. ft. of land, this property presents a fantastic renovation opportunity, awaiting your personal touches and enhancements. With the right investments and vision, you can transform this house into your dream home. Location is just another bonus, with close proximity to Cedar Creek Park offering a plethora of outdoor activities such as camping, nature-trail walking, fishing, kayaking, and more! Experience the beauty and serenity of this scenic area firsthand. Don't miss out on this incredible opportunity! Contact us today for more information and to schedule a viewing. This property is being sold AS IS, but it has lots of potential. WE MAKE IT EASY TO OWN. This is a great opportunity! Don't wait, call us today to get more information on the owner's easy terms and smooth process that may be able to put the deed in your name and make this your dream home.
Key facts
- Outdoor activities
- 5,880 sq ft lot
- Built 1955
Tags
Neighborhood map
What this means for you Summary
Snapshot
- This is a 3-bed/2.0-bath single-family listed at $78k.
Deal economics
- At list price, monthly cash flow is $611 ($7k/yr) — positive.
- The deal already cash-flows at list — no discount required.
- Meets the 1% rule at list price ($1k rent vs $78k).
- Recommended offer: $68k (12.0% below list) — sets the bar for market timing.
- Cap rate 15.7% vs local median 3.0% in Whitney — top-decile yield for the area; either an underpriced asset or a hidden risk that comps aren't pricing in. Stress-test before assuming the spread holds.
Location & tenants
- Location reads 71/100 on livability (#282 in TX) — a middle-class / working-renter tenant base. Strengths: cost of living A+, housing A+, health & safety A-; Watch: schools D, amenities F, commute F.
- Whitney ISD (rural): math 42% / reading 41% proficiency, ranked #378 of 826 in TX (top 46%) — families likely to look elsewhere, expect single-tenant / working-renter base with shorter leases.
- Market conditions: 644 active listings in the ZIP; 65 units permitted in Hill County in 2024 (0 in 5+ unit buildings).
Forward outlook
- Local home prices are declining (-3.0%/yr); year-one equity from $536 of loan paydown is wiped out by about $2k of value loss. Plan a longer hold.
- Hill County population projected at -12% by 2050 — secular population decline; favor cash flow + early exit over multi-decade hold.
- At projected returns (-3.0% appreciation + 3.0% rent growth), your $22k cash investment doubles in ~4 years — after that, you're playing with house money.
Negotiation context
- It's been on market 304 days — a 12% lower offer ($68k) is reasonable based on typical stale-listing flexibility.
- 3 sale attempts since 4y ago with the ask held roughly flat each time — persistent listings suggest the price (not the market) is what's stuck; bring a comps-based counter.
Risks & watch-outs
- Watch-outs: built in 1955 — expect roof / HVAC / electrical / plumbing capex.
- Climate carrying-cost: major wind risk, 27% chance of damaging wind over 30y; moderate wildfire risk; extreme-heat days projected 7→23/yr by 2055 (HVAC capex compounding) — expect insurance premiums to compound above CPI over the hold.
Questions for the listing agent
- It's been on market 304 days. Have you received any prior offers? Is the seller open to a 12% concession, seller financing, or rate buy-down credit?
- Built in 1955 — when were the roof, HVAC, electrical panel, plumbing, and water heater last replaced?
- Why hasn't it sold? Are there any deal-killer items the seller is aware of (foundation, flood, title, zoning, code violations)?
- Is there a deadline driving the sale (1031 exchange, divorce, estate, relocation)? That informs how much negotiation room exists.
- Schools are D-rated, which usually means shorter tenancies and higher turnover. Who's the typical renter profile here, and what's been the actual vacancy rate?
- What's the average days-on-market for RENTAL listings here right now (not sales)? A rising rental-DOM trend means longer vacancies and softer asking-rent achievability than the comps imply.
- What's the recent tenant-quality profile in this submarket — average credit score on applications, eviction rate, late-payment / NSF rate, and stable-employment percentage? A property-management company in the area should have these aggregated.
- How much new for-sale + rental construction is in the pipeline within 1–3 miles? Heavy new supply typically softens prices + rents 12–24 months out; constrained supply supports both.
Investment metrics
- 1% rule
- 1.80% ✓
- Cap rate
- 15.75%
- Cash-on-cash
- 33.77%
- DSCR
- 2.50
- GRM
- 4.6
CMA / ARV
- ARV (median comp)
- $151,407
- List price
- $77,599
- Delta
- -48.75%
- Verdict
- UNDERPRICED
- Comps
- 20 within 1.0 mi
Show comp detail 3 sales within ~0.75 mi
| Address | Dist | Beds/Ba | Sqft | Sold | Price | $/sf | Match |
|---|---|---|---|---|---|---|---|
| 334 Live Oak Loop | 0.12mi | 3/2.0 | 1,232 (+3%) | 3mo | $198,000 | $161 | 88 |
| 162 Live Oak Loop | 0.46mi | 3/2.0 | 1,283 (+7%) | 18mo | $160,000 | $125 | 52 |
| 210 Post Oak Dr | 0.40mi | 2/1.0 (-1) | 1,040 (-13%) | 17mo | $109,900 | $106 | 36 |
Match score weights: distance 35% · size 25% · config 20% · recency 20%. Top-matched comps best support the ARV.
Projected returns pro-forma
-3.0% appreciation · 3.0% rent growth · sell at horizon
- IRR
- 29.1%
- Equity multiple
- 2.21×
- Total profit
- $26,357
- Equity at exit
- $11,570
- IRR
- 36.4%
- Equity multiple
- 4.36×
- Total profit
- $73,065
- Equity at exit
- $6,709
Cash invested: $21,728 (down + closing). Projections, not guarantees.
Landlord ↔ Tenant lean methodology
- Overall (STATE)
- 87 Strongly Landlord-Friendly
- State Texas
- 87 Strongly Landlord-Friendly · R+5
- County
- — inherits STATE
- City
- — inherits STATE
ZIP-level market 76692
- Home prices YoY
- -6.5%
- Active inventory
- 644
- Price-to-rent
- 4.6×
Monthly cashflow live
- Estimated rent
- $1,396 medium interval (Pro) →
- Mortgage (P&I)
- −$407
- Tax from tax record
- −$52 /mo · $627/yr
- Insurance
- −$32
- HOA
- −$0
- Vacancy / Maint / Mgmt
- −$293
- Net cashflow
- $611
Break-even live
Sensitivity live
| Price | -10% $655 | -5% $633 | +0% $611 | +5% $589 | +10% $567 |
|---|---|---|---|---|---|
| Rent | -10% $501 | -5% $556 | +0% $611 | +5% $667 | +10% $722 |
| Rate | -1.0pp $650 | -0.5pp $631 | base $611 | +0.5pp $591 | +1.0pp $571 |
UW: 25.0% down · 7.5% · 30yr · 1.5% tax · 5.0% vac · 8.0% maint · 8.0% mgmt
Financing live
Cash to close
- Down payment
- $19,400
- Closing costs
- $2,328
- Reserves months
- —
- Total cash needed
- —
Loan-product check · same deal, 3 products live
Conventional
25% down · 7.5% · 30yr
- Down + closing
- —
- Monthly P&I
- —
- Monthly cashflow
- —
- DSCR
- —
- Eligible?
- —
Personal DTI + credit; lowest rate.
DSCR
20% down · 8.5% · 30yr
- Down + closing
- —
- Monthly P&I
- —
- Monthly cashflow
- —
- DSCR
- —
- Eligible?
- —
No personal income docs; deal must DSCR.
Hard money
10% down · 12.0% · 12mo
- Down + closing
- —
- Monthly P&I
- —
- Monthly cashflow
- —
- DSCR
- —
- Eligible?
- —
Short-term bridge; refi at stabilization.
Listing history 24 events
-
2026-06-21days on market $77,599 Active 304 DOM
-
2026-06-18days on market $77,599 Active 302 DOM
-
2026-06-17days on market $77,599 Active 301 DOM
-
2026-06-16days on market $77,599 Active 300 DOM
-
2026-06-15days on market $77,599 Active 299 DOM
-
2026-06-15days on market $77,599 Active 298 DOM
-
2026-06-13days on market $77,599 Active 297 DOM
-
2026-06-12days on market $77,599 Active 296 DOM
-
2026-06-09days on market $77,599 Active 293 DOM
-
2026-06-08days on market $77,599 Active 292 DOM
-
2026-06-08days on market $77,599 Active 291 DOM
-
2026-06-07days on market $77,599 Active 290 DOM
-
2026-06-03days on market $77,599 Active 287 DOM
-
2026-06-02days on market $77,599 Active 286 DOM
-
2026-06-01days on market $77,599 Active 285 DOM
-
2026-05-31days on market $77,599 Active 284 DOM
-
2025-08-20$77,599 Active 962-char remark
Show marketing remark (962 chars)
NEW LISTING! Introducing a charming 3-bedroom, 1-bathroom home in Whitney, TX! Situated on 5,880 sq. ft. of land, this property presents a fantastic renovation opportunity, awaiting your personal touches and enhancements. With the right investments and vision, you can transform this house into your dream home. Location is just another bonus, with close proximity to Cedar Creek Park offering a plethora of outdoor activities such as camping, nature-trail walking, fishing, kayaking, and more! Experience the beauty and serenity of this scenic area firsthand. Don't miss out on this incredible opportunity! Contact us today for more information and to schedule a viewing. This property is being sold AS IS, but it has lots of potential. WE MAKE IT EASY TO OWN. This is a great opportunity! Don't wait, call us today to get more information on the owner's easy terms and smooth process that may be able to put the deed in your name and make this your dream home.
-
2025-06-30historical
-
2024-09-11price $77,599
-
2024-06-14$79,999 Active
-
2023-07-29historical
-
2022-07-29$84,999 Active
-
2000-01-03soldstatus
-
1996-08-05soldstatus
ⓘ Source: listings_history table (triggers on properties + properties_extension) + one-shot
backfill from property_details.listing_events for pre-trigger history.
Tax reassessment forecast TX · Resets to sale price
- Current annual tax
- $627 · $52/mo
- Projected year-2 tax
- $1,420 · $118/mo
- Expected delta
- +$793/yr (+$66/mo · 126.4%)
ⓘ Screening estimate from a state-policy table — verify with the county assessor before closing.
Climate risk First Street
- Flood 1/10 Low FEMA zone X (unshaded) · 0% chance over 30 yrs
- Wildfire 5/10 Major
- Heat 7/10 Severe 7 d/yr ≥109°F today · 23 d/yr by 30 yrs out
- Wind 6/10 Major 27% chance of damaging wind over 30 yrs
- Air quality 2/10 Low 1 unhealthy d/yr today · 1 by 30 yrs out
Nearby sold comps map
Loading sold comps map…
Walkable amenities ~0.75 mi
Loading nearby amenities…
Taxation est. · year 1
- Rental income
- $16,753
- − Mortgage interest
- −$4,347
- − Property taxes
- −$627
- − Insurance
- −$388
- − Repairs & maintenance
- −$1,340
- − Management
- −$1,340
- − Depreciation
- −$2,257
- Taxable income
- $6,453
- Est. tax owed @ 24.0%
- −$1,549
- After-tax cash flow
- $5,788/yr
For passive investors: Depreciation is non-cash, so a rental often shows a tax loss while cash-flowing — sheltering income. Rental losses are passive: they offset passive income freely, and up to $25,000/yr can offset ordinary (W-2) income if you actively participate and your MAGI is under $100k (phasing out to $0 by $150k); unused losses carry forward. On sale, claimed depreciation is recaptured at up to 25%, and gains may owe capital-gains tax (a 1031 exchange can defer both). Figures are a year-1 estimate at your 24.0% rate — not tax advice; consult a CPA.
Schools (NCES district)
- District
- Whitney ISD
- NCES district ID
- 4845720
- Math proficiency
- 42% ▬ 0.00%
- Reading proficiency
- 41% ▲ 3.00%
- Median HH income
- $41,861
- Composite
- 34.97/100
- National rank
- #5060
- State rank
- #378 of 826 in TX
Livability — Whitney
- Score
- 71/100
- State rank
- #282
- US rank
- #6568
Category grades
Schools grade is shown separately in the Schools card above.
Census & demographics
- Population (ZIP)
- 9,662
Population outlook (Hill County) Hauer SSP2
- Today (2025)
- 34,013 people
- By 2030
- 33,289 · -2.1%
- By 2040
- 31,688 · -6.8%
- By 2050
- 30,100 · -11.5%
- By 2075
- 26,818 · -21.2%
- By 2100
- 22,918 · -32.6%
Race, ethnicity, and origin ACS 2023
- Neighborhood character
- Predominantly White (83%)
- Race & ethnicity
- White 83% Hispanic / Latino 12% Two or more races 4% Black 2%
- Hispanic origin (detail)
- Mexican 11%
- Common ancestry
- Italian 3% Lithuanian 2% Romanian 2%
- Foreign-born
- 4% · Canada, Vietnam
- Languages at home
- 90% English-only · Spanish 9%
Political lean MEDSL · Hill
- 2024 margin
- Solid R (+64.4) · D 17.5% · R 81.8%
- 2008→2024 swing
- -23.0pp toward R · 2008: -41.4pp · 2024: -64.4pp
- All cycles
- 2024: R+64.4 2020: R+60.7 2016: R+58.4 2012: R+53.0 2008: R+41.4
Not yet ingested
- Civics
- —
Market trends
- HPI YoY
- ▼ -17.72%
- Current HPI
- 252.9827
- Rent YoY
- —
- Metro
- —
- State GDP YoY
- ▲ 3.95%
- F500 in state
- 110
Industry mix (Fortune 500 HQ in TX)
| Industry | F500 HQs | Revenue |
|---|---|---|
| Energy | 16 | $1,198B |
|
||
| Technology | 5 | $198B |
|
||
| Engineering / Construction | 4 | $72B |
|
||
| Energy Services | 3 | $60B |
|
||
| Utilities | 3 | $41B |
|
||
| Healthcare | 2 | $330B |
|
||
Price history
-8.7% since first listed8 events — show timeline
- 2025-08-20 Listed $77,599 HARMLS
- 2025-06-30 Listing Removed — NTREIS
- 2024-09-11 Price Changed $77,599 NTREIS
- 2024-06-14 Listed $79,999 NTREIS
- 2023-07-29 Listing Removed — HARMLS
- 2022-07-29 Listed $84,999 HARMLS
- 2000-01-03 Sold (Public Records) — Public Records
- 1996-08-05 Sold (Public Records) — Public Records
Property tax history
+2.3%/yrLatest (2025): $627 · +1.9% YoY. Source: county tax records.
Cash-flow waterfall
monthlySold comps — $/sqft
last 12 mo · ≤1 miLoading sold comps…