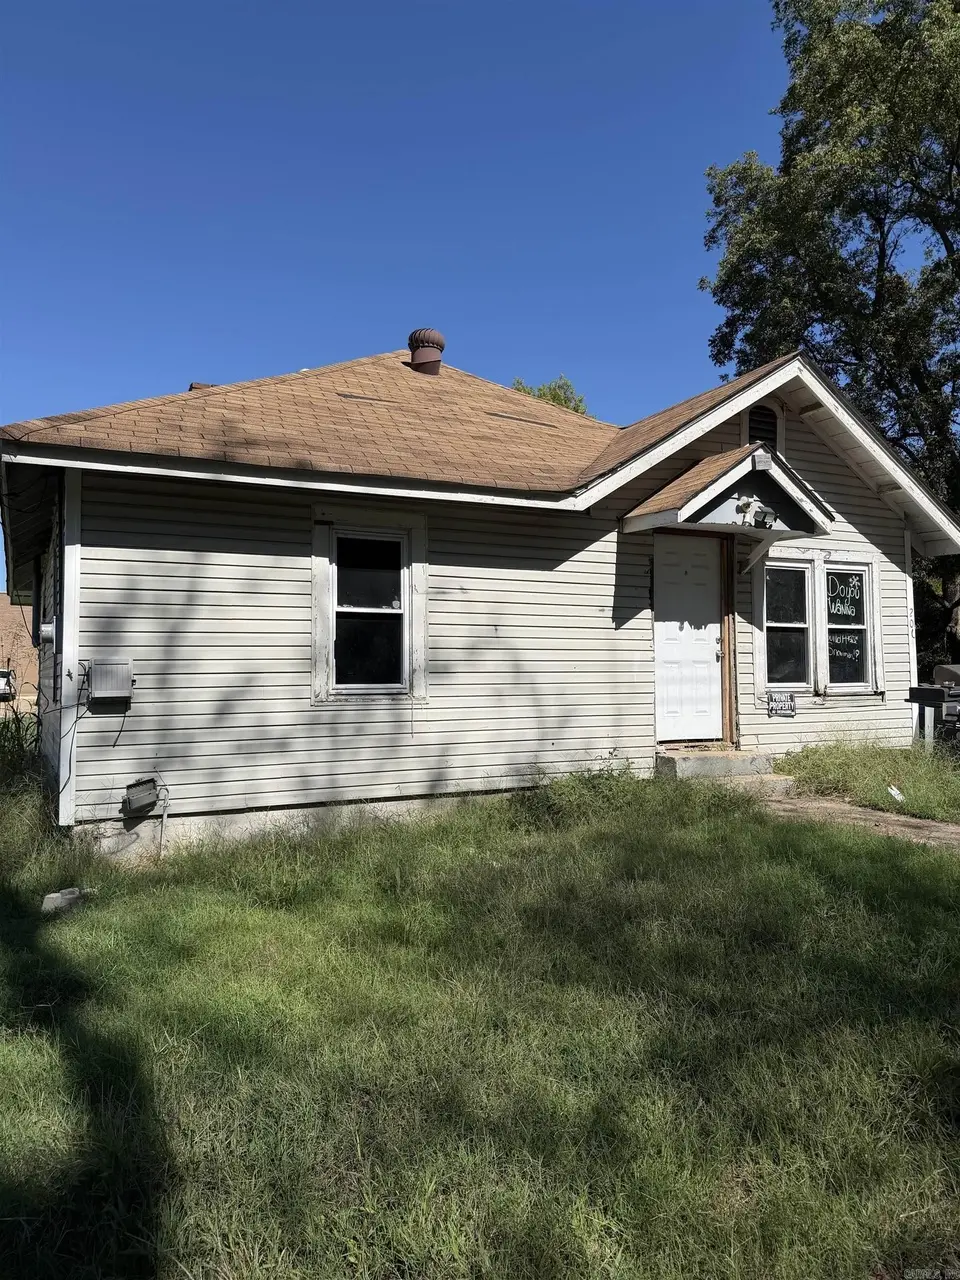
206 W Ctr · Harrisburg, AR
Flood risk No data
- FEMA flood zone
- —
- Chance of flooding over 30 yrs
- —
- Est. flood insurance / yr
- —
Fire risk No data
- Est. fire insurance / yr
- —
Heat risk No data
- Hot days now (above threshold)
- —
- Hot days in 30 yrs
- —
Wind risk No data
- Chance of severe wind over 30 yrs
- —
Air-quality risk No data
- Unhealthy air days now
- —
- Unhealthy air days in 30 yrs
- —
Risk factors via First Street. Map © Google.
Why this score? — see what drove the D+ grade
The composite is a weighted blend of 9 inputs, each scored 0–100. Each bar is that input's sub-score; the figure is the points it added to the 100-point composite (weight × sub-score).
- Cash flow +15.0/30.0
- ARV discount +7.5/15.0
- 1% rule +5.0/10.0
- DSCR +5.0/10.0
- Appreciation +3.8/10.0
- Livability +2.8/5.0
- Schools +2.7/10.0
- Rent growth +2.5/5.0
- Condition / age +2.5/5.0
$21,900
🖨 Deal sheet 📄 Offer letter ✓ Due diligence
Listing remarks MLS
Don't miss this great investment opportunity. This 2 Bedroom, 1 Bathroom home is on 0.27 acres in Harrisburg. This property is being sold AS-IS. Seller has not occupied the property so no SPD.
Key facts
- 0.27 acre lot
- Built 1949
- Listed 142 days
Neighborhood map
What this means for you Summary
Snapshot
- This is a 2-bed/1.0-bath single-family listed at $22k.
Deal economics
- At list price, monthly cash flow is $591 ($7k/yr) — positive.
- The deal already cash-flows at list — no discount required.
- Meets the 1% rule at list price ($927 rent vs $22k).
- Recommended offer: $19k (12.0% below list) — sets the bar for market timing.
Location & tenants
- Location reads 56/100 on livability (#375 in AR) — a working-class tenant base; expect higher turnover. Strengths: cost of living A+, health & safety A, housing A-; Watch: schools D, employment D, crime D-.
- Harrisburg School District (rural): math 31% / reading 35% proficiency, ranked #137 of 238 in AR (top 58%) — families likely to look elsewhere, expect single-tenant / working-renter base with shorter leases; 86% free/reduced lunch — lower-income household profile, screen leases tightly.
- Market conditions: 55 active listings in the ZIP; 67 units permitted in Poinsett County in 2024 (5 in 5+ unit buildings).
Forward outlook
- Local home prices are declining (-2.4%/yr); year-one equity from $151 of loan paydown is wiped out by about $532 of value loss. Plan a longer hold.
- Poinsett County population projected at -13% by 2050 — secular population decline; favor cash flow + early exit over multi-decade hold.
- At projected returns (-2.4% appreciation + 3.0% rent growth), your $6k cash investment doubles in ~1 year — after that, you're playing with house money.
Negotiation context
- It's been on market 143 days — a 12% lower offer ($19k) is reasonable based on typical stale-listing flexibility.
- 7 sale attempts since 4y ago; this cycle's ask is 10% above the opening price — seller raised mid-cycle; expect resistance to lowballs.
- Current owner paid $10k; list at $22k implies a 119% gain — meaningful room to come down on a strong offer.
Risks & watch-outs
- Watch-outs: built in 1949 — expect roof / HVAC / electrical / plumbing capex.
Questions for the listing agent
- It's been on market 143 days. Have you received any prior offers? Is the seller open to a 12% concession, seller financing, or rate buy-down credit?
- Built in 1949 — when were the roof, HVAC, electrical panel, plumbing, and water heater last replaced?
- Why hasn't it sold? Are there any deal-killer items the seller is aware of (foundation, flood, title, zoning, code violations)?
- Is there a deadline driving the sale (1031 exchange, divorce, estate, relocation)? That informs how much negotiation room exists.
- Schools are D-rated, which usually means shorter tenancies and higher turnover. Who's the typical renter profile here, and what's been the actual vacancy rate?
- Crime grade is D in this area — have there been break-ins, vandalism, or insurance claims at this property in the last 3 years? What carrier currently insures it and at what premium?
- The area grade is low — what's the realistic commute time and amenity access for the typical tenant pool here? Any planned neighborhood developments (good or bad) we should know about?
- What's the average days-on-market for RENTAL listings here right now (not sales)? A rising rental-DOM trend means longer vacancies and softer asking-rent achievability than the comps imply.
- What's the recent tenant-quality profile in this submarket — average credit score on applications, eviction rate, late-payment / NSF rate, and stable-employment percentage? A property-management company in the area should have these aggregated.
- How much new for-sale + rental construction is in the pipeline within 1–3 miles? Heavy new supply typically softens prices + rents 12–24 months out; constrained supply supports both.
Investment metrics
- 1% rule
- 4.23% ✓
- Cap rate
- 38.70%
- Cash-on-cash
- 115.74%
- DSCR
- 6.15
- GRM
- 2.0
CMA / ARV
- ARV (median comp)
- $113,885
- List price
- $21,900
- Delta
- -80.77%
- Verdict
- UNDERPRICED
- Comps
- 20 within 1.0 mi
Show comp detail 4 sales within ~0.75 mi
| Address | Dist | Beds/Ba | Sqft | Sold | Price | $/sf | Match |
|---|---|---|---|---|---|---|---|
| 207 Perch Ave | 0.22mi | 2/1.0 | 1,070 (+6%) | 4mo | $139,000 | $130 | 76 |
| 202 W South St | 0.21mi | 2/1.0 | 956 (-5%) | 15mo | $55,000 | $58 | 69 |
| 103 Winters St | 0.25mi | 3/1.0 (+1) | 1,114 (+10%) | 24mo | $100,000 | $90 | 46 |
| 505 W Border St | 0.47mi | 3/1.0 (+1) | 1,134 (+12%) | 15mo | $142,000 | $125 | 40 |
Match score weights: distance 35% · size 25% · config 20% · recency 20%. Top-matched comps best support the ARV.
Projected returns pro-forma
-2.43% appreciation · 3.0% rent growth · sell at horizon
- IRR
- —
- Equity multiple
- 6.65×
- Total profit
- $34,654
- Equity at exit
- $3,827
- IRR
- —
- Equity multiple
- 13.91×
- Total profit
- $79,170
- Equity at exit
- $2,873
Cash invested: $6,132 (down + closing). Projections, not guarantees.
Landlord ↔ Tenant lean methodology
- Overall (STATE)
- 92 Strongly Landlord-Friendly
- State Arkansas
- 92 Strongly Landlord-Friendly · R+14
- County
- — inherits STATE
- City
- — inherits STATE
ZIP-level market 72432
- Home prices YoY
- -1.2%
- Active inventory
- 55
- Price-to-rent
- 2.0×
Monthly cashflow live
- Estimated rent
- $927 medium interval (Pro) →
- Mortgage (P&I)
- −$115
- Tax from tax record
- −$17 /mo · $202/yr
- Insurance
- −$9
- HOA
- −$0
- Vacancy / Maint / Mgmt
- −$195
- Net cashflow
- $591
Break-even live
UW: 25.0% down · 7.5% · 30yr · 1.5% tax · 5.0% vac · 8.0% maint · 8.0% mgmt
Financing live
Cash to close
- Down payment
- $5,475
- Closing costs
- $657
- Reserves months
- —
- Total cash needed
- —
Loan-product check · same deal, 3 products live
Conventional
25% down · 7.5% · 30yr
- Down + closing
- —
- Monthly P&I
- —
- Monthly cashflow
- —
- DSCR
- —
- Eligible?
- —
Personal DTI + credit; lowest rate.
DSCR
20% down · 8.5% · 30yr
- Down + closing
- —
- Monthly P&I
- —
- Monthly cashflow
- —
- DSCR
- —
- Eligible?
- —
No personal income docs; deal must DSCR.
Hard money
10% down · 12.0% · 12mo
- Down + closing
- —
- Monthly P&I
- —
- Monthly cashflow
- —
- DSCR
- —
- Eligible?
- —
Short-term bridge; refi at stabilization.
Listing history 37 events
-
2026-06-19days on market $21,900 Active 143 DOM
-
2026-06-18days on market $21,900 Active 142 DOM
-
2026-06-17days on market $21,900 Active 141 DOM
-
2026-06-16days on market $21,900 Active 140 DOM
-
2026-06-15days on market $21,900 Active 139 DOM
-
2026-06-14days on market $21,900 Active 137 DOM
-
2026-06-13days on market $21,900 Active 136 DOM
-
2026-06-10days on market $21,900 Active 134 DOM
-
2026-06-09days on market $21,900 Active 133 DOM
-
2026-06-08days on market $21,900 Active 132 DOM
-
2026-06-07days on market $21,900 Active 131 DOM
-
2026-06-05days on market $21,900 Active 128 DOM
-
2026-06-03days on market $21,900 Active 127 DOM
-
2026-06-02days on market $21,900 Active 126 DOM
-
2026-06-01days on market $21,900 Active 125 DOM
-
2026-05-31days on market $21,900 Active 124 DOM
-
2026-05-30days on market $21,900 Active 123 DOM
-
2026-04-08price $21,900 192-char remark
Show marketing remark (192 chars)
Don't miss this great investment opportunity. This 2 Bedroom, 1 Bathroom home is on 0.27 acres in Harrisburg. This property is being sold AS-IS. Seller has not occupied the property so no SPD.
-
2026-01-27$19,900 New Listing 192-char remark
Show marketing remark (192 chars)
Don't miss this great investment opportunity. This 2 Bedroom, 1 Bathroom home is on 0.27 acres in Harrisburg. This property is being sold AS-IS. Seller has not occupied the property so no SPD.
-
2025-12-17historical
-
2025-12-17status Under Contract
-
2025-12-12historical
-
2025-11-04price $19,900
-
2025-11-03price $19,900
-
2025-10-09$21,500 Active
-
2025-10-09$21,500 New Listing
-
2025-07-25soldstatus $10,000 Sold
-
2025-07-25soldstatus $10,000 Closed
-
2025-07-03historical
-
2025-07-02status Under Contract
-
2025-06-13$15,900 New Listing
-
2025-06-13$15,900 Active
-
2023-03-30historical
-
2022-09-29$35,000
-
2022-09-29$35,000 New Listing
-
2004-03-30soldstatus $15,000
-
2001-10-29soldstatus $10,000
ⓘ Source: listings_history table (triggers on properties + properties_extension) + one-shot
backfill from property_details.listing_events for pre-trigger history.
Tax reassessment forecast AR · Resets to sale price
- Current annual tax
- $202 · $17/mo
- Projected year-2 tax
- $202 · $17/mo
- Expected delta
- $0/yr ($0/mo · 0.0%)
ⓘ Screening estimate from a state-policy table — verify with the county assessor before closing.
Nearby sold comps map
Loading sold comps map…
Walkable amenities ~0.75 mi
Loading nearby amenities…
Taxation est. · year 1
- Rental income
- $11,122
- − Mortgage interest
- −$1,227
- − Property taxes
- −$202
- − Insurance
- −$110
- − Repairs & maintenance
- −$890
- − Management
- −$890
- − Depreciation
- −$637
- Taxable income
- $7,167
- Est. tax owed @ 24.0%
- −$1,720
- After-tax cash flow
- $5,377/yr
For passive investors: Depreciation is non-cash, so a rental often shows a tax loss while cash-flowing — sheltering income. Rental losses are passive: they offset passive income freely, and up to $25,000/yr can offset ordinary (W-2) income if you actively participate and your MAGI is under $100k (phasing out to $0 by $150k); unused losses carry forward. On sale, claimed depreciation is recaptured at up to 25%, and gains may owe capital-gains tax (a 1031 exchange can defer both). Figures are a year-1 estimate at your 24.0% rate — not tax advice; consult a CPA.
Schools (NCES district)
- District
- Harrisburg School District
- NCES district ID
- 0507350
- Math proficiency
- 31% ▼ -11.00%
- Reading proficiency
- 35% ▼ -5.00%
- Median HH income
- $34,332
- Composite
- 27.19/100
- National rank
- #7021
- State rank
- #137 of 238 in AR
Livability — Harrisburg
- Score
- 56/100
- State rank
- #375
- US rank
- #22427
Category grades
Schools grade is shown separately in the Schools card above.
Census & demographics
- Census place
- Harrisburg, AR
- City population
- 6,537
- Population (ZIP)
- 6,537
Population outlook (Poinsett County) Hauer SSP2
- Today (2025)
- 22,998 people
- By 2030
- 22,356 · -2.8%
- By 2040
- 21,150 · -8.0%
- By 2050
- 20,035 · -12.9%
- By 2075
- 17,745 · -22.8%
- By 2100
- 15,358 · -33.2%
Race, ethnicity, and origin ACS 2023
- Neighborhood character
- Predominantly White (91%)
- Race & ethnicity
- White 91% Two or more races 5% Hispanic / Latino 3% Black 3%
- Common ancestry
- Iranian 1%
- Foreign-born
- 1%
- Languages at home
- 97% English-only · Spanish 2% French/Haitian/Cajun 1%
Political lean MEDSL · Poinsett
- 2024 margin
- Solid R (+63.5) · D 17.4% · R 81.0% · Other 1.6%
- 2008→2024 swing
- -36.3pp toward R · 2008: -27.2pp · 2024: -63.5pp
- All cycles
- 2024: R+63.5 2020: R+59.8 2016: R+24.1 2012: R+34.2 2008: R+27.2
Not yet ingested
- Civics
- —
Market trends
- HPI YoY
- ▼ -2.43%
- Current HPI
- 205.4239
- Rent YoY
- —
- Metro
- —
- State GDP YoY
- ▲ 3.80%
- F500 in state
- 10
Industry mix (Fortune 500 HQ in AR)
| Industry | F500 HQs | Revenue |
|---|---|---|
| Retail | 1 | $681B |
|
||
| Food / Agriculture | 1 | $53B |
|
||
| Retail / Energy | 1 | $22B |
|
||
| Transportation / Logistics | 1 | $12B |
|
||
| Energy | 1 | $4B |
|
||
Price history
+119.0% since first listed20 events — show timeline
- 2026-04-08 Price Changed $21,900 CARMLS
- 2026-01-27 Listed $19,900 CARMLS
- 2025-12-17 Delisted — NEABOR MLS
- 2025-12-17 Pending — CARMLS
- 2025-12-12 Listing Removed — CARMLS
- 2025-11-04 Price Changed $19,900 CARMLS
- 2025-11-03 Price Changed $19,900 NEABOR MLS
- 2025-10-09 Listed $21,500 NEABOR MLS
- 2025-10-09 Listed $21,500 CARMLS
- 2025-07-25 Sold (MLS) $10,000 NEABOR MLS
- 2025-07-25 Sold (MLS) $10,000 CARMLS
- 2025-07-03 Delisted — NEABOR MLS
- 2025-07-02 Pending — CARMLS
- 2025-06-13 Listed $15,900 NEABOR MLS
- 2025-06-13 Listed $15,900 CARMLS
- 2023-03-30 Listing Removed — CARMLS
- 2022-09-29 Listed $35,000 CARMLS
- 2022-09-29 Listed $35,000 NEABOR MLS
- 2004-03-30 Sold (Public Records) $15,000 Public Records
- 2001-10-29 Sold (Public Records) $10,000 Public Records
Property tax history
+9.0%/yrLatest (2019): $202 · +9.0% YoY. Source: county tax records.
Cash-flow waterfall
monthlySold comps — $/sqft
last 12 mo · ≤1 miLoading sold comps…