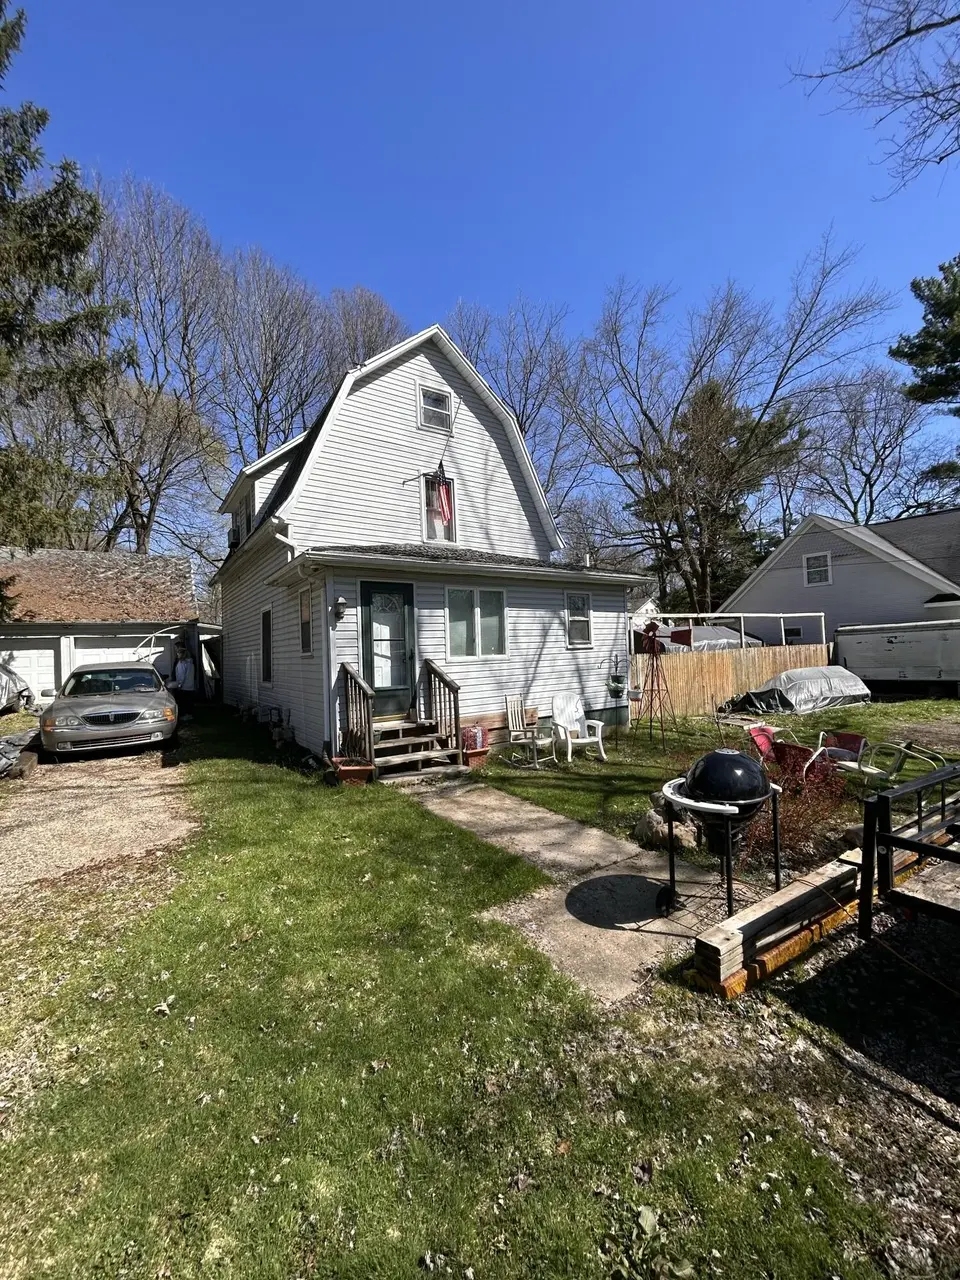
5265 E Michigan Ave · Comstock, MI
Flood risk 5/10 · Moderate
- FEMA flood zone
- X (unshaded)
- Chance of flooding over 30 yrs
- 0.5%
- Est. flood insurance / yr
- $473 – $860
Fire risk 2/10 · Minimal
- Est. fire insurance / yr
- $784 – $1,456
Heat risk 2/10 · Minimal
- Hot days now (above 98°F)
- 7 days/yr
- Hot days in 30 yrs
- 16 days/yr
Wind risk 2/10 · Minimal
- Chance of severe wind over 30 yrs
- —
Air-quality risk 2/10 · Minimal
- Unhealthy air days now
- 1 days/yr
- Unhealthy air days in 30 yrs
- 2 days/yr
Risk factors via First Street. Map © Google.
Why this score? — see what drove the C grade
The composite is a weighted blend of 9 inputs, each scored 0–100. Each bar is that input's sub-score; the figure is the points it added to the 100-point composite (weight × sub-score).
- Cash flow +19.8/30.0
- ARV discount +15.0/15.0
- DSCR +6.3/10.0
- 1% rule +5.6/10.0
- Rent growth +4.5/5.0
- Livability +2.5/5.0
- Condition / age +2.5/5.0
- Schools +2.1/10.0
- Appreciation +0.0/10.0
$115,000
🖨 Deal sheet (PDF) 📄 Offer letter ✓ Due diligence
Listing remarks MLS
This home sits off the road - which is nice. It has newer painted white kitchen cupboards. Home also has a walk-up attic the seller believes could be turned into a third bedroom. The home is full of large furniture stacked on top of each other with just a path to walk through. The seller has told me the home was properly winterized a year ago. No utilities are currently turned on.
Key facts
- Walk-up attic
- 0.41 acre lot
- 2 garage spots
Tags
Neighborhood map
What this means for you Summary
Snapshot
- This is a 2-bed/1.5-bath single-family listed at $115k.
Deal economics
- At list price, monthly cash flow is $137 ($2k/yr) — positive.
- The deal already cash-flows at list — no discount required.
- Meets the 1% rule at list price ($1k rent vs $115k).
- Recommended offer: $108k (6.0% below list) — sets the bar for market timing.
Location & tenants
- Location reads: area grade C — affects rentability + tenant quality, not the cash-flow math above.
- Comstock Public Schools (suburban): math 18% / reading 32% proficiency, ranked #428 of 540 in MI (top 79%) — low school quality limits family demand, transient renter base, plan for 1-2y turnover; 65% free/reduced lunch — lower-income household profile, screen leases tightly.
- Zoned schools: Comstock Elementary School (math 8% / reading 12%, grade F, #1,277 of 1,397 statewide, top 93%, 577 students, 79% FRL); Comstock Middle School (math 2% / reading 17%, grade F, #476 of 493 statewide, top 97%, 302 students, 80% FRL); Comstock High School (math 12% / reading 42%, grade F, #462 of 713 statewide, top 66%, 378 students, 57% FRL).
- Market conditions: Rents rising fast (+7.9%/yr); 156 active listings in the ZIP; 2 comparable units currently listed for rent nearby; 339 units permitted in Kalamazoo County in 2024 (22 in 5+ unit buildings).
Forward outlook
- Local home prices are declining (-3.0%/yr); year-one equity from $795 of loan paydown is wiped out by about $3k of value loss. Plan a longer hold.
- Kalamazoo County population projected at +18% by 2050 — long-run rental-demand tailwind backs the buy-and-hold thesis.
- At projected returns (-3.0% appreciation + 7.9% rent growth), your $32k cash investment doubles in ~9 years — after that, you're playing with house money.
Negotiation context
- It's been on market 88 days — a 6% lower offer ($108k) is reasonable based on typical stale-listing flexibility.
- 8 sale attempts since 26y ago; this cycle's ask has dropped $10k (8%) from the opening price — seller is motivated, your offer sets the floor, not the list.
- Current owner paid $59k; list at $115k implies a 95% gain — meaningful room to come down on a strong offer.
Risks & watch-outs
- Watch-outs: built in 1949 — expect roof / HVAC / electrical / plumbing capex.
- Climate carrying-cost: moderate flood risk — expect insurance premiums to compound above CPI over the hold.
Questions for the listing agent
- It's been on market 88 days. Have you received any prior offers? Is the seller open to a 6% concession, seller financing, or rate buy-down credit?
- Built in 1949 — when were the roof, HVAC, electrical panel, plumbing, and water heater last replaced?
- Why hasn't it sold? Are there any deal-killer items the seller is aware of (foundation, flood, title, zoning, code violations)?
- Is there a deadline driving the sale (1031 exchange, divorce, estate, relocation)? That informs how much negotiation room exists.
- What's the average days-on-market for RENTAL listings here right now (not sales)? A rising rental-DOM trend means longer vacancies and softer asking-rent achievability than the comps imply.
- What's the recent tenant-quality profile in this submarket — average credit score on applications, eviction rate, late-payment / NSF rate, and stable-employment percentage? A property-management company in the area should have these aggregated.
- How much new for-sale + rental construction is in the pipeline within 1–3 miles? Heavy new supply typically softens prices + rents 12–24 months out; constrained supply supports both.
Investment metrics
- 1% rule
- 1.06% ✓
- Cap rate
- 7.73%
- Cash-on-cash
- 5.12%
- DSCR
- 1.23
- GRM
- 7.8
CMA / ARV
- ARV (median comp)
- $166,751
- List price
- $115,000
- Delta
- -31.03%
- Verdict
- UNDERPRICED
- Comps
- 20 within 1.0 mi
Show comp detail 7 sales within ~0.75 mi
| Address | Dist | Beds/Ba | Sqft | Sold | Price | $/sf | Match |
|---|---|---|---|---|---|---|---|
| 233 Leenhouts St | 0.16mi | 2/1.0 | 1,065 (-4%) | 6mo | $167,000 | $157 | 79 |
| 5324 Comstock Ave | 0.44mi | 3/1.5 (+1) | 954 (-14%) | 3mo | $220,000 | $231 | 49 |
| 84 Henning St | 0.56mi | 2/1.0 | 1,008 (-9%) | 20mo | $76,000 | $75 | 40 |
| 5783 Neal St | 0.60mi | 3/2.0 (+1) | 1,248 (+12%) | 6mo | $179,500 | $144 | 39 |
| 778 Ferris St | 0.63mi | 3/1.5 (+1) | 1,059 (-5%) | 23mo | $145,000 | $137 | 38 |
| 717 Pingree St | 0.72mi | 3/2.0 (+1) | 1,056 (-5%) | 20mo | $110,000 | $104 | 34 |
| 3706 Lake St | 0.67mi | 2/1.0 | 976 (-12%) | 18mo | $70,000 | $72 | 31 |
Match score weights: distance 35% · size 25% · config 20% · recency 20%. Top-matched comps best support the ARV.
Projected returns pro-forma
-3.0% appreciation · 7.88% rent growth · sell at horizon
- IRR
- -2.8%
- Equity multiple
- 0.89×
- Total profit
- $-3,540
- Equity at exit
- $17,147
- IRR
- 11.8%
- Equity multiple
- 2.15×
- Total profit
- $36,959
- Equity at exit
- $9,943
Cash invested: $32,200 (down + closing). Projections, not guarantees.
Landlord ↔ Tenant lean methodology
- Overall (STATE)
- 62 Landlord-Friendly
- State Michigan
- 62 Landlord-Friendly · EVEN
- County
- — inherits STATE
- City
- — inherits STATE
ZIP-level market 49048
- Rents YoY
- 7.9%
- Active inventory
- 156
- Price-to-rent
- 7.8×
Monthly cashflow live
- Estimated rent
- $1,223 medium interval (Pro) →
- Mortgage (P&I)
- −$603
- Tax from tax record
- −$178 /mo · $2,135/yr
- Insurance
- −$48
- HOA
- −$0
- Vacancy / Maint / Mgmt
- −$257
- Net cashflow
- $137
Break-even live
Sensitivity live
| Price | -10% $203 | -5% $170 | +0% $137 | +5% $105 | +10% $72 |
|---|---|---|---|---|---|
| Rent | -10% $41 | -5% $89 | +0% $137 | +5% $186 | +10% $234 |
| Rate | -1.0pp $195 | -0.5pp $167 | base $137 | +0.5pp $108 | +1.0pp $77 |
UW: 25.0% down · 7.5% · 30yr · 1.5% tax · 5.0% vac · 8.0% maint · 8.0% mgmt
Financing live
Cash to close
- Down payment
- $28,750
- Closing costs
- $3,450
- Reserves months
- —
- Total cash needed
- —
Loan-product check · same deal, 3 products live
Conventional
25% down · 7.5% · 30yr
- Down + closing
- —
- Monthly P&I
- —
- Monthly cashflow
- —
- DSCR
- —
- Eligible?
- —
Personal DTI + credit; lowest rate.
DSCR
20% down · 8.5% · 30yr
- Down + closing
- —
- Monthly P&I
- —
- Monthly cashflow
- —
- DSCR
- —
- Eligible?
- —
No personal income docs; deal must DSCR.
Hard money
10% down · 12.0% · 12mo
- Down + closing
- —
- Monthly P&I
- —
- Monthly cashflow
- —
- DSCR
- —
- Eligible?
- —
Short-term bridge; refi at stabilization.
Rent comps 2 comps
| Address | Beds | Baths | Sqft | Rent | $/sqft | DOM | Units | Dist |
|---|---|---|---|---|---|---|---|---|
| 6314 E Jk Ave Kalamazoo, MI | 2.0 | 1.0 | 760 | $950 | $1.25 | 23d | 1 | 1.10mi |
| 621 Washburn Ave Kalamazoo, MI | 2.0 | 1.0 | 720 | $1,300 | $1.81 | 23d | 1 | 1.37mi |
Listing history 33 events
-
2026-06-21days on market $115,000 Active 88 DOM
-
2026-06-18days on market $115,000 Active 85 DOM
-
2026-06-17days on market $115,000 Active 84 DOM
-
2026-06-16days on market $115,000 Active 83 DOM
-
2026-06-15days on market $115,000 Active 82 DOM
-
2026-06-14days on market $115,000 Active 80 DOM
-
2026-06-13days on market $115,000 Active 79 DOM
-
2026-06-10days on market $115,000 Active 77 DOM
-
2026-06-09days on market $115,000 Active 76 DOM
-
2026-06-08days on market $115,000 Active 75 DOM
-
2026-06-07days on market $115,000 Active 74 DOM
-
2026-06-05days on market $115,000 Active 71 DOM
-
2026-06-03days on market $115,000 Active 70 DOM
-
2026-06-03remarks 444-char remark
-
2026-06-02remarks 435-char remark
-
2026-06-02pricedays on market $115,000 Active 69 DOM
-
2026-06-01days on market $124,900 Active 68 DOM
-
2026-05-31days on market $124,900 Active 67 DOM
-
2026-05-30days on market $124,900 Active 66 DOM
-
2026-03-25$124,900 Active 383-char remark
Show marketing remark (383 chars)
This home sits off the road - which is nice. It has newer painted white kitchen cupboards. Home also has a walk-up attic the seller believes could be turned into a third bedroom. The home is full of large furniture stacked on top of each other with just a path to walk through. The seller has told me the home was properly winterized a year ago. No utilities are currently turned on.
-
2026-03-25$124,900 Active
Show marketing remark (383 chars)
This home sits off the road - which is nice. It has newer painted white kitchen cupboards. Home also has a walk-up attic the seller believes could be turned into a third bedroom. The home is full of large furniture stacked on top of each other with just a path to walk through. The seller has told me the home was properly winterized a year ago. No utilities are currently turned on.
-
2014-09-16historical
-
2013-10-02soldstatus $59,000
-
2013-08-23historical
-
2013-02-25$59,900
-
2013-02-25$59,900
-
2010-06-10soldstatus $14,860
-
2010-06-10soldstatus $14,860
-
2010-04-09$20,000
-
2010-04-09$20,000
-
2000-08-04soldstatus $72,500
-
2000-05-24$74,900
ⓘ Source: listings_history table (triggers on properties + properties_extension) + one-shot
backfill from property_details.listing_events for pre-trigger history.
Tax reassessment forecast MI · Partial reset (capped growth)
- Current annual tax
- $2,135 · $178/mo
- Projected year-2 tax
- $2,135 · $178/mo
- Expected delta
- $0/yr ($0/mo · 0.0%)
ⓘ Screening estimate from a state-policy table — verify with the county assessor before closing.
Climate risk First Street
- Flood 5/10 Major FEMA zone X (unshaded) · 50% chance over 30 yrs
- Wildfire 2/10 Low
- Heat 2/10 Low 7 d/yr ≥98°F today · 16 d/yr by 30 yrs out
- Wind 2/10 Low
- Air quality 2/10 Low 1 unhealthy d/yr today · 2 by 30 yrs out
Nearby sold comps map
Loading sold comps map…
Walkable amenities ~0.75 mi
Loading nearby amenities…
Taxation est. · year 1
- Rental income
- $14,678
- − Mortgage interest
- −$6,442
- − Property taxes
- −$2,135
- − Insurance
- −$575
- − Repairs & maintenance
- −$1,174
- − Management
- −$1,174
- − Depreciation
- −$3,345
- Taxable loss
- −$167
- Est. tax savings @ 24.0%
- +$40
- After-tax cash flow
- $1,689/yr
For passive investors: Depreciation is non-cash, so a rental often shows a tax loss while cash-flowing — sheltering income. Rental losses are passive: they offset passive income freely, and up to $25,000/yr can offset ordinary (W-2) income if you actively participate and your MAGI is under $100k (phasing out to $0 by $150k); unused losses carry forward. On sale, claimed depreciation is recaptured at up to 25%, and gains may owe capital-gains tax (a 1031 exchange can defer both). Figures are a year-1 estimate at your 24.0% rate — not tax advice; consult a CPA.
Schools (NCES district)
- District
- Comstock Public Schools
- NCES district ID
- 2610590
- Math proficiency
- 18% ▼ -2.00%
- Reading proficiency
- 32% ▼ -1.00%
- Median HH income
- $41,293
- Composite
- 21.17/100
- National rank
- #8423
- State rank
- #428 of 540 in MI
Livability — Comstock
No livability data for this city. (Only ~50 U.S. cities are tracked.)
Census & demographics
- County
- Kalamazoo County · 224,317 people
- City population
- 22,791
- Metro
- Kalamazoo-Portage, MI
- Population (ZIP)
- 22,791
- Household income
- $60,454
- Rent vs Own
- Severe rent burden
- 835.0
Population outlook (Kalamazoo County) Hauer SSP2
- Today (2025)
- 280,982 people
- By 2030
- 292,068 · +3.9%
- By 2040
- 312,191 · +11.1%
- By 2050
- 331,196 · +17.9%
- By 2075
- 379,021 · +34.9%
- By 2100
- 396,579 · +41.1%
Race, ethnicity, and origin ACS 2023
- Neighborhood character
- Predominantly White (67%)
- Race & ethnicity
- White 67% Black 20% Hispanic / Latino 7% Two or more races 7% Asian 2%
- Hispanic origin (detail)
- Mexican 4%
- Common ancestry
- Iranian 6% Romanian 4% Lithuanian 2%
- Foreign-born
- 4% · Canada
- Languages at home
- 94% English-only · Spanish 3% Other Indo-European 1%
Political lean MEDSL · Kalamazoo
- 2024 margin
- D (+17.7) · D 58.0% · R 40.3% · Other 1.7%
- 2008→2024 swing
- -1.8pp toward R · 2008: 19.5pp · 2024: 17.7pp
- All cycles
- 2024: D+17.7 2020: D+18.7 2016: D+12.8 2012: D+13.3 2008: D+19.5
Not yet ingested
- Civics
- —
Market trends
- HPI YoY
- ▼ -205.26%
- Current HPI
- 180.4766
- Rent YoY
- ▲ 7.88%
- Metro
- Kalamazoo-Portage, MI
- State GDP YoY
- ▲ 1.37%
- F500 in state
- 28
Industry mix (Fortune 500 HQ in MI)
| Industry | F500 HQs | Revenue |
|---|---|---|
| Automotive Parts | 3 | $48B |
|
||
| Automotive | 2 | $372B |
|
||
| Chemicals | 1 | $45B |
|
||
| Automotive Retail | 1 | $29B |
|
||
| Healthcare / Medical Devices | 1 | $23B |
|
||
| Automotive Technology | 1 | $20B |
|
||
Price history
+66.8% since first listed14 events — show timeline
- 2026-03-25 Listed $124,900 REALCOMP
- 2026-03-25 Listed $124,900 MiRealSource-MiMLS
- 2026-03-25 Listed $124,900 SW Michigan MLS
- 2014-09-16 Listing Removed — SW Michigan MLS
- 2013-10-02 Sold (Public Records) $59,000 Public Records
- 2013-08-23 Listing Removed — REALCOMP
- 2013-02-25 Listed $59,900 REALCOMP
- 2013-02-25 Listed $59,900 SW Michigan MLS
- 2010-06-10 Sold (MLS) $14,860 REALCOMP
- 2010-06-10 Sold (MLS) $14,860 SW Michigan MLS
- 2010-04-09 Listed $20,000 REALCOMP
- 2010-04-09 Listed $20,000 SW Michigan MLS
- 2000-08-04 Sold (MLS) $72,500 SW Michigan MLS
- 2000-05-24 Listed $74,900 SW Michigan MLS
Property tax history
+7.1%/yrLatest (2025): $2,135 · +4.7% YoY. Source: county tax records.
Cash-flow waterfall
monthlySold comps — $/sqft
last 12 mo · ≤1 miLoading sold comps…