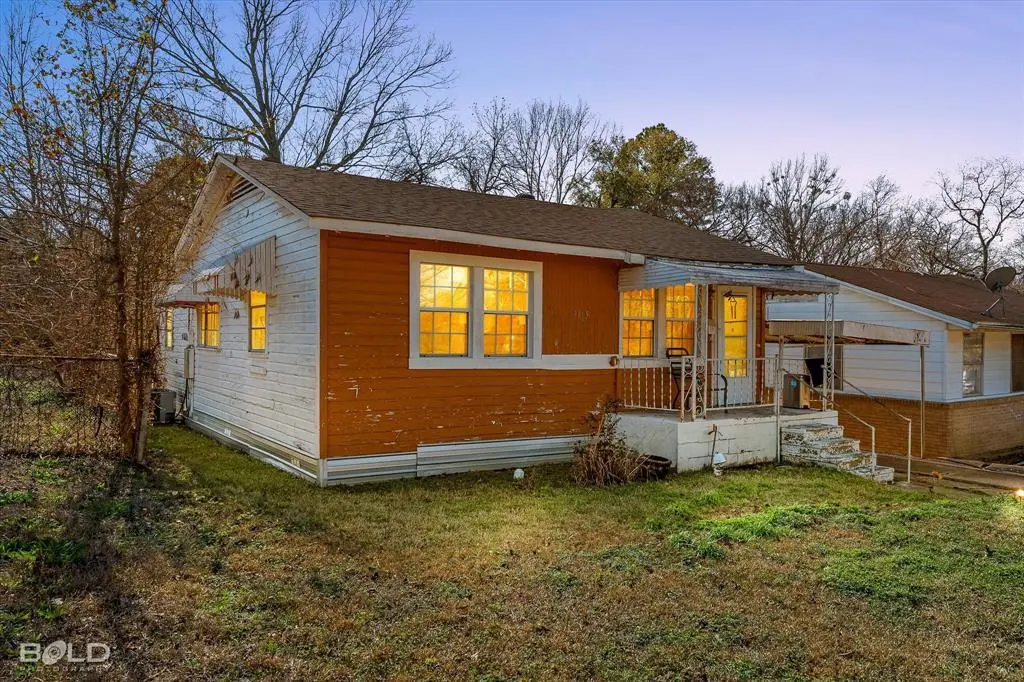
3105 Metal St · Shreveport, LA
Flood risk 1/10 · Minimal
- FEMA flood zone
- X (unshaded)
- Chance of flooding over 30 yrs
- 0.0%
- Est. flood insurance / yr
- $507 – $1,088
Fire risk 1/10 · Minimal
- Est. fire insurance / yr
- $1,269 – $2,357
Heat risk 7/10 · Major
- Hot days now (above 110°F)
- 7 days/yr
- Hot days in 30 yrs
- 21 days/yr
Wind risk 6/10 · Moderate
- Chance of severe wind over 30 yrs
- 64.0%
Air-quality risk 2/10 · Minimal
- Unhealthy air days now
- 1 days/yr
- Unhealthy air days in 30 yrs
- 1 days/yr
Risk factors via First Street. Map © Google.
Why this score? — see what drove the B- grade
The composite is a weighted blend of 9 inputs, each scored 0–100. Each bar is that input's sub-score; the figure is the points it added to the 100-point composite (weight × sub-score).
- Cash flow +27.4/30.0
- DSCR +9.6/10.0
- ARV discount +7.5/15.0
- 1% rule +6.5/10.0
- Appreciation +4.9/10.0
- Livability +3.0/5.0
- Rent growth +2.5/5.0
- Condition / age +2.5/5.0
- Schools +2.2/10.0
$67,000
🖨 Deal sheet (PDF) 📄 Offer letter ✓ Due diligence
Listing remarks
This updated 2 bed 1 bath property offers 1,032 square feet of thoughtfully remodeled living space and presents a great rental opportunity or income producing property. With modern updates already completed, this home is move in ready and well suited for both investors and owner occupants. The layout is efficient and comfortable, making excellent use of the space while providing a welcoming feel throughout. Recent updates, including new foundation beams and plumbing improvements, add to the long term value and overall appeal of the home. Located close to many amenities including shopping, dining, and everyday conveniences, this property offers easy access to everything tenants or homeowners
Key facts
- Easy access
- Modern updates
- New foundation beams
Tags
Property features AI
Finance
- HOA & community: No association
Exterior
- Parking: Attached carport; Carport (1 covered space); Driveway
- Utilities: City water; City sewer; No municipal utility district
- Home design: Single-family residence; Attached property; Built in 1960
- Construction: Built in 1960
- Exterior features: Lot under 0.5 acre (approximately 0.124 acre); Subdivision: Washington Sub
Interior
- Kitchen: Refrigerator
- Bedrooms: Primary bedroom on main level; Total bedrooms: 2
- Bathrooms: 1 full bathroom
- Interior features: Built-in features; Cable TV available; Decorative lighting; High-speed internet available; One living area; One dining area; Total rooms: 3; One-level layout
Neighborhood map
What this means for you Summary
Snapshot
- This is a 2-bed/1.0-bath single-family listed at $67k.
Deal economics
- At list price, monthly cash flow is $197 ($2k/yr) — positive.
- The deal already cash-flows at list — no discount required.
- Meets the 1% rule at list price ($772 rent vs $67k).
- Recommended offer: $65k (3.0% below list) — sets the bar for market timing.
- Cap rate 9.8% vs local median 5.6% in Shreveport — top-decile yield for the area; either an underpriced asset or a hidden risk that comps aren't pricing in. Stress-test before assuming the spread holds.
Location & tenants
- Location reads 59/100 on livability (#270 in LA) — a working-class tenant base; expect higher turnover. Strengths: cost of living A+, housing A; Watch: schools D+, crime F, amenities F.
- Caddo Parish (urban): math 21% / reading 32% proficiency, ranked #53 of 98 in LA (top 54%) — low school quality limits family demand, transient renter base, plan for 1-2y turnover; 64% free/reduced lunch — lower-income household profile, screen leases tightly.
- Market conditions: 70 active listings in the ZIP; 16 comparable units currently listed for rent nearby; rentals lingering (median 45d on market — plan ~5-8 weeks vacancy on turnover, expect pricing pressure); 56% of comp listings sitting > 30 days — soft ceiling on asking rent; 221 units permitted in Caddo Parish in 2024 (0 in 5+ unit buildings).
Forward outlook
- In year one you build about $352 of equity ($463 loan paydown + $-111 appreciation (-0.2% local appreciation)).
- Caddo County population projected at -15% by 2050 — secular population decline; favor cash flow + early exit over multi-decade hold.
- At projected returns (-0.2% appreciation + 3.0% rent growth), your $19k cash investment doubles in ~6 years — after that, you're playing with house money.
Negotiation context
- It's been on market 55 days — a 3% lower offer ($65k) is reasonable based on typical stale-listing flexibility.
- 2 sale attempts with the ask held roughly flat each time — persistent listings suggest the price (not the market) is what's stuck; bring a comps-based counter.
Risks & watch-outs
- Climate carrying-cost: major wind risk, 64% chance of damaging wind over 30y; extreme-heat days projected 7→21/yr by 2055 (HVAC capex compounding) — expect insurance premiums to compound above CPI over the hold.
Questions for the listing agent
- It's been on market 55 days. Have you received any prior offers? Is the seller open to a 3% concession, seller financing, or rate buy-down credit?
- Built in 1960 — when were the roof, HVAC, electrical panel, plumbing, and water heater last replaced?
- Is there a deadline driving the sale (1031 exchange, divorce, estate, relocation)? That informs how much negotiation room exists.
- Schools are D-rated, which usually means shorter tenancies and higher turnover. Who's the typical renter profile here, and what's been the actual vacancy rate?
- Crime grade is F in this area — have there been break-ins, vandalism, or insurance claims at this property in the last 3 years? What carrier currently insures it and at what premium?
- What's the average days-on-market for RENTAL listings here right now (not sales)? A rising rental-DOM trend means longer vacancies and softer asking-rent achievability than the comps imply.
- What's the recent tenant-quality profile in this submarket — average credit score on applications, eviction rate, late-payment / NSF rate, and stable-employment percentage? A property-management company in the area should have these aggregated.
- How much new for-sale + rental construction is in the pipeline within 1–3 miles? Heavy new supply typically softens prices + rents 12–24 months out; constrained supply supports both.
Investment metrics
- 1% rule
- 1.15% ✓
- Cap rate
- 9.81%
- Cash-on-cash
- 12.57%
- DSCR
- 1.56
- GRM
- 7.2
CMA / ARV
- ARV (median comp)
- $28,549
- List price
- $67,000
- Delta
- 134.68%
- Verdict
- OVERPRICED
- Comps
- 20 within 1.0 mi
Show comp detail 12 sales within ~0.75 mi
| Address | Dist | Beds/Ba | Sqft | Sold | Price | $/sf | Match |
|---|---|---|---|---|---|---|---|
| 3121 Ashton St | 0.07mi | 2/1.0 | 1,016 (-2%) | 1mo | $31,000 | $31 | 93 |
| 3137 Looney St | 0.14mi | 2/1.0 | 1,134 (+10%) | 2mo | $60,000 | $53 | 76 |
| 2935 Poland St | 0.26mi | 3/1.0 (+1) | 1,030 (-0%) | 19mo | $17,000 | $17 | 67 |
| 2937 Looney St | 0.15mi | 3/1.0 (+1) | 1,017 (-2%) | 23mo | $21,000 | $21 | 67 |
| 2824 W Caperton St | 0.52mi | 2/1.0 | 1,100 (+7%) | 2mo | $60,900 | $55 | 63 |
| 1821 Dolphine | 0.62mi | 2/1.0 | 1,100 (+7%) | 4mo | $19,000 | $17 | 57 |
| 1438 Arlington Ave | 0.74mi | 3/1.0 (+1) | 1,030 (-0%) | 4mo | $19,500 | $19 | 57 |
| 2609 Ashton St | 0.42mi | 3/1.0 (+1) | 1,144 (+11%) | 1mo | $55,000 | $48 | 56 |
| 1411 Hassett Ave | 0.68mi | 3/1.0 (+1) | 1,060 (+3%) | 6mo | $20,000 | $19 | 53 |
| 1713 Madison Ave | 0.73mi | 3/1.0 (+1) | 1,066 (+3%) | 5mo | $23,000 | $22 | 51 |
| 3221 W College St | 0.70mi | 3/2.0 (+1) | 1,029 (-0%) | 14mo | $39,900 | $39 | 46 |
| 3102 W Laurel St | 0.34mi | 3/2.0 (+1) | 1,169 (+13%) | 13mo | $55,000 | $47 | 42 |
Match score weights: distance 35% · size 25% · config 20% · recency 20%. Top-matched comps best support the ARV.
Projected returns pro-forma
-0.17% appreciation · 3.0% rent growth · sell at horizon
- IRR
- 11.3%
- Equity multiple
- 1.53×
- Total profit
- $10,021
- Equity at exit
- $18,902
- IRR
- 16.3%
- Equity multiple
- 2.76×
- Total profit
- $32,977
- Equity at exit
- $22,285
Cash invested: $18,760 (down + closing). Projections, not guarantees.
Landlord ↔ Tenant lean methodology
- Overall (STATE)
- 90 Strongly Landlord-Friendly
- State Louisiana
- 90 Strongly Landlord-Friendly · R+12
- County
- — inherits STATE
- City
- — inherits STATE
ZIP-level market 71103
- Home prices YoY
- -0.6%
- Active inventory
- 70
- Price-to-rent
- 7.2×
Monthly cashflow live
- Estimated rent
- $772 high interval (Pro) →
- Mortgage (P&I)
- −$351
- Tax from tax record
- −$34 /mo · $411/yr
- Insurance
- −$28
- HOA
- −$0
- Vacancy / Maint / Mgmt
- −$162
- Net cashflow
- $197
Break-even live
Sensitivity live
| Price | -10% $234 | -5% $216 | +0% $197 | +5% $178 | +10% $159 |
|---|---|---|---|---|---|
| Rent | -10% $136 | -5% $166 | +0% $197 | +5% $227 | +10% $258 |
| Rate | -1.0pp $230 | -0.5pp $214 | base $197 | +0.5pp $179 | +1.0pp $162 |
UW: 25.0% down · 7.5% · 30yr · 1.5% tax · 5.0% vac · 8.0% maint · 8.0% mgmt
Financing live
Cash to close
- Down payment
- $16,750
- Closing costs
- $2,010
- Reserves months
- —
- Total cash needed
- —
Loan-product check · same deal, 3 products live
Conventional
25% down · 7.5% · 30yr
- Down + closing
- —
- Monthly P&I
- —
- Monthly cashflow
- —
- DSCR
- —
- Eligible?
- —
Personal DTI + credit; lowest rate.
DSCR
20% down · 8.5% · 30yr
- Down + closing
- —
- Monthly P&I
- —
- Monthly cashflow
- —
- DSCR
- —
- Eligible?
- —
No personal income docs; deal must DSCR.
Hard money
10% down · 12.0% · 12mo
- Down + closing
- —
- Monthly P&I
- —
- Monthly cashflow
- —
- DSCR
- —
- Eligible?
- —
Short-term bridge; refi at stabilization.
Rent comps 16 comps
| Address | Beds | Baths | Sqft | Rent | $/sqft | DOM | Units | Dist |
|---|---|---|---|---|---|---|---|---|
| 3101 Harp St Shreveport, LA | 3.0 | 1.0 | 839 | $850 | $1.01 | 22d | 1 | 0.15mi |
| 2712 Ashton St Shreveport, LA | 2.0 | 1.0 | 875 | $700 | $0.80 | 15d | 1 | 0.36mi |
| 509 Alabama Ave SE Shreveport, LA | 2.0 | 1.0 | 700 | $700 | $1.00 | 45d | 1 | 0.42mi |
| 3612 Michigan Blvd Shreveport, LA | 2.0 | 1.0 | 1200 | $615 | $0.51 | 15d | 1 | 0.59mi |
| 3022 Lillian St Shreveport, LA | 2.0 | 1.0 | 1115 | $695 | $0.62 | 22d | 1 | 0.62mi |
| 3420 Darien St Shreveport, LA | 2.0 | 1.0 | 1200 | $665 | $0.55 | 15d | 1 | 0.80mi |
| 3323 Darien St Shreveport, LA | 3.0 | 1.0 | 1200 | $785 | $0.65 | 45d | 1 | 0.80mi |
| 2042 Laurel St Shreveport, LA | 3.0 | 1.0 | 1100 | $800 | $0.73 | 45d | 1 | 0.88mi |
| 3515 Stonewall St Shreveport, LA | 2.0 | 1.0 | 1000 | $600 | $0.60 | 15d | 1 | 0.90mi |
| 1818 Perrin St Shreveport, LA | 3.0 | 1.5 | 1129 | $895 | $0.79 | 45d | 1 | 1.24mi |
| 3240 Jackson St Shreveport, LA | 2.0 | 1.0 | 1014 | $700 | $0.69 | 15d | 1 | 1.26mi |
| 1928 Alston St Shreveport, LA | 3.0 | 2.0 | 1100 | $750 | $0.68 | 45d | 1 | 1.27mi |
| 1719 Lakeshore Dr Shreveport, LA | 3.0 | 1.5 | 1200 | $950 | $0.79 | 45d | 1 | 1.32mi |
| 3907 Milton St Shreveport, LA | 3.0 | 1.5 | 1275 | $1,100 | $0.86 | 45d | 1 | 1.36mi |
| 4223 Lakeshore Dr Shreveport, LA | 1.0–3.0 | 1.0–2.0 | 1002 | $798 | $0.80 | 45d | 1 | 1.41mi |
| 3628 Sumner St Shreveport, LA | 3.0 | 1.0 | 956 | $950 | $0.99 | 45d | 1 | 1.41mi |
Listing history 23 events
-
2026-06-21days on market $67,000 Active 55 DOM
-
2026-06-18days on market $67,000 Active 52 DOM
-
2026-06-17days on market $67,000 Active 51 DOM
-
2026-06-16days on market $67,000 Active 50 DOM
-
2026-06-15days on market $67,000 Active 49 DOM
-
2026-06-14days on market $67,000 Active 47 DOM
-
2026-06-13days on market $67,000 Active 46 DOM
-
2026-06-10days on market $67,000 Active 44 DOM
-
2026-06-09days on market $67,000 Active 43 DOM
-
2026-06-08days on market $67,000 Active 42 DOM
-
2026-06-07days on market $67,000 Active 41 DOM
-
2026-06-05days on market $67,000 Active 38 DOM
-
2026-06-03days on market $67,000 Active 37 DOM
-
2026-06-02days on market $67,000 Active 36 DOM
-
2026-06-01days on market $67,000 Active 35 DOM
-
2026-05-31days on market $67,000 Active 34 DOM
-
2026-05-30days on market $67,000 Active 33 DOM
-
2026-04-27historical
-
2026-04-27$67,000 Active 1205-char remark
-
2026-04-16price $58,000
-
2026-04-03price $63,000
-
2026-01-26$65,000 Active
-
2001-02-22soldstatus
ⓘ Source: listings_history table (triggers on properties + properties_extension) + one-shot
backfill from property_details.listing_events for pre-trigger history.
Tax reassessment forecast LA · Resets to sale price
- Current annual tax
- $411 · $34/mo
- Projected year-2 tax
- $411 · $34/mo
- Expected delta
- $0/yr ($0/mo · 0.0%)
ⓘ Screening estimate from a state-policy table — verify with the county assessor before closing.
Climate risk First Street
- Flood 1/10 Low FEMA zone X (unshaded) · 0% chance over 30 yrs
- Wildfire 1/10 Low
- Heat 7/10 Severe 7 d/yr ≥110°F today · 21 d/yr by 30 yrs out
- Wind 6/10 Major 64% chance of damaging wind over 30 yrs
- Air quality 2/10 Low 1 unhealthy d/yr today · 1 by 30 yrs out
Nearby sold comps map
Loading sold comps map…
Walkable amenities ~0.75 mi
Loading nearby amenities…
Taxation est. · year 1
- Rental income
- $9,268
- − Mortgage interest
- −$3,753
- − Property taxes
- −$411
- − Insurance
- −$335
- − Repairs & maintenance
- −$741
- − Management
- −$741
- − Depreciation
- −$1,949
- Taxable income
- $1,336
- Est. tax owed @ 24.0%
- −$321
- After-tax cash flow
- $2,038/yr
For passive investors: Depreciation is non-cash, so a rental often shows a tax loss while cash-flowing — sheltering income. Rental losses are passive: they offset passive income freely, and up to $25,000/yr can offset ordinary (W-2) income if you actively participate and your MAGI is under $100k (phasing out to $0 by $150k); unused losses carry forward. On sale, claimed depreciation is recaptured at up to 25%, and gains may owe capital-gains tax (a 1031 exchange can defer both). Figures are a year-1 estimate at your 24.0% rate — not tax advice; consult a CPA.
Schools (NCES district)
- District
- Caddo Parish
- NCES district ID
- 2200300
- Math proficiency
- 21% ▼ -33.00%
- Reading proficiency
- 32% ▼ -30.00%
- Median HH income
- $39,227
- Composite
- 22.23/100
- National rank
- #8148
- State rank
- #53 of 98 in LA
Livability — Shreveport
- Score
- 59/100
- State rank
- #270
- US rank
- #19730
Category grades
Schools grade is shown separately in the Schools card above.
Census & demographics
- Census place
- Shreveport, LA
- City population
- 164,123
- Population (ZIP)
- 6,142
Population outlook (Caddo County) Hauer SSP2
- Today (2025)
- 243,190 people
- By 2030
- 237,231 · -2.5%
- By 2040
- 222,502 · -8.5%
- By 2050
- 206,516 · -15.1%
- By 2075
- 165,706 · -31.9%
- By 2100
- 122,262 · -49.7%
Race, ethnicity, and origin ACS 2023
- Neighborhood character
- Predominantly Black (81%)
- Race & ethnicity
- Black 81% White 17% Hispanic / Latino 1%
- Common ancestry
- Slovak 3% Hispanic 1%
- Languages at home
- 99% English-only · Spanish 1%
Political lean MEDSL · Caddo
- 2024 margin
- Toss-up / Even · D 51.6% · R 47.0% · Other 1.4%
- 2008→2024 swing
- +1.6pp toward D · 2008: 3.0pp · 2024: 4.6pp
- All cycles
- 2024: D+4.6 2020: D+6.8 2016: D+4.2 2012: D+4.9 2008: D+3.0
Not yet ingested
- Civics
- —
Market trends
- HPI YoY
- ▼ -0.17%
- Current HPI
- 26.3904
- Rent YoY
- —
- Metro
- —
- State GDP YoY
- ▲ 3.29%
- F500 in state
- 10
Industry mix (Fortune 500 HQ in LA)
| Industry | F500 HQs | Revenue |
|---|---|---|
| Telecommunications | 2 | $23B |
|
||
| Utilities | 1 | $12B |
|
||
| Wholesale / Distribution | 1 | $5B |
|
||
| Advertising | 1 | $2B |
|
||
Price history
+3.1% since first listed6 events — show timeline
- 2026-04-27 Listed $67,000 NTREIS
- 2026-04-27 Listing Removed — NTREIS
- 2026-04-16 Price Changed $58,000 NTREIS
- 2026-04-03 Price Changed $63,000 NTREIS
- 2026-01-26 Listed $65,000 NTREIS
- 2001-02-22 Sold (Public Records) — Public Records
Property tax history
+15.8%/yrLatest (2025): $411 · +0.4% YoY. Source: county tax records.
Cash-flow waterfall
monthlySold comps — $/sqft
last 12 mo · ≤1 miLoading sold comps…