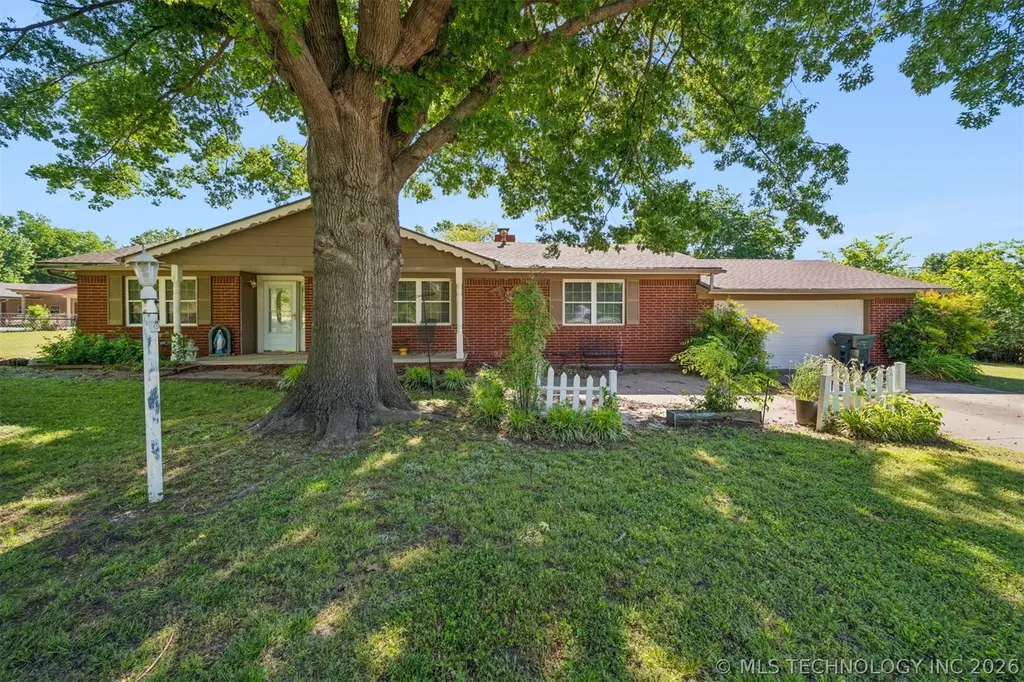
758 Summer Ln · Claremore, OK
Flood risk 1/10 · Minimal
- FEMA flood zone
- X (unshaded)
- Chance of flooding over 30 yrs
- 0.0%
- Est. flood insurance / yr
- $507 – $1,088
Fire risk 5/10 · Moderate
- Est. fire insurance / yr
- $2,463 – $4,575
Heat risk 6/10 · Moderate
- Hot days now (above 111°F)
- 7 days/yr
- Hot days in 30 yrs
- 18 days/yr
Wind risk 2/10 · Minimal
- Chance of severe wind over 30 yrs
- 4.0%
Air-quality risk 2/10 · Minimal
- Unhealthy air days now
- 1 days/yr
- Unhealthy air days in 30 yrs
- 1 days/yr
Risk factors via First Street. Map © Google.
Why this score? — see what drove the C grade
The composite is a weighted blend of 9 inputs, each scored 0–100. Each bar is that input's sub-score; the figure is the points it added to the 100-point composite (weight × sub-score).
- Cash flow +21.6/30.0
- ARV discount +15.0/15.0
- DSCR +6.9/10.0
- 1% rule +4.6/10.0
- Livability +3.7/5.0
- Rent growth +3.2/5.0
- Condition / age +2.5/5.0
- Schools +2.1/10.0
- Appreciation +0.0/10.0
$180,000
🖨 Deal sheet 📄 Offer letter ✓ Due diligence
Listing remarks
Opportunity awaits on this spacious 3 bedroom 2 bath home on over 1 acre with plenty of room to make it your own! Features 2 living areas, bringing the potential for a 4th bedroom, home office or playroom. Outside, enjoy a large backyard, RV carport with additional storage shed-perfect for extra parking, hobbies or just storage. This property is in need of a complete renovation and is being SOLD AS IS making it an excellent opportunity for investors or buyers looking to customize a home on acreage. Bring your vision and unlock the potential this property has to offer.
Key facts
- Large backyard
- Complete renovation
- Rv carport
Tags
Property features AI
Exterior
- Parking: Attached garage with 3 spaces
- Security: Owned security system; Smoke detector(s); No safety shelter
- Utilities: Electricity available; Natural gas available; Public water; Septic tank
- Home design: Single-story home; Faces west; Crawlspace foundation
- Construction: Built from brick, vinyl siding and wood frame; Asphalt fiberglass roof
- Exterior features: Covered patio and porch; Porch; Shed(s); Mature trees
Interior
- Kitchen: Dishwasher; Oven; Range
- Flooring: Carpet; Laminate
- Bathrooms: 2 full bathrooms
- Heating & cooling: Central heating (gas); Central air conditioning
- Interior features: Ceiling fan(s); Laminate counters; Electric oven and range connections; Vinyl window frames
- Laundry & utility: Washer hookup; Gas water heater
Neighborhood map
What this means for you Summary
Snapshot
- This is a 4-bed/2.0-bath single-family listed at $180k.
Deal economics
- At list price, monthly cash flow is $274 ($3k/yr) — positive.
- The deal already cash-flows at list — no discount required.
- To meet the 1% rule (rent ≥ 1% of price), the offer needs to be $172k (4.4% below list).
- Recommended offer: $172k (4.4% below list) — sets the bar for 1% rule.
- Cap rate 8.1% vs local median 4.1% in Claremore — top-decile yield for the area; either an underpriced asset or a hidden risk that comps aren't pricing in. Stress-test before assuming the spread holds.
Location & tenants
- Location reads 73/100 on livability (#20 in OK) — a middle-class / working-renter tenant base. Strengths: cost of living A+, housing A+, health & safety A; Watch: schools D, amenities F, commute F.
- Claremore (town): math 24% / reading 25% proficiency, ranked #111 of 270 in OK (top 41%) — low school quality limits family demand, transient renter base, plan for 1-2y turnover.
- Market conditions: Rents rising (+2.6%/yr); 181 active listings in the ZIP; 3 comparable units currently listed for rent nearby; rentals leasing fast (median 10d on market — plan ~1-2 weeks tenant-placement turnaround); 608 units permitted in Rogers County in 2024 (7 in 5+ unit buildings).
- This rent runs 32% of the median local income ($65k/yr) — at the standard rent-burdened threshold; future hikes will face affordability resistance.
Forward outlook
- Local home prices are declining (-3.0%/yr); year-one equity from $1k of loan paydown is wiped out by about $5k of value loss. Plan a longer hold.
- Rogers County population projected at +16% by 2050 — long-run rental-demand tailwind backs the buy-and-hold thesis.
Negotiation context
- Only 8 days on market — expect competitive offers; lowballing is unlikely to land.
- 6 sale attempts since 35y ago with the ask held roughly flat each time — persistent listings suggest the price (not the market) is what's stuck; bring a comps-based counter.
- Current owner paid $71k; list at $180k implies a 154% gain — meaningful room to come down on a strong offer.
Risks & watch-outs
- Climate carrying-cost: moderate wildfire risk; extreme-heat days projected 7→18/yr by 2055 (HVAC capex compounding) — expect insurance premiums to compound above CPI over the hold.
Questions for the listing agent
- Built in 1965 — when were the roof, HVAC, electrical panel, plumbing, and water heater last replaced?
- Is there a deadline driving the sale (1031 exchange, divorce, estate, relocation)? That informs how much negotiation room exists.
- Schools are D-rated, which usually means shorter tenancies and higher turnover. Who's the typical renter profile here, and what's been the actual vacancy rate?
- What's the average days-on-market for RENTAL listings here right now (not sales)? A rising rental-DOM trend means longer vacancies and softer asking-rent achievability than the comps imply.
- What's the recent tenant-quality profile in this submarket — average credit score on applications, eviction rate, late-payment / NSF rate, and stable-employment percentage? A property-management company in the area should have these aggregated.
- How much new for-sale + rental construction is in the pipeline within 1–3 miles? Heavy new supply typically softens prices + rents 12–24 months out; constrained supply supports both.
Investment metrics
- 1% rule
- 0.96% ✗
- Cap rate
- 8.12%
- Cash-on-cash
- 6.53%
- DSCR
- 1.29
- GRM
- 8.7
CMA / ARV
- ARV (on-the-fly)
- $277,776
- Comps found
- 12
Show comp detail 12 sales within ~0.75 mi
| Address | Dist | Beds/Ba | Sqft | Sold | Price | $/sf | Match |
|---|---|---|---|---|---|---|---|
| 738 Winter Ln | 0.30mi | 4/2.0 | 1,894 (-2%) | 9mo | $255,000 | $135 | 76 |
| 759 Spring Ln | 0.07mi | 4/2.0 | 1,717 (-11%) | 13mo | $247,500 | $144 | 68 |
| 3112 W Berwick St | 0.62mi | 4/2.5 | 1,942 (+1%) | 3mo | $285,000 | $147 | 65 |
| 2913 W Berwick St | 0.50mi | 3/2.5 (-1) | 1,934 (+0%) | 14mo | $295,000 | $153 | 58 |
| 751 Christmas Ln | 0.46mi | 3/2.5 (-1) | 2,067 (+7%) | 3mo | $260,000 | $126 | 57 |
| 3111 W Berwick St | 0.59mi | 3/3.0 (-1) | 1,940 (+1%) | 11mo | $255,000 | $131 | 53 |
| 2418 Westwood Dr | 0.71mi | 3/2.0 (-1) | 1,805 (-6%) | 10mo | $255,000 | $141 | 43 |
| 3011 W Berwick St | 0.68mi | 3/2.0 (-1) | 1,730 (-10%) | 4mo | $224,000 | $129 | 43 |
| 742 Christmas Ln | 0.53mi | 3/2.0 (-1) | 1,701 (-12%) | 13mo | $253,000 | $149 | 40 |
| 2403 S Maywood Dr | 0.69mi | 3/2.0 (-1) | 1,750 (-9%) | 12mo | $252,000 | $144 | 38 |
| 2412 S Maywood Dr | 0.73mi | 3/2.0 (-1) | 2,183 (+13%) | 3mo | $270,000 | $124 | 36 |
| 602 Rosewood Ct | 0.64mi | 5/3.0 (+1) | 2,175 (+13%) | 5mo | $315,000 | $145 | 36 |
Match score weights: distance 35% · size 25% · config 20% · recency 20%. Top-matched comps best support the ARV.
Projected returns pro-forma
-3.0% appreciation · 2.62% rent growth · sell at horizon
- IRR
- -6.7%
- Equity multiple
- 0.75×
- Total profit
- $-12,423
- Equity at exit
- $26,839
- IRR
- 2.5%
- Equity multiple
- 1.17×
- Total profit
- $8,719
- Equity at exit
- $15,563
Cash invested: $50,400 (down + closing). Projections, not guarantees.
Landlord ↔ Tenant lean methodology
- Overall (STATE)
- 83 Strongly Landlord-Friendly
- State Oklahoma
- 83 Strongly Landlord-Friendly · R+20
- County
- — inherits STATE
- City
- — inherits STATE
ZIP-level market 74017
- Home prices YoY
- -20.1%
- Rents YoY
- 2.6%
- Active inventory
- 181
- Price-to-rent
- 8.7×
Monthly cashflow live
- Estimated rent
- $1,721 medium interval (Pro) →
- Mortgage (P&I)
- −$944
- Tax from tax record
- −$66 /mo · $796/yr
- Insurance
- −$75
- HOA
- −$0
- Vacancy / Maint / Mgmt
- −$361
- Net cashflow
- $274
Break-even live
UW: 25.0% down · 7.5% · 30yr · 1.5% tax · 5.0% vac · 8.0% maint · 8.0% mgmt
Financing live
Cash to close
- Down payment
- $45,000
- Closing costs
- $5,400
- Reserves months
- —
- Total cash needed
- —
Loan-product check · same deal, 3 products live
Conventional
25% down · 7.5% · 30yr
- Down + closing
- —
- Monthly P&I
- —
- Monthly cashflow
- —
- DSCR
- —
- Eligible?
- —
Personal DTI + credit; lowest rate.
DSCR
20% down · 8.5% · 30yr
- Down + closing
- —
- Monthly P&I
- —
- Monthly cashflow
- —
- DSCR
- —
- Eligible?
- —
No personal income docs; deal must DSCR.
Hard money
10% down · 12.0% · 12mo
- Down + closing
- —
- Monthly P&I
- —
- Monthly cashflow
- —
- DSCR
- —
- Eligible?
- —
Short-term bridge; refi at stabilization.
Rent comps 3 comps
| Address | Beds | Baths | Sqft | Rent | $/sqft | DOM | Units | Dist |
|---|---|---|---|---|---|---|---|---|
| 2805 Trailwood Dr Unit B Claremore, OK | 3.0 | 2.0 | 1288 | $1,500 | $1.16 | 10d | 1 | 0.58mi |
| 2808 Ridgeview Pl Unit A Claremore, OK | 3.0 | 2.0 | 1288 | $1,500 | $1.16 | 1d | 1 | 0.61mi |
| 1307 W Missouri Ave Claremore, OK | 4.0 | 2.0 | 1853 | $1,975 | $1.07 | 23d | 1 | 1.39mi |
Listing history 12 events
-
2026-05-13status Pending
-
2026-05-07$180,000 Active
-
1993-12-27soldstatus $71,000
-
1993-09-08$73,000
-
1993-01-16historical
-
1992-07-16$79,900
-
1992-07-16historical
-
1992-01-16$75,900
-
1991-12-30historical
-
1991-06-30$79,900
-
1991-06-30historical
-
1991-01-07$79,900
ⓘ Source: listings_history table (triggers on properties + properties_extension) + one-shot
backfill from property_details.listing_events for pre-trigger history.
Tax reassessment forecast OK · Resets to sale price
- Current annual tax
- $796 · $66/mo
- Projected year-2 tax
- $1,620 · $135/mo
- Expected delta
- +$824/yr (+$69/mo · 103.5%)
ⓘ Screening estimate from a state-policy table — verify with the county assessor before closing.
Climate risk First Street
- Flood 1/10 Low FEMA zone X (unshaded) · 0% chance over 30 yrs
- Wildfire 5/10 Major
- Heat 6/10 Major 7 d/yr ≥111°F today · 18 d/yr by 30 yrs out
- Wind 2/10 Low 4% chance of damaging wind over 30 yrs
- Air quality 2/10 Low 1 unhealthy d/yr today · 1 by 30 yrs out
Nearby sold comps map
Loading sold comps map…
Walkable amenities ~0.75 mi
Loading nearby amenities…
Taxation est. · year 1
- Rental income
- $20,652
- − Mortgage interest
- −$10,083
- − Property taxes
- −$796
- − Insurance
- −$900
- − Repairs & maintenance
- −$1,652
- − Management
- −$1,652
- − Depreciation
- −$5,236
- Taxable income
- $333
- Est. tax owed @ 24.0%
- −$80
- After-tax cash flow
- $3,212/yr
For passive investors: Depreciation is non-cash, so a rental often shows a tax loss while cash-flowing — sheltering income. Rental losses are passive: they offset passive income freely, and up to $25,000/yr can offset ordinary (W-2) income if you actively participate and your MAGI is under $100k (phasing out to $0 by $150k); unused losses carry forward. On sale, claimed depreciation is recaptured at up to 25%, and gains may owe capital-gains tax (a 1031 exchange can defer both). Figures are a year-1 estimate at your 24.0% rate — not tax advice; consult a CPA.
Schools (NCES district)
- District
- Claremore
- NCES district ID
- 4007740
- Math proficiency
- 24% ▼ -12.00%
- Reading proficiency
- 25% ▼ -11.00%
- Median HH income
- $44,946
- Composite
- 21.16/100
- National rank
- #8426
- State rank
- #111 of 270 in OK
Livability — Claremore
- Score
- 73/100
- State rank
- #20
- US rank
- #5616
Category grades
Schools grade is shown separately in the Schools card above.
Census & demographics
- Census place
- Claremore, OK
- County
- Rogers County · 50,229 people
- City population
- 50,229
- Metro
- Tulsa, OK
- Population (ZIP)
- 29,206
- Household income
- $65,368
- Rent vs Own
- Severe rent burden
- 603.0
Population outlook (Rogers County) Hauer SSP2
- Today (2025)
- 100,211 people
- By 2030
- 104,381 · +4.2%
- By 2040
- 111,567 · +11.3%
- By 2050
- 116,791 · +16.5%
- By 2075
- 129,134 · +28.9%
- By 2100
- 132,326 · +32.0%
Race, ethnicity, and origin ACS 2023
- Neighborhood character
- Diverse neighborhood (Simpson 0.55)
- Race & ethnicity
- White 67% Native American 15% Two or more races 12% Hispanic / Latino 7% Black 1%
- Hispanic origin (detail)
- Mexican 5%
- Common ancestry
- Slovak 2% Lithuanian 1% Portuguese 1%
- Foreign-born
- 3% · Canada
- Languages at home
- 94% English-only · Spanish 4%
Political lean MEDSL · Rogers
- 2024 margin
- Solid R (+55.0) · D 21.6% · R 76.6% · Other 1.7%
- 2008→2024 swing
- -10.9pp toward R · 2008: -44.1pp · 2024: -55.0pp
- All cycles
- 2024: R+55.0 2020: R+54.9 2016: R+56.3 2012: R+50.1 2008: R+44.1
Not yet ingested
- Civics
- —
Market trends
- HPI YoY
- ▼ -57.22%
- Current HPI
- 227.0657
- Rent YoY
- ▲ 2.62%
- Metro
- Tulsa, OK
- State GDP YoY
- ▲ 1.55%
- F500 in state
- 6
Industry mix (Fortune 500 HQ in OK)
| Industry | F500 HQs | Revenue |
|---|---|---|
| Energy | 3 | $48B |
|
||
Price history
+125.3% since first listed12 events — show timeline
- 2026-05-13 Pending — MLS Technology, Inc.
- 2026-05-07 Listed $180,000 MLS Technology, Inc.
- 1993-12-27 Sold (Public Records) $71,000 Public Records
- 1993-09-08 Listed $73,000 MLS Technology, Inc.
- 1993-01-16 Listing Removed — MLS Technology, Inc.
- 1992-07-16 Listing Removed — MLS Technology, Inc.
- 1992-07-16 Listed $79,900 MLS Technology, Inc.
- 1992-01-16 Listed $75,900 MLS Technology, Inc.
- 1991-12-30 Listing Removed — MLS Technology, Inc.
- 1991-06-30 Listing Removed — MLS Technology, Inc.
- 1991-06-30 Listed $79,900 MLS Technology, Inc.
- 1991-01-07 Listed $79,900 MLS Technology, Inc.
Property tax history
+0.1%/yrLatest (2025): $796 · +0.0% YoY. Source: county tax records.
Cash-flow waterfall
monthlySold comps — $/sqft
last 12 mo · ≤1 miLoading sold comps…